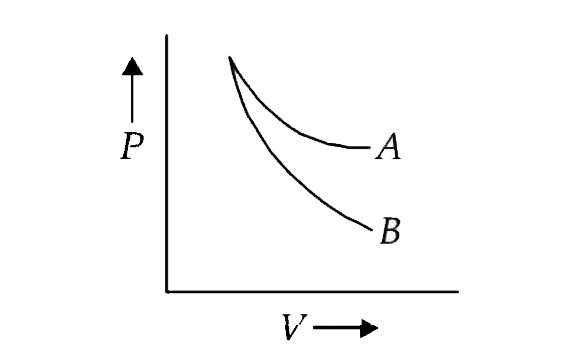
For an adiabatic process graph between PV & V for a sample of ideal gas will be
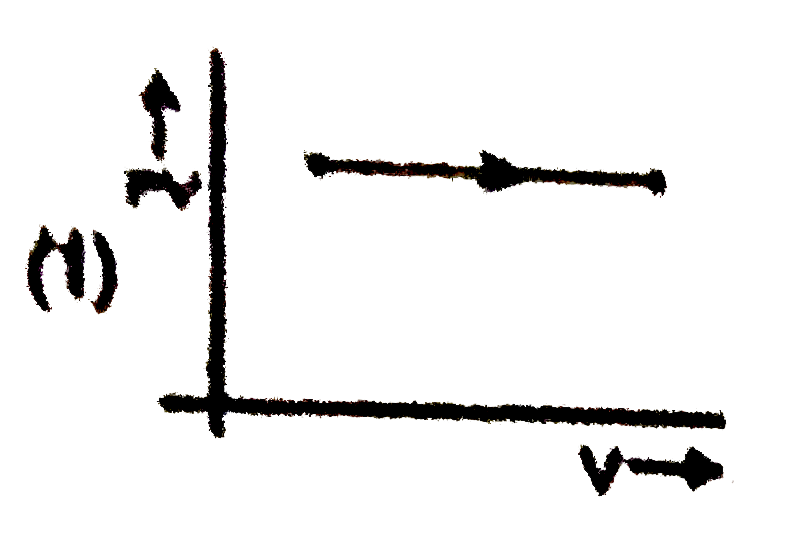
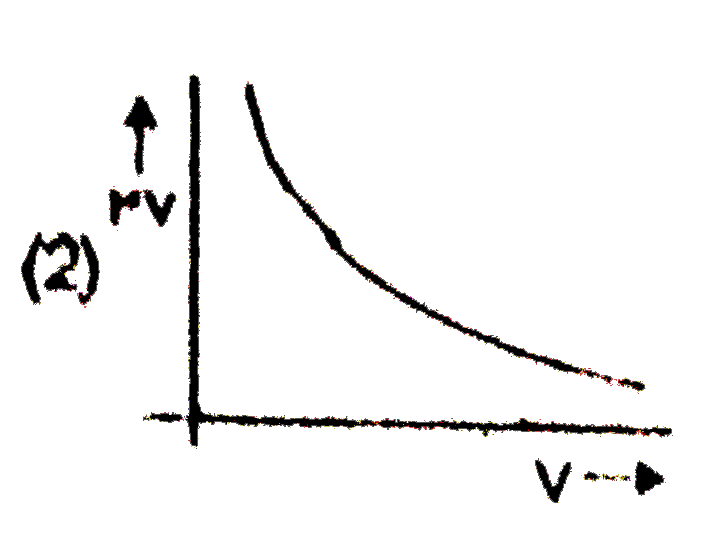
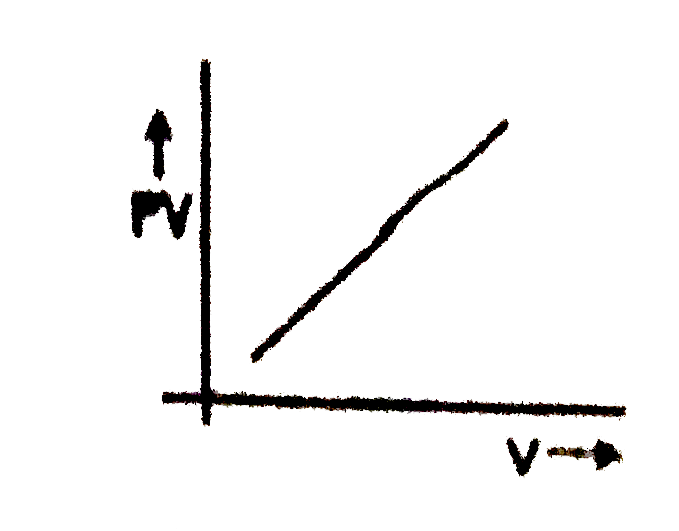
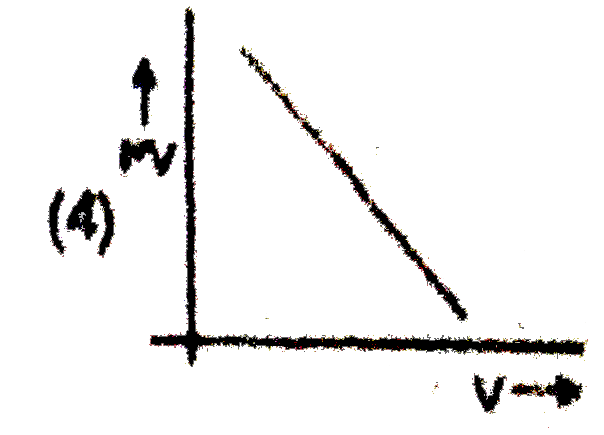
The correct Answer is:B
To determine the nature of the graph between PV and V for an adiabatic process involving an ideal gas, we can follow these steps:
1. Understand the Adiabatic Process:
In an adiabatic process, there is no heat exchange with the surroundings. This means that ΔQ=0.
2. Use the Ideal Gas Law:
For an ideal gas, we can use the equation:
PV=nRT
where P is pressure, V is volume, n is the number of moles, R is the universal gas constant, and T is the temperature.
3. Relate PV to Temperature:
Since PV is proportional to T (for a given amount of gas at constant n and R), we can express this as:
PV∝T
4. Use the Adiabatic Condition:
For a reversible adiabatic process, we have:
PVγ=constant
where γ (gamma) is the heat capacity ratio Cp/Cv.
5. Express PV in terms of Volume:
Rearranging the equation PVγ=constant gives:
P=constantVγ
This indicates that as V increases, P decreases, and vice versa.
6. Graphing PV vs. V:
Since PV is constant for a given volume, we can plot PV on the y-axis and V on the x-axis. The relationship PV∝1Vγ indicates that the graph will be a curve that decreases as V increases.
7. Determine the Nature of the Graph:
The graph between PV and V will not be a straight line (which would indicate a linear relationship) but rather a curve that decreases. This is characteristic of an inverse power relationship.
Conclusion:
The graph between PV and V for an adiabatic process of an ideal gas is a decreasing curve, indicating that as the volume increases, the product PV decreases.
In an adiabatic process, there is no heat exchange with the surroundings. This means that ΔQ=0.
For an ideal gas, we can use the equation:
PV=nRT
where P is pressure, V is volume, n is the number of moles, R is the universal gas constant, and T is the temperature.
Since PV is proportional to T (for a given amount of gas at constant n and R), we can express this as:
PV∝T
For a reversible adiabatic process, we have:
PVγ=constant
where γ (gamma) is the heat capacity ratio Cp/Cv.
Rearranging the equation PVγ=constant gives:
P=constantVγ
This indicates that as V increases, P decreases, and vice versa.
Since PV is constant for a given volume, we can plot PV on the y-axis and V on the x-axis. The relationship PV∝1Vγ indicates that the graph will be a curve that decreases as V increases.
The graph between PV and V will not be a straight line (which would indicate a linear relationship) but rather a curve that decreases. This is characteristic of an inverse power relationship.
The graph between PV and V for an adiabatic process of an ideal gas is a decreasing curve, indicating that as the volume increases, the product PV decreases.
Topper's Solved these Questions
Similar Questions
Knowledge Check
For an adiabatic process the relation between V and T is given by
ATVγ= constantBTγV=constantCTV1−γ= constantDTVγ−1=constantThe ratio of slopes of P−V plots for reversible adiabatic process and reversible isothermal process of an ideal gas is equal to :
AγB1−γCγ−1D1γIn an adiabatic process, R=23Cv. The pressure of the gas will be proportional to:
AT5/3BT5/2CT5/4DT5/6
For adiabatic process of an ideal gas the value of dPP is equals to
View SolutionThe relation between U, p and V for an ideal gas in an adiabatic process is given by relation U=a+bpV. Find the value of adiabatic exponent (γ) of this gas.
View SolutionAn ideal gas undergoes an adiabatic process obeying the relation PV^(4//3) = constant. If its initial temperature is 300 K and then its pressure is increased upto four times its initial value, then the final temperature (in Kelvin):
View SolutionFor the adiabatic expansion of an ideal gas:
View SolutionA : The specific heat of an ideal gas is zero in an adiabatic process.
R : Specific heat of a gas is process independent.
View Solution

