The velocity time graph of a particle moving along a straight line is shown in the figure. In the time interval from to second, answer the following three question.
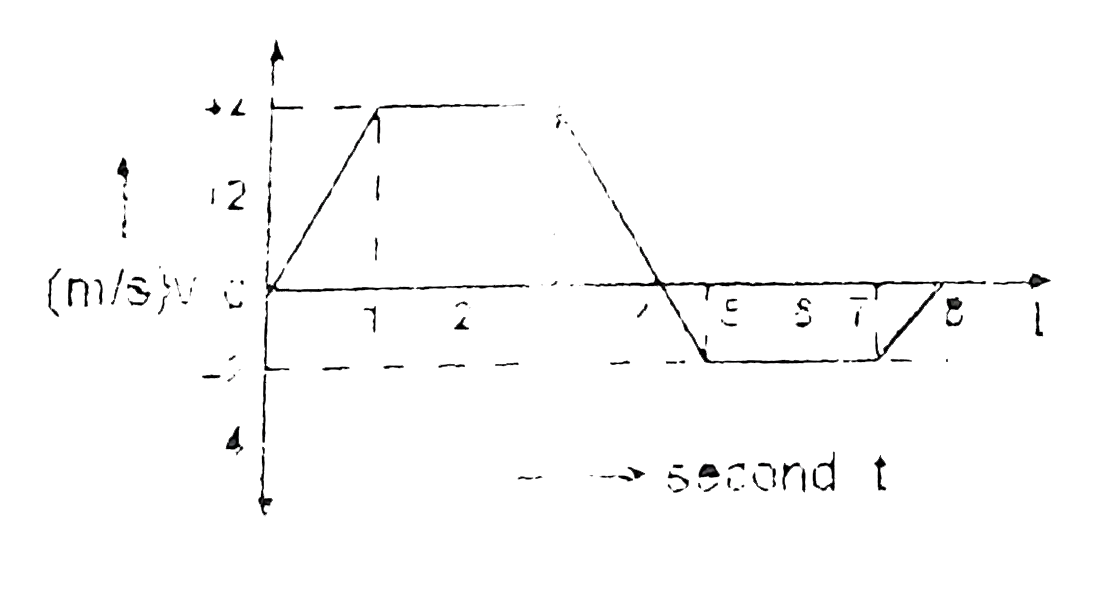
The value of for the given time interval is :
The correct Answer is:D
Distance travelled
magnitude of displacement
average speed
And .
Topper's Solved these Questions
- DAILY PRACTICE PROBLEMBook:RESONANCEChapter:DAILY PRACTICE PROBLEMExercise:DPP No.7
Explore 20 Videos
- DAILY PRACTICE PROBLEMBook:RESONANCEChapter:DAILY PRACTICE PROBLEMExercise:DPP No.8
Explore 9 Videos
- DAILY PRACTICE PROBLEMBook:RESONANCEChapter:DAILY PRACTICE PROBLEMExercise:DPP No.5
Explore 20 Videos
- CURRENT ELECTRICITYBook:RESONANCEChapter:CURRENT ELECTRICITYExercise:High Level Problems (HIP)
Explore 21 Videos
- ELECTRO MAGNETIC WAVESBook:RESONANCEChapter:ELECTRO MAGNETIC WAVESExercise:Exercise 3
Explore 27 Videos
Similar Questions
Knowledge Check
The velocity time graph of a particle moving along a straight line is shown in the figure. In the time interval from t=0 to t=8 second, answer the following three question.
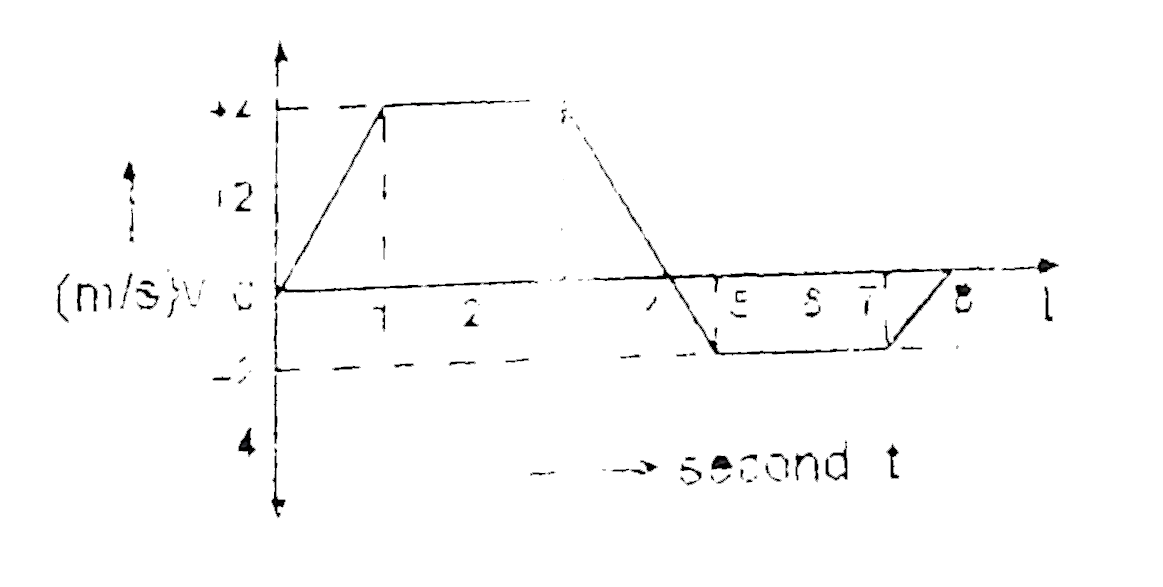
The distance travelled by the particle is :A18 mB6 mC8 mDnone of theseThe velocity time graph of a particle moving along a straight line is shown in the figure. In the time interval from t=0 to t=8 second, answer the following three question.
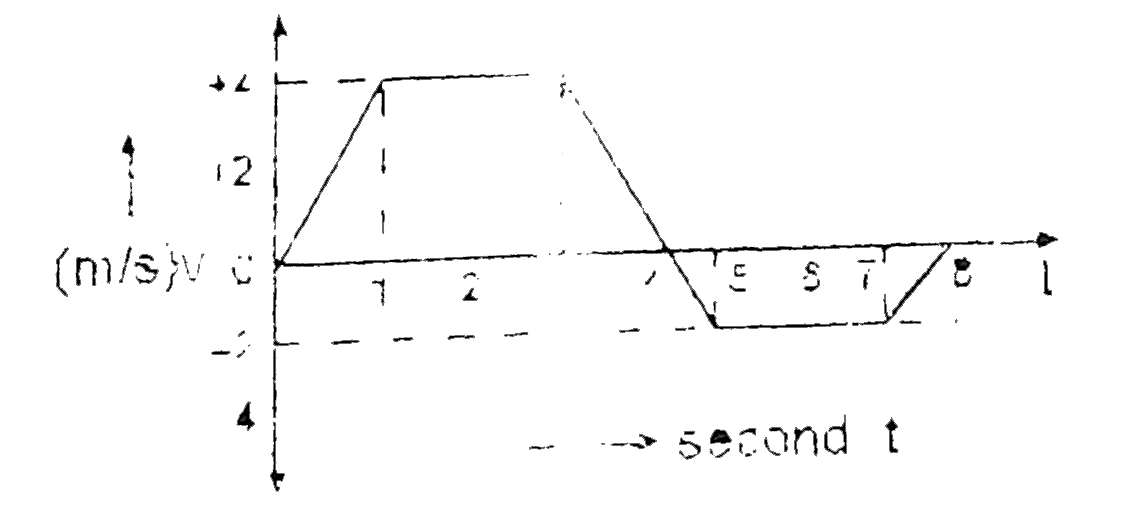
The value of maximum speedaverage speed for the given time interval is :A89B83C169D163The velocity-time graph of a body moving in a straight line is shown in the figure.
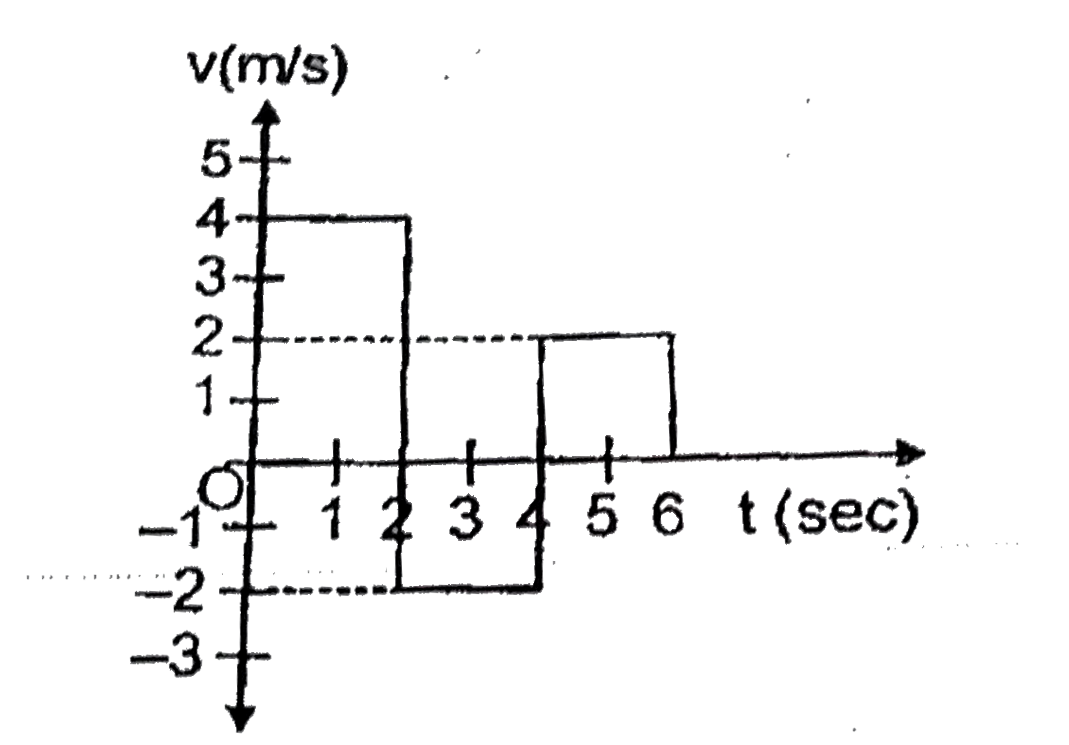 AThe magnitude of displacement of the body in 1st 2 sec is 8 mBThe magnitude of displacement of the body in 1st 4 sec is 4 mCThe distance travelled in 1st 2 sec is 8 mDThe distance travelled in 1st 4 sec is 12 m
Velocity-time graph of a particle moving in a straight line is shown in figure. In the time interval from t=0 to t=14s, find
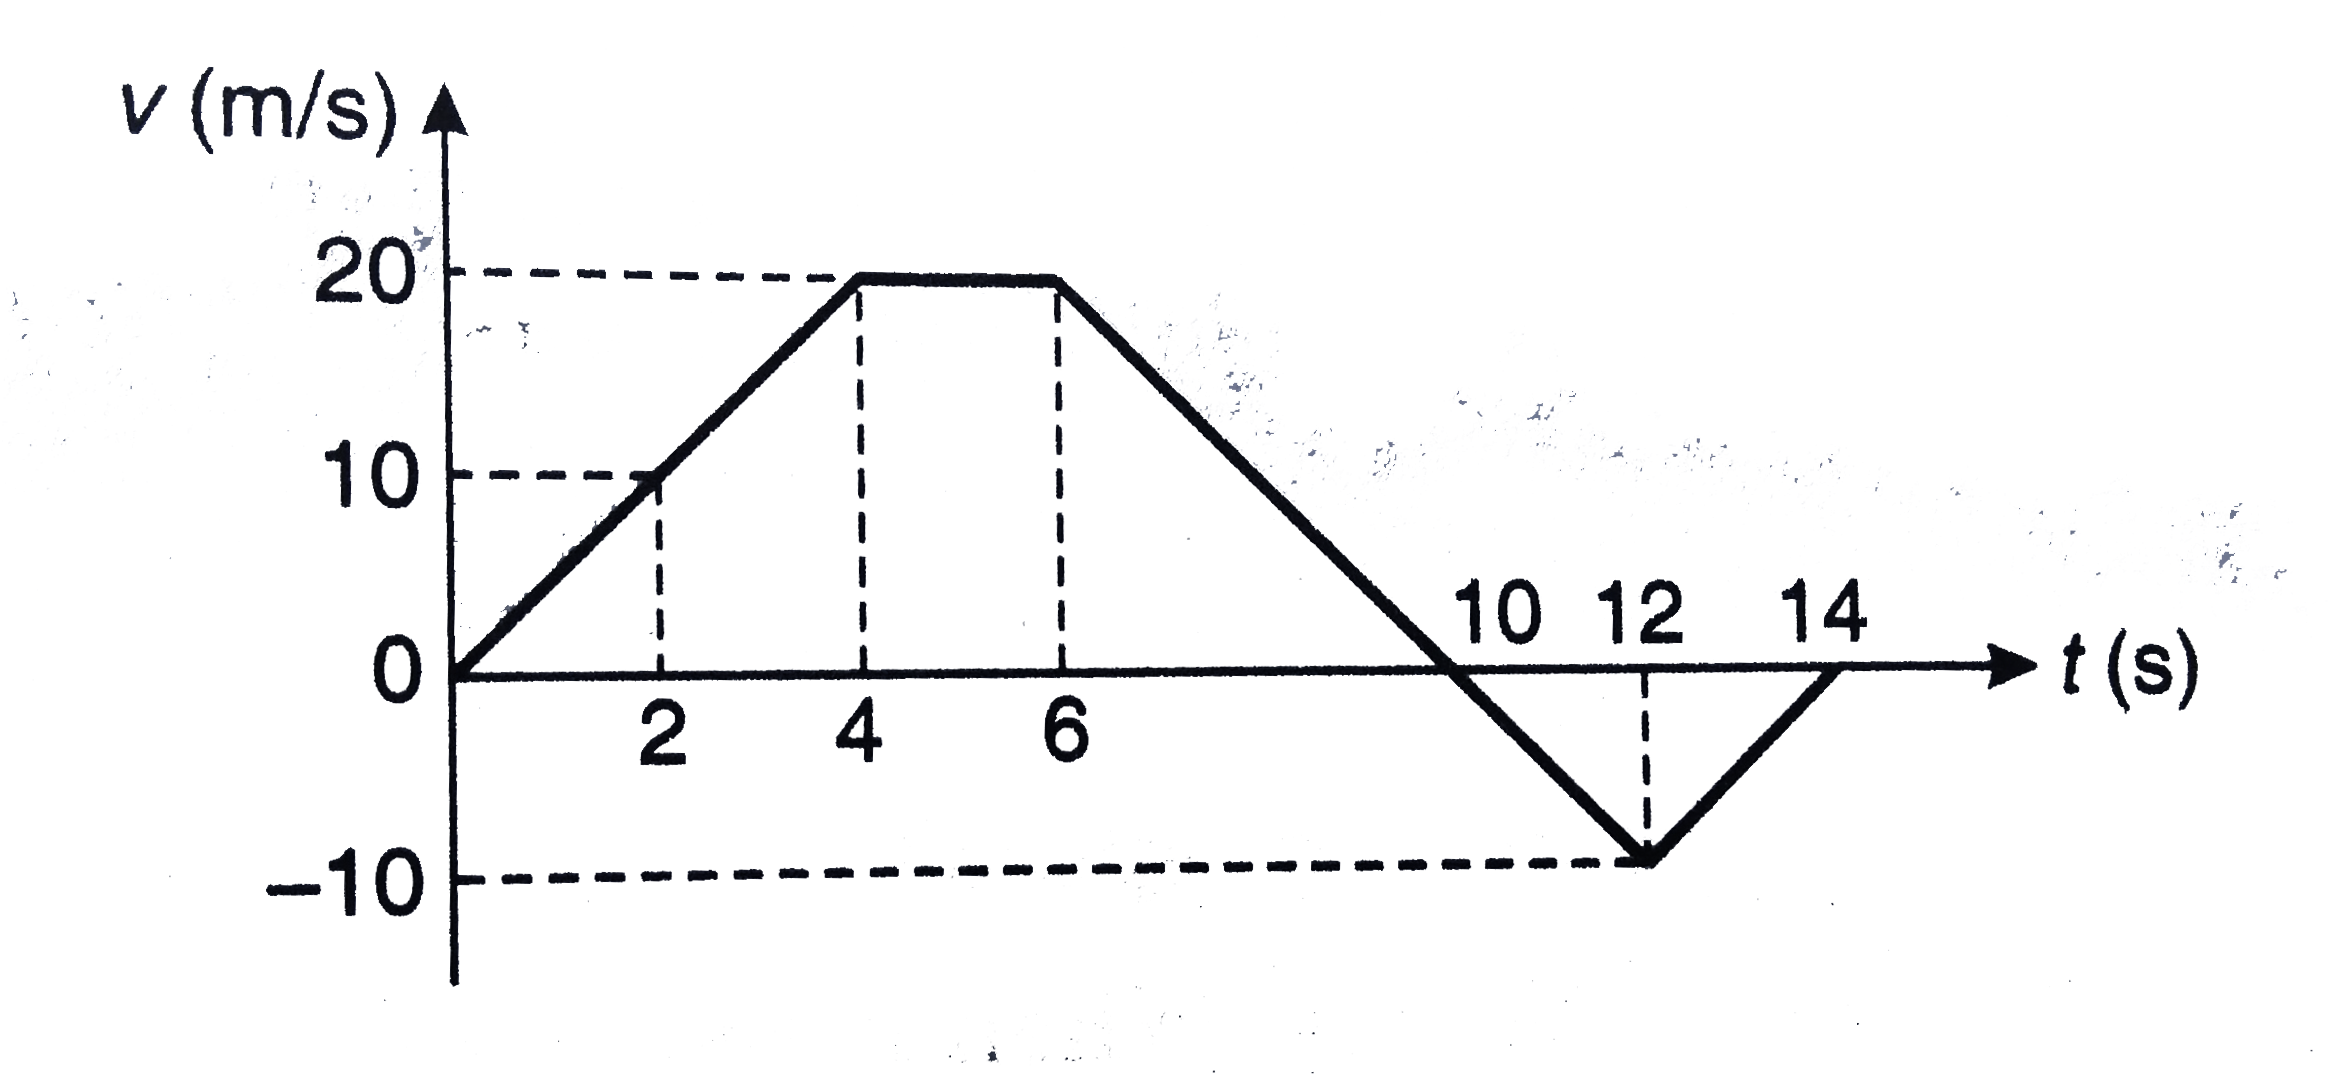
(a) average velocity and
(b) average speed of the particle.
View SolutionVelocity-time graph of a particle moving in a straight line is shown in figure. In the time interval from t = 0 to t = 14 s, find:
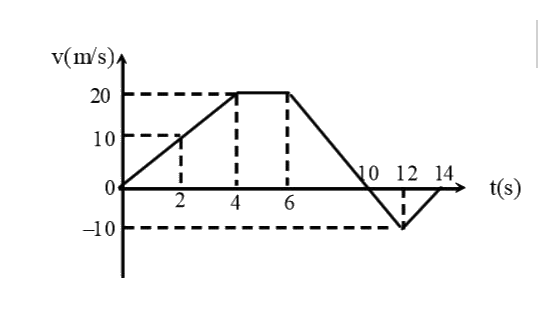
Q. average velocity and
View SolutionVelocity-time graph of a particle moving in a straight line is shown in figure. In the time interval from t = 0 to t = 14 s, find:
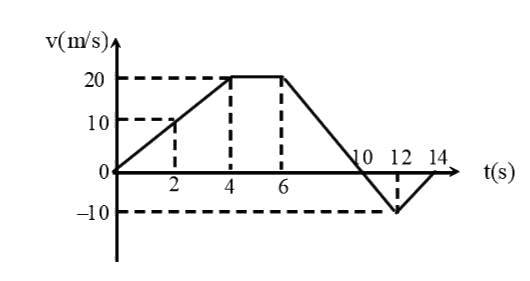
Q. average speed of the particle
View SolutionThe velocity - time graph of a particle moving along a straight line is shown in the figure given below
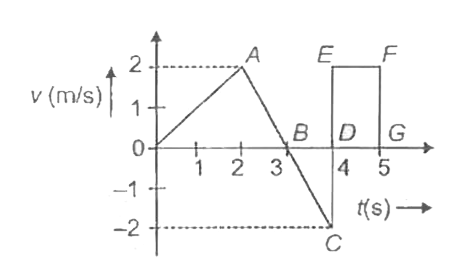
The displacement of the particle in 5 second is
View SolutionThe velocity -time (v−t) graph of a particle moving in a straight line is shown in figure. The acceleration of the particle at t=9 is:
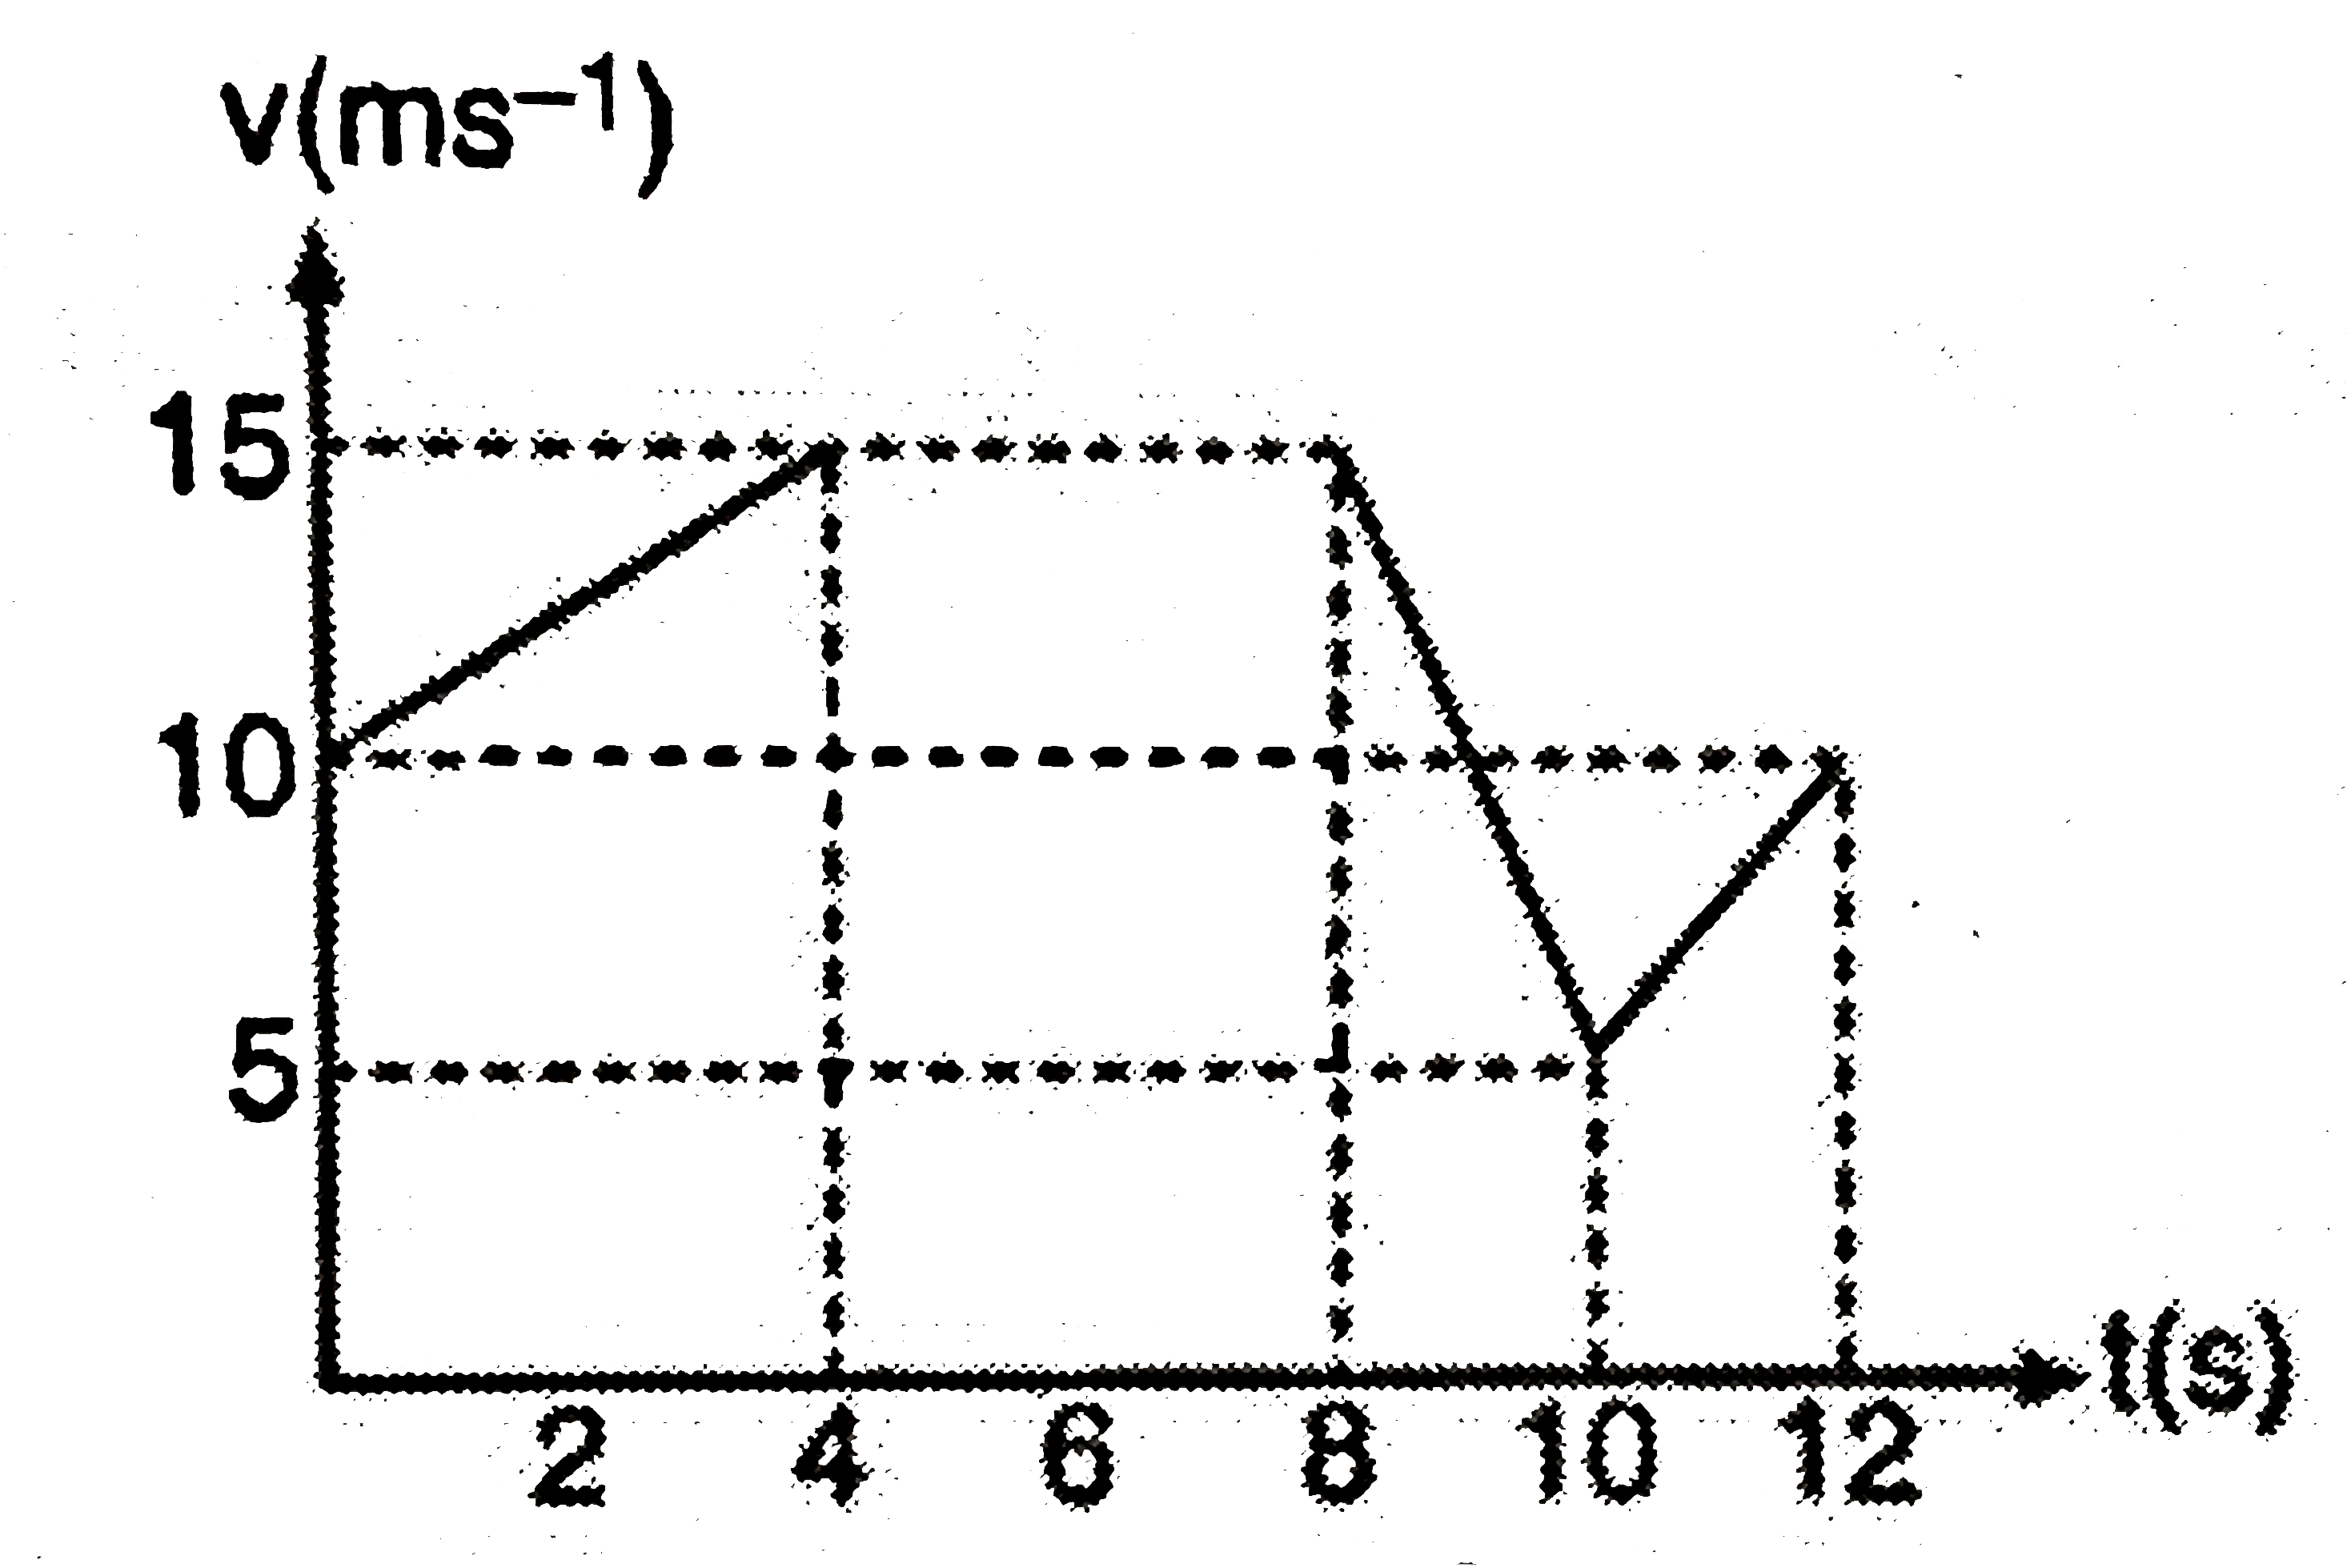
View Solution


