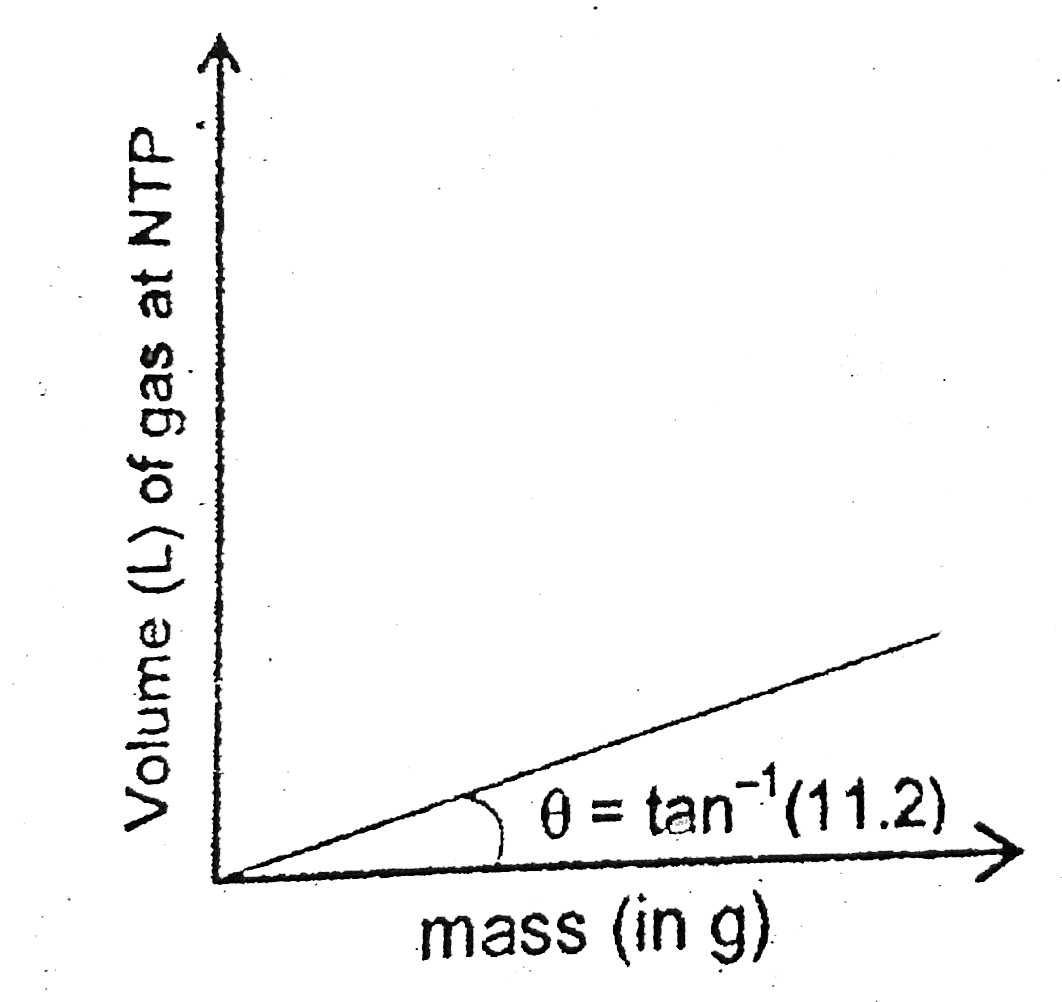
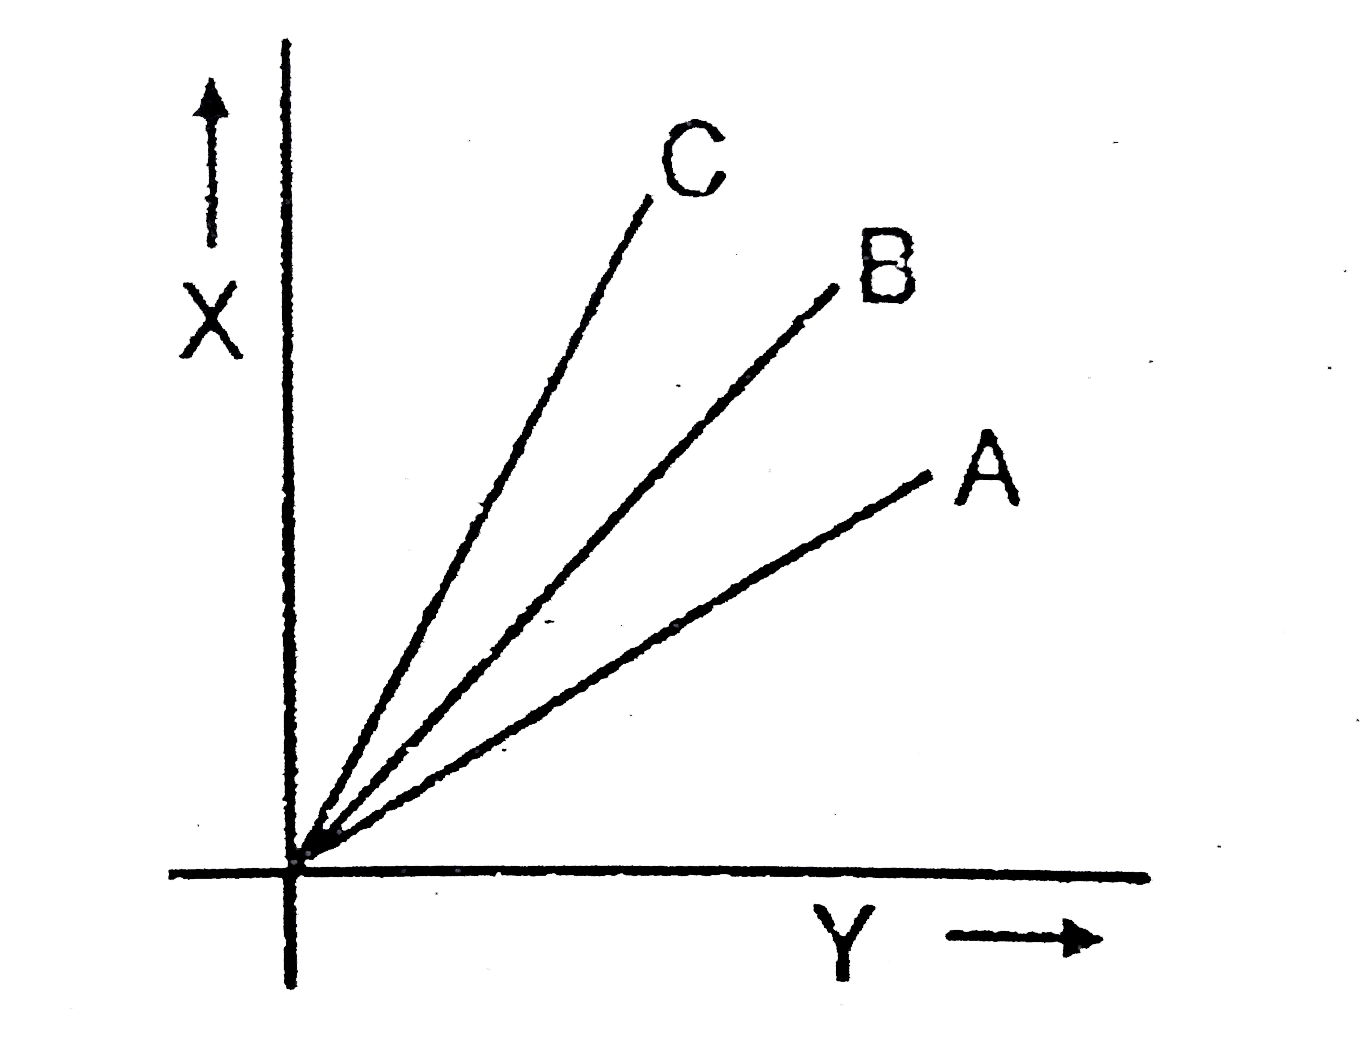
A graph is plotted for gas 'C' , by putting its weight (in gm) on X-axis and the Volume (L) of gas at NTP on Y-axis. Select the correct statement :
Atomic mass of gas is 2 amu.
Atomic mass of gas is 4 amu.
At NTP 5.6 L of gas will have mass equal to its molar mass.
At NTP 11.2 L of gas will have mass equal to its molar mass.
The correct Answer is:A
Agraph is plotted for a gas 'C', by putting …………..
Mole =m(g)M=VL(NTP)22.4
V=(22.4M)×m
⇒(22.4M)=11.2orM=2
Topper's Solved these Questions
- TEST PAPERSBOOK - RESONANCECHAPTER - TEST PAPERSEXERCISE - PART - III CHEMISTRY SEC - 1
12 Videos
- TEST PAPERSBOOK - RESONANCECHAPTER - TEST PAPERSEXERCISE - PART - III CHEMISTRY SEC - 2
18 Videos
- SURFACE CHEMISTRYBOOK - RESONANCECHAPTER - SURFACE CHEMISTRYEXERCISE - Section - 5
1 Video
- TEST SERIESBOOK - RESONANCECHAPTER - TEST SERIESEXERCISE - CHEMISTRY
50 Videos
Similar Questions
Knowledge Check
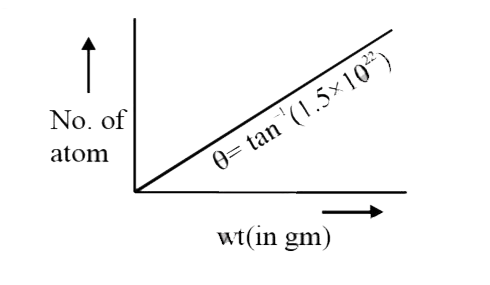
A graph is plotted for an element, by putting its weight on X-axis
and the corresponding number of number of atoms on Y-axis. Determine
the atomic weight of the element for which the graph is plotted.
 AinfiniteB40C0.025D20
If normal the curve y=f(x) is parallel to X-axis, then correct statement is
Adxdy=0Bdydx=0Cdydx=1Ddxdy≠0The graph given below shows the P-V plot for a process on an ideal gas. Select the correct statement.
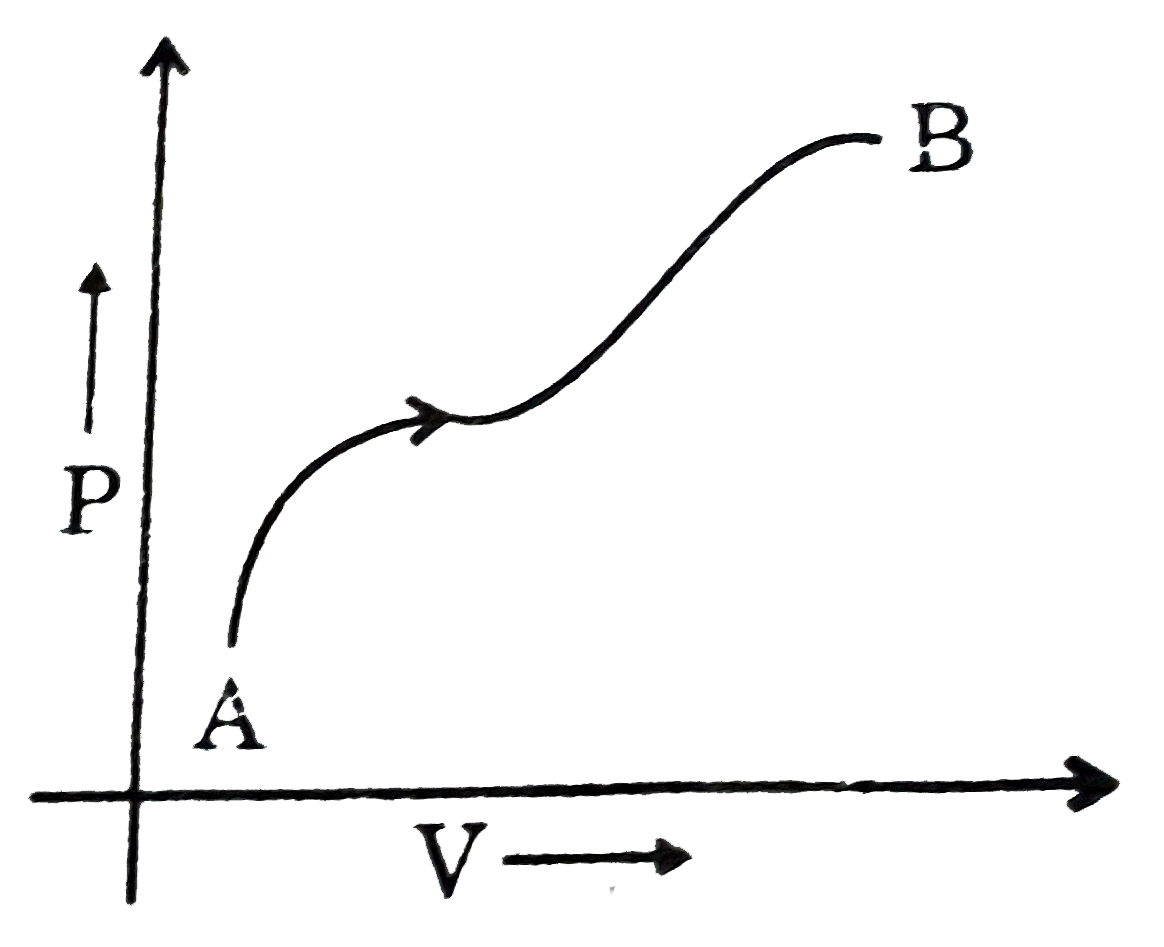 AEnthalpy content of the gas is constantly increasing and the process is carried out slowlyBEnthalpy content of the gas first increases then decreases and the process is quasistaticlyCEnthalpy content of the gas is constant and the process taken infinite amount of time for completionDEnthalpy content first decreases then increases and the process is reversible
By plotting log x/m on y-axis and log P on x-axis we s hould get
View SolutionA sample of mono-atomic ideal gas is taken through a cyclic process ABCDA. A graph is plotted in which heat exchanged by the gas upto an instant is shown on x-axis and work done by the gas upto that instant is shown on y-axis.
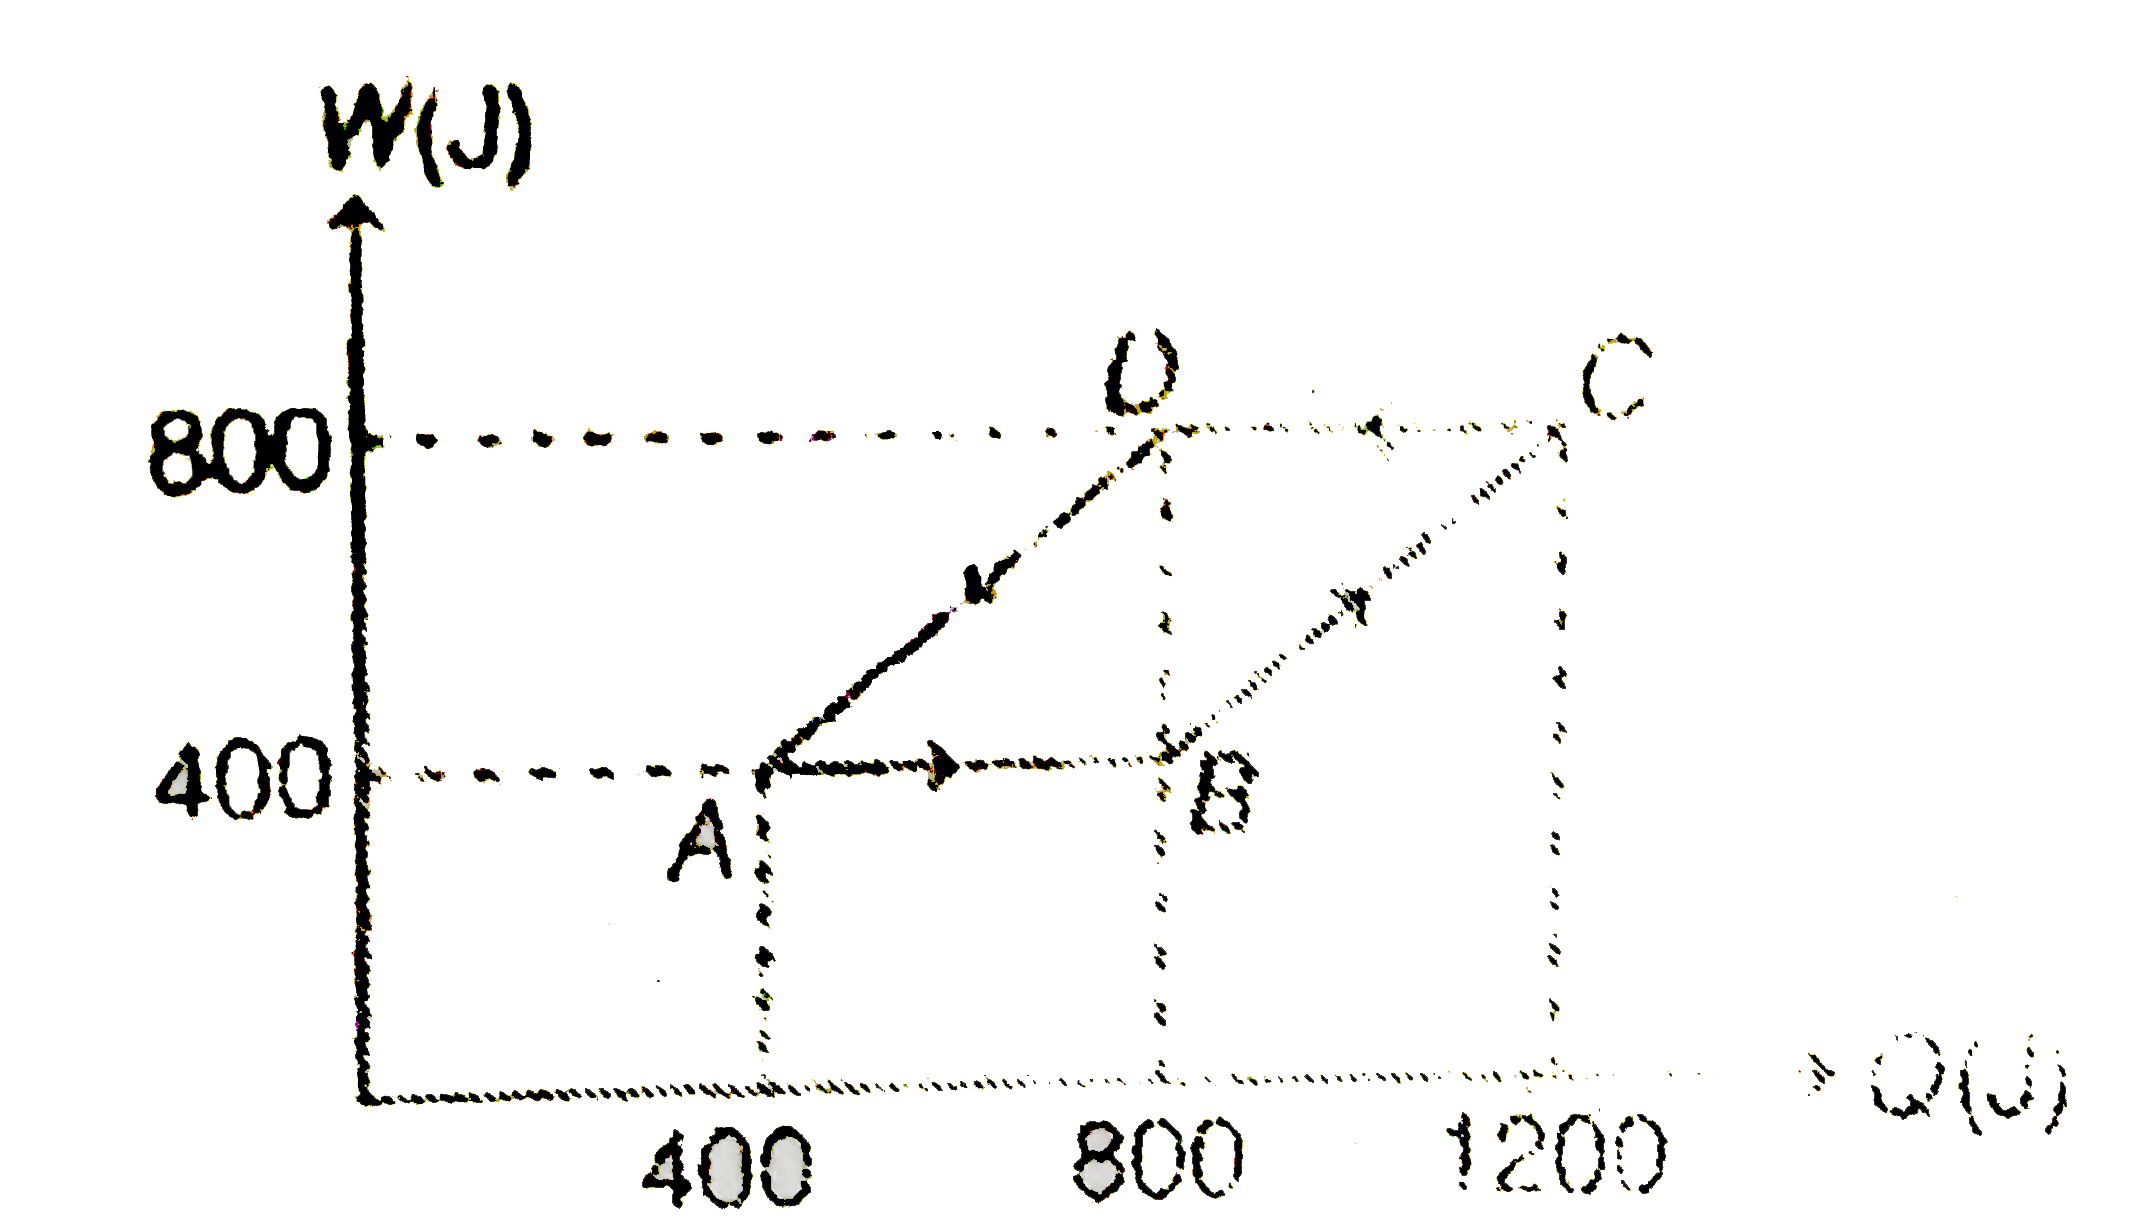
Choose incorrect statement:
View SolutionFollowing graph is plotted between characteristics 'X' and 'Y' for three spices A,B and C.
Now select the correct statement(s), relted to the above graph :
View SolutionA graph was plotted taking the temperature in .∘C along the X-axis and the corresponding temperature in Kelvin along the Y-axis. Which of the curves in Fig, 6.1 most correctly represents this behaviour?
View SolutionSelect the correct statement. In the gas equation, PV = nRT
View Solution