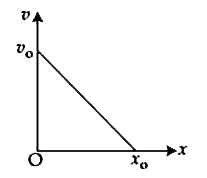
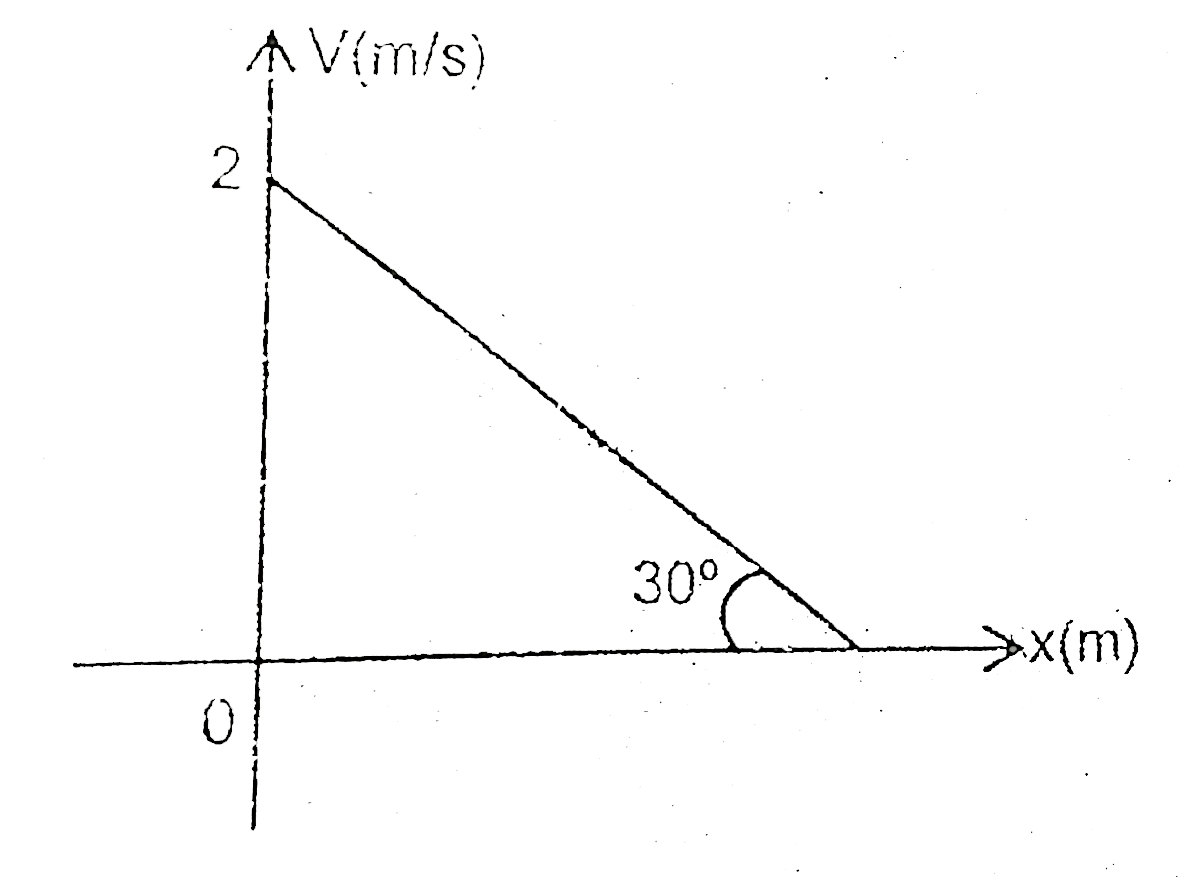
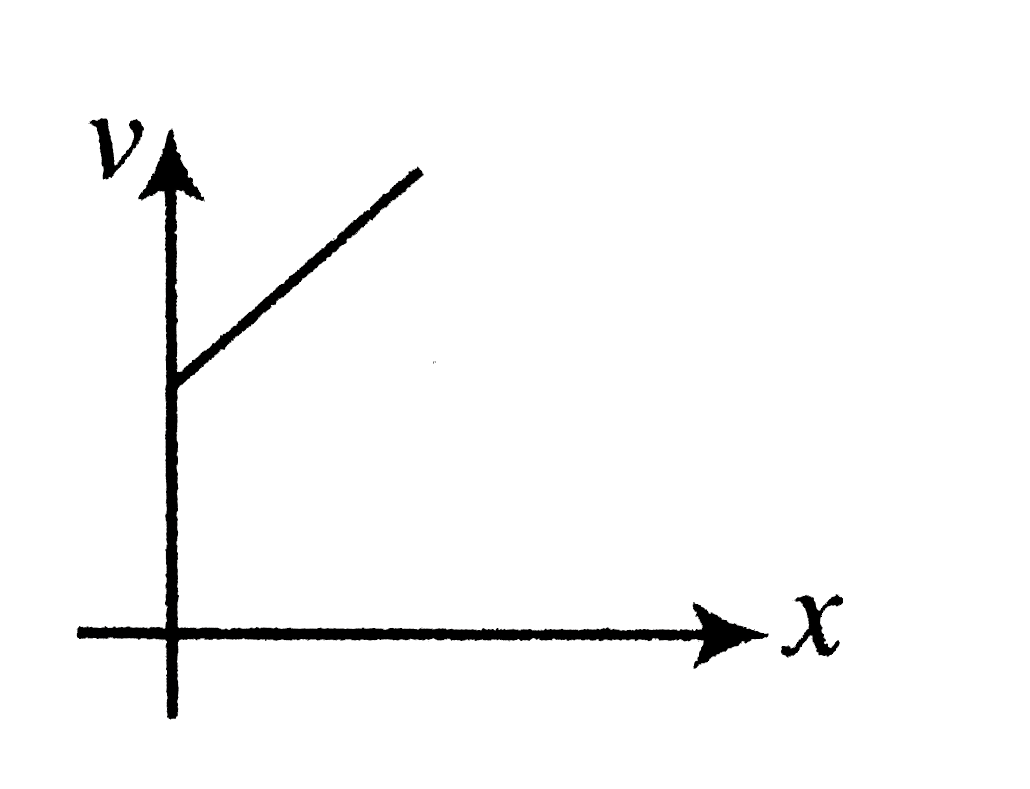
The velocity displacement graph of a particle is shown in figure. The acceleration of the particle when x=0 is.
A
1√3m/s2
B
−2√3m/s2
C
23m/s2
D
None of the above
Video Solution
Text Solution
The correct Answer is:B
The velocity …………… ltbRrgt From figure −tan30∘=dvdx
∵ acceleration a=vdvdx
a=−vtan30∘ ltbtgt atx=0,v=2m/s (from figure)
soa=−2tan30∘
a=−2√3m/s2
|
Similar Questions
Knowledge Check
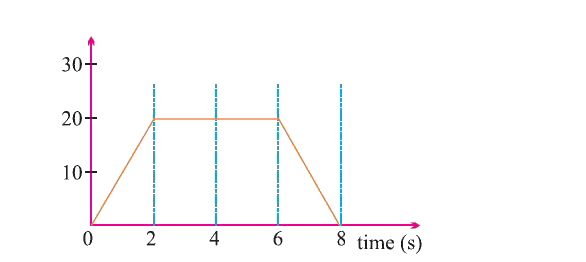
The velocity − time graph of a particle is as shown in figure
 AIt moves with a constant acceleration throughoutBIt moves with an acceleration of constant magnitude but changing direction at the end of every two secondCThe displacement of the particle is zeroDThe velocity becomes zero at t=4 second
velocity time graph of a particle is shown in figure. Find displacement of the particle.
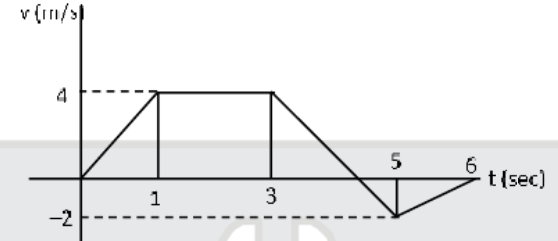 A7B11C5D15
Velocity versus displacement graph of a particle moving in a straight line as shown in figure.
The acceleration of the particle.Ais constantBincreases linearly with xCincreases parabolically with xDNone of these
The velocity-displacement graph of a particle is shown in the figure. Write the relation/equation between v and x.
 .
.
View SolutionVelocity (v) versus position (x) graph of a particle is shown.The acceleration of the particle at x=1m is ?
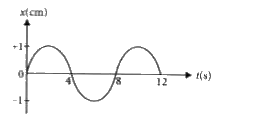
View SolutionThe x-t graph of a particle undergoing SHM is as shown in figure. The acceleration of the particle at t=2/3 is
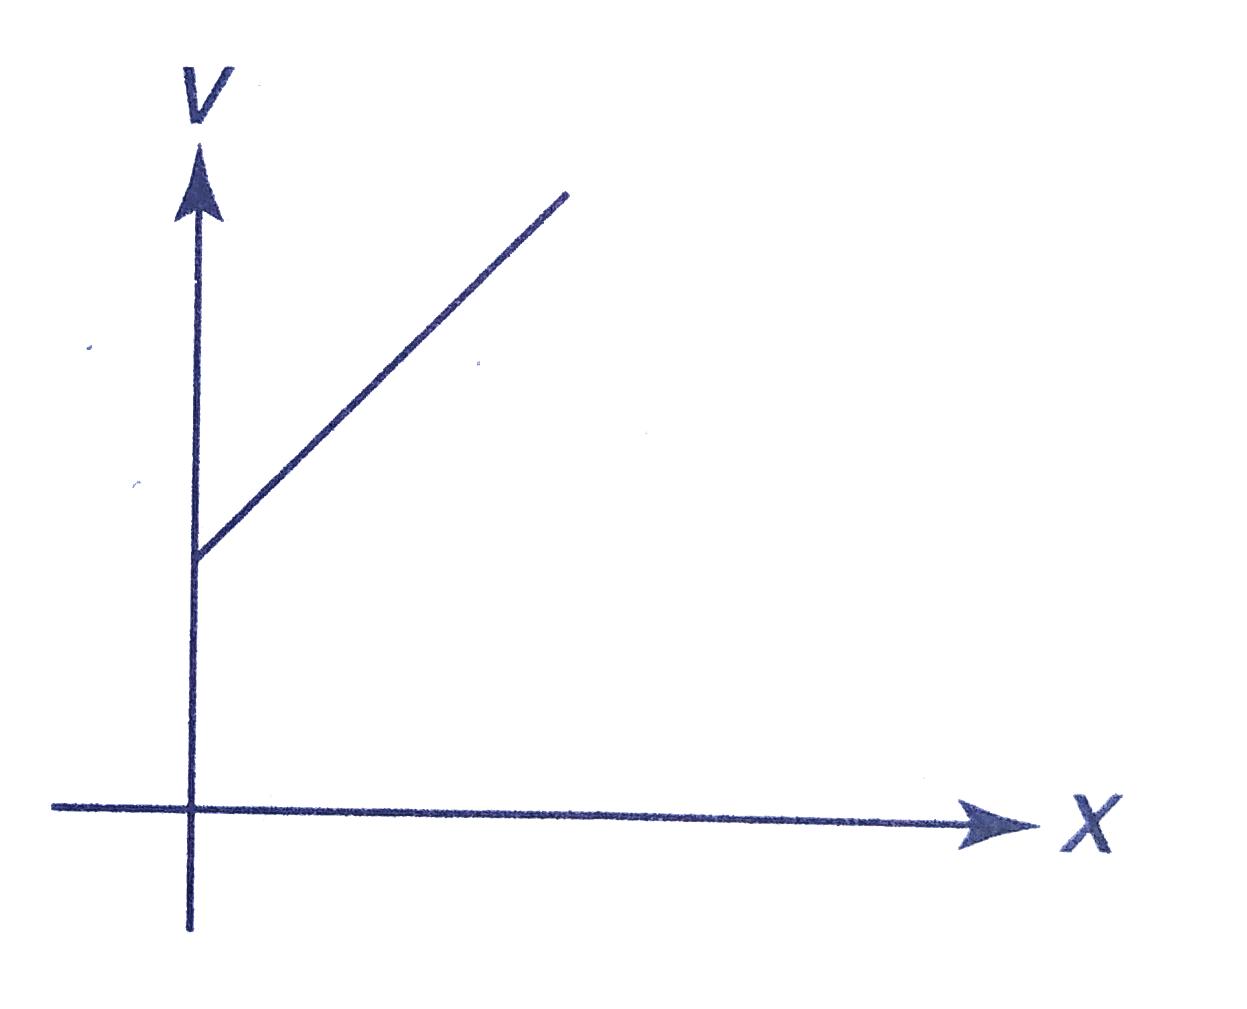
View SolutionGraph of velocity versus displacement of a particle moving in a straight line is as shown in figure.
The acceleration of the particle is.
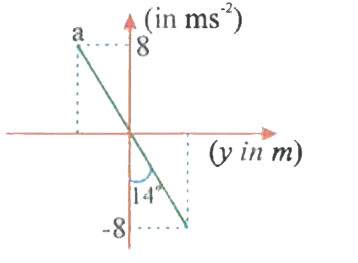
View SolutionThe acceleration-displacement graph of a particle executing SHM is as shown in the figure. The velocity of the particle at y = 0 is (take tan14∘ = 0.25)
View Solution

