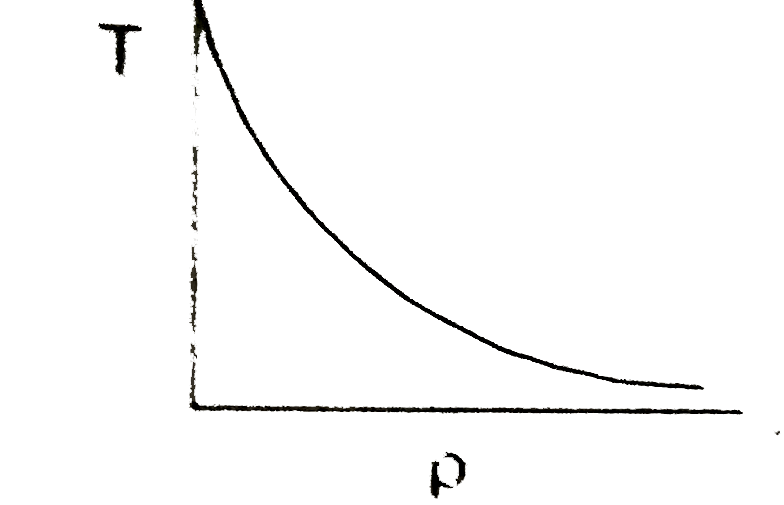
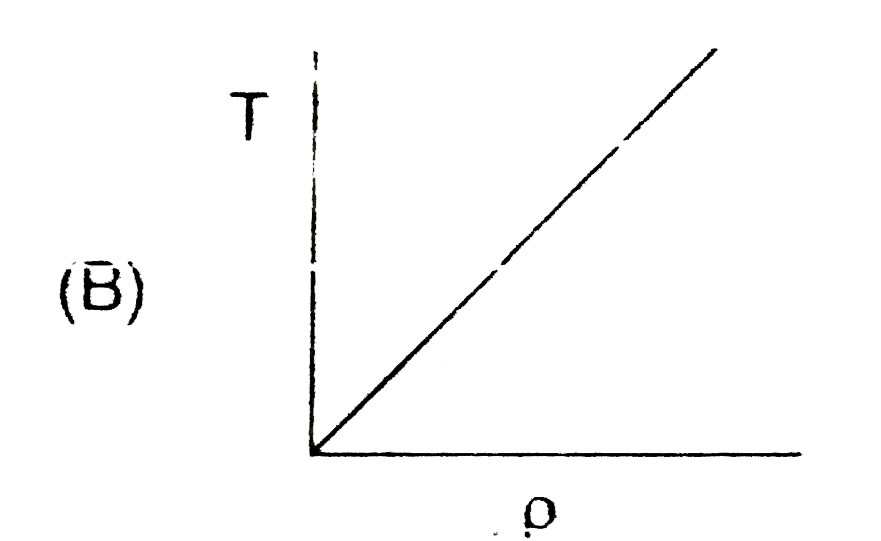
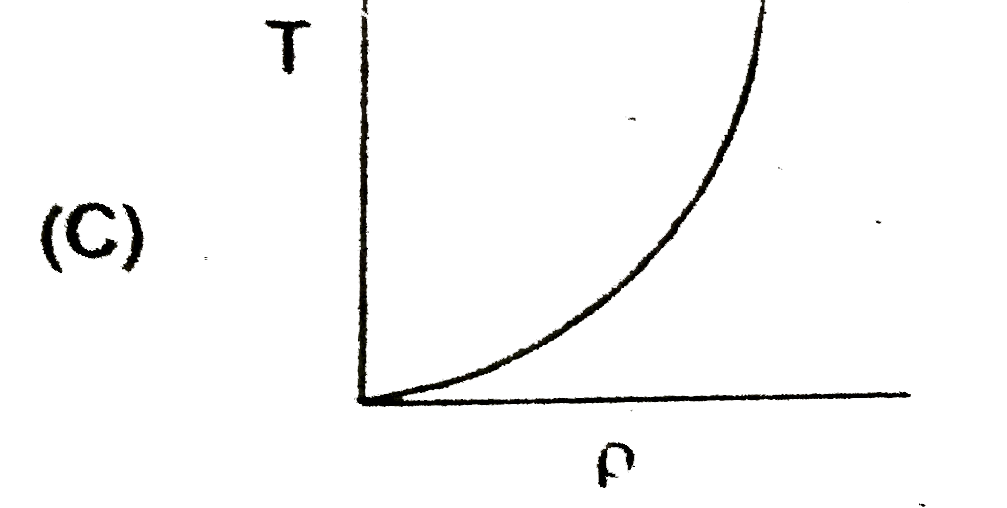
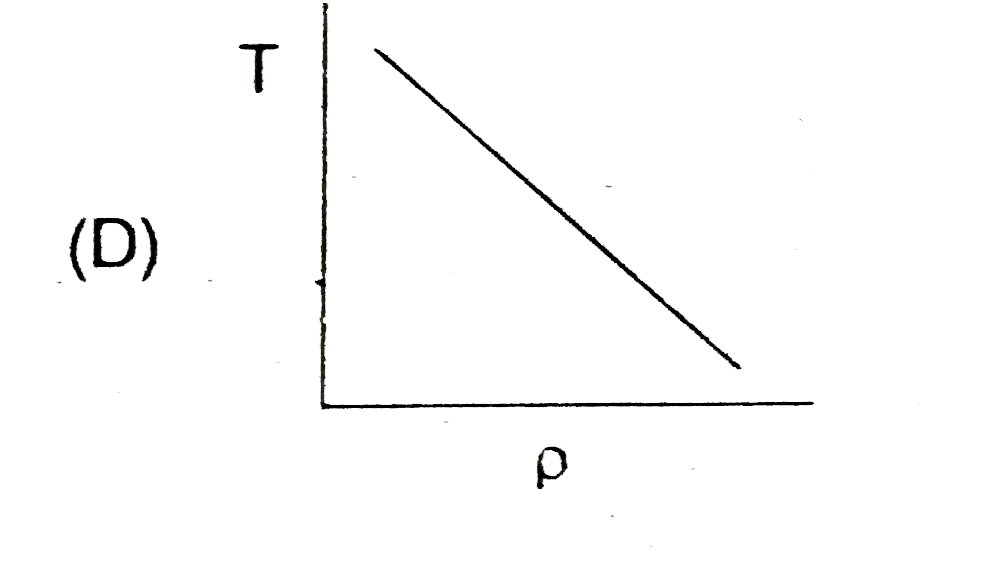
Which of the following is a graph of the relation of the density (ρ) of a gas sample to the absolute tempeature keeping constant pressure.
A
B
C
D
Video Solution
Text Solution
The correct Answer is:A
PM=ρRT
or ρT=RPR
or ρT= constant.
|
Topper's Solved these Questions
- STOICHIOMETRY AND BALANCING REDOX REACTION BOOK - FIITJEECHAPTER - STOICHIOMETRY AND BALANCING REDOX REACTION EXERCISE - SINGLE INTEGER ANSWER TYPE QUESTIONS
5 Videos
- THERMODYNAMICS AND THERMOCHEMISTRY BOOK - FIITJEECHAPTER - THERMODYNAMICS AND THERMOCHEMISTRY EXERCISE - SINGLE INTEGER ANSWER TYPE QUESTIONS
5 Videos
Similar Questions
Knowledge Check
Which of the following graph represents the variation of amount of chemisorption of a gas by a solid with temperature under constant pressure?
A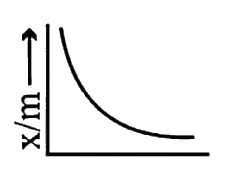 B
B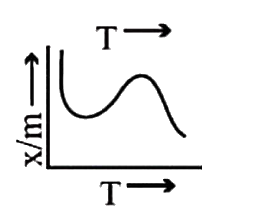 C
C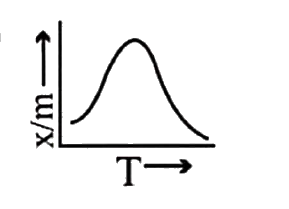 D
D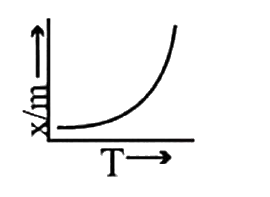
At a constant pressure, of the following graphs that one which represents the variation of the density of an ideal gas with the absolute temperature T, is
A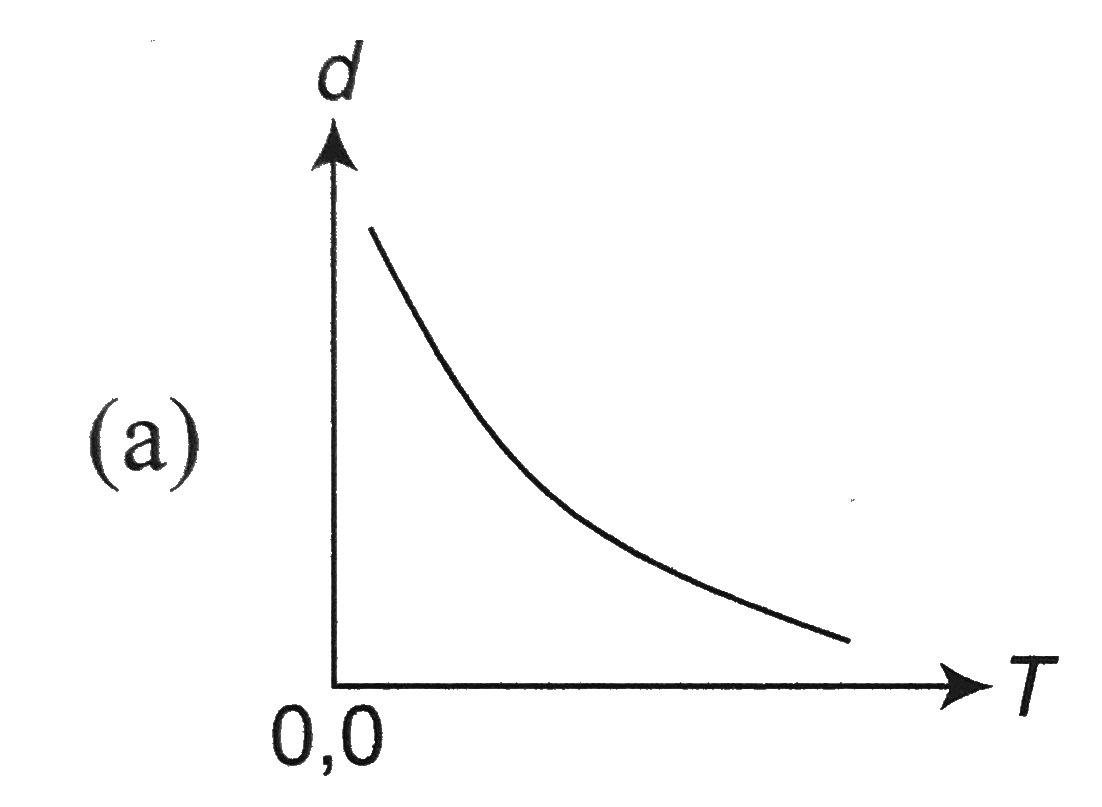 B
B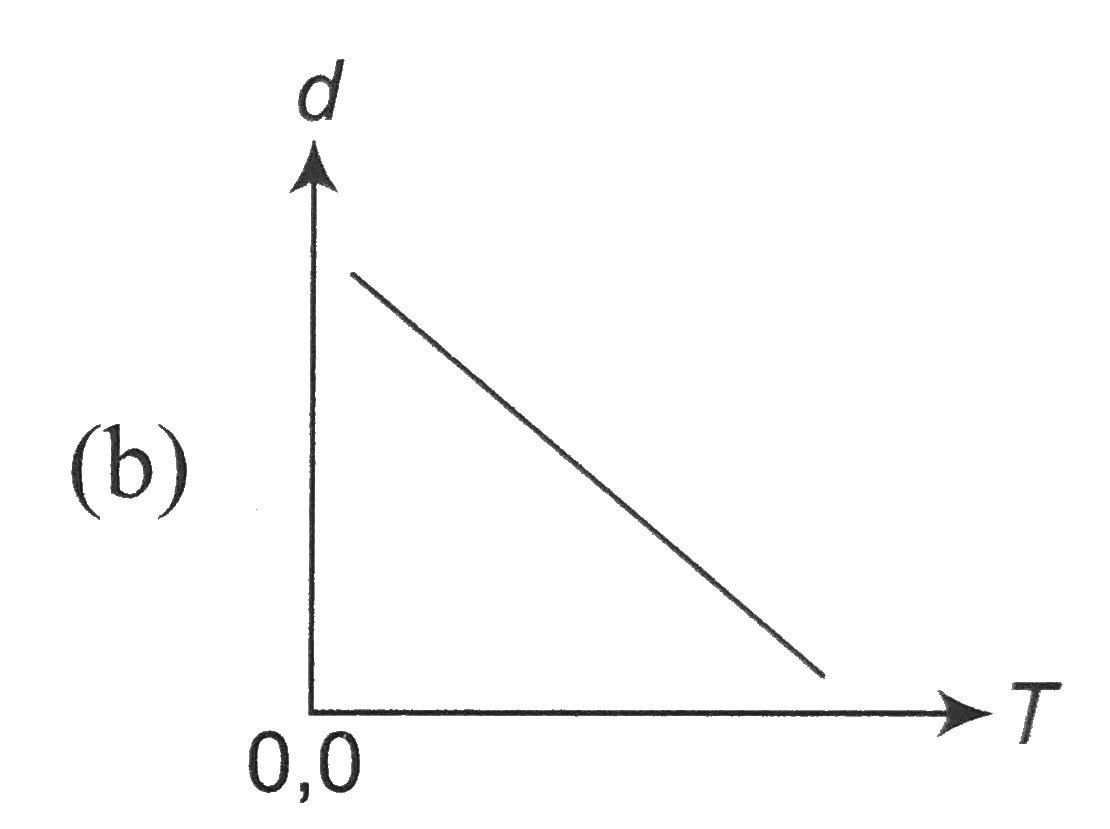 C
C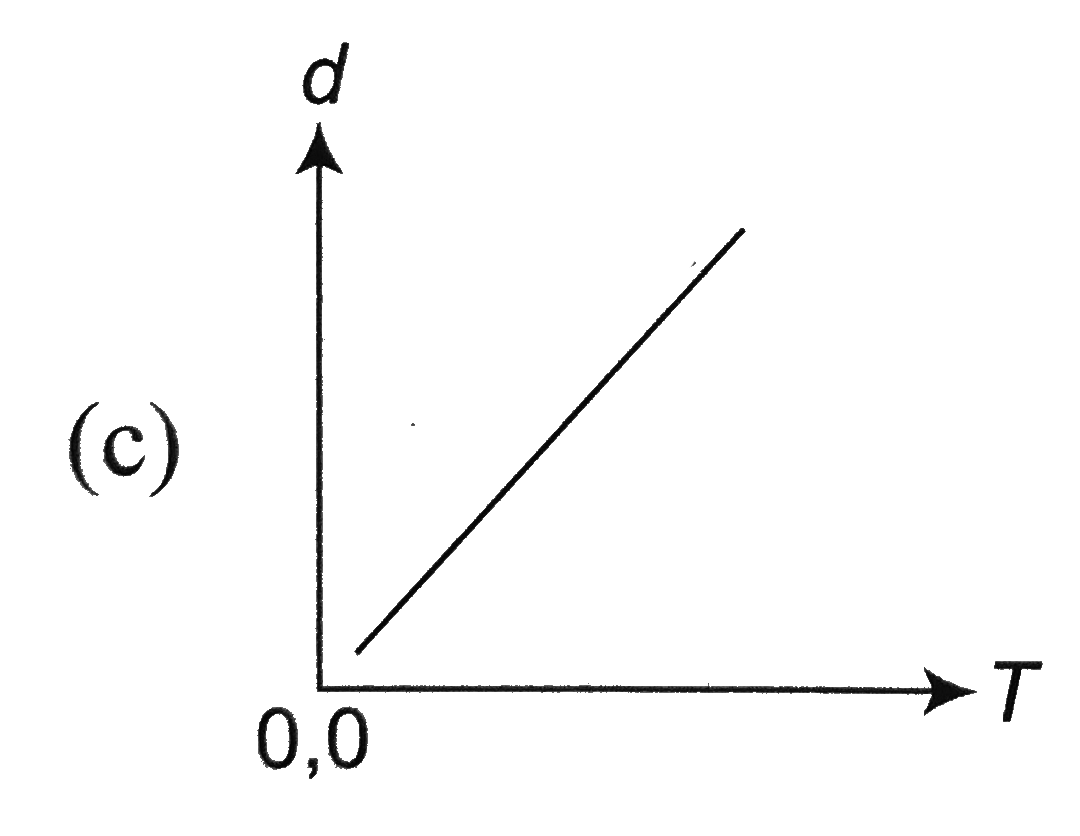 D
D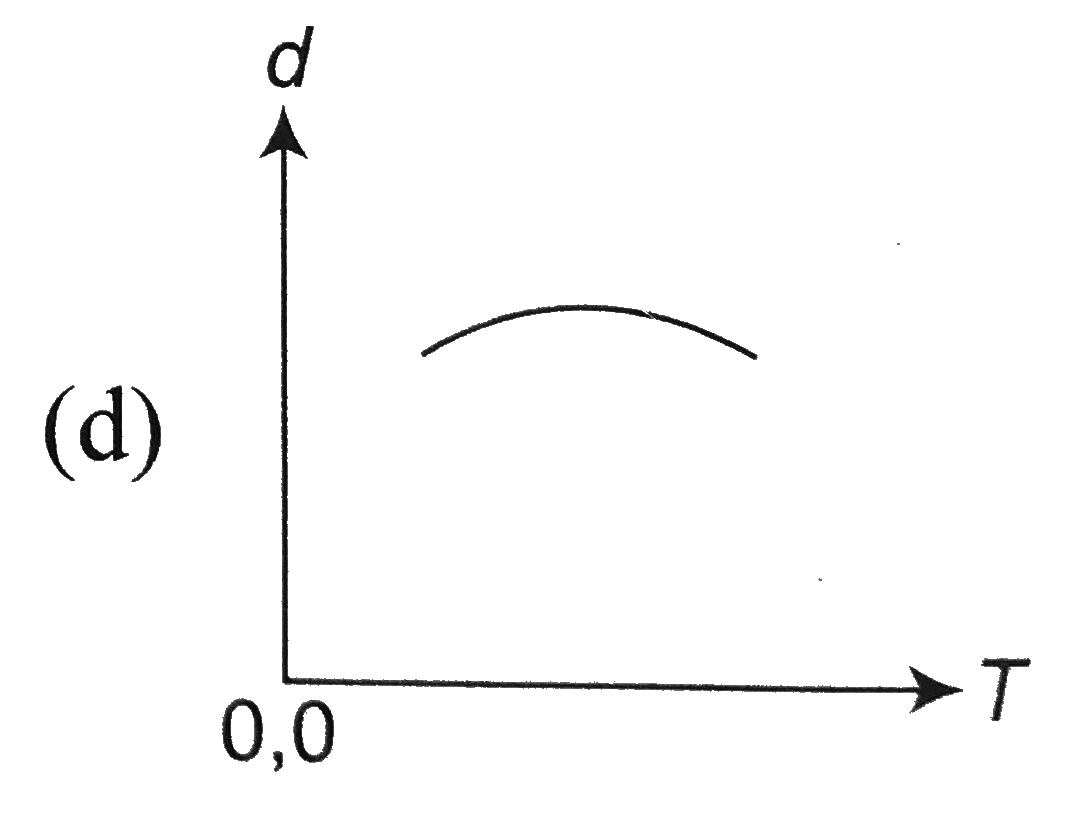
Which one of the following graph is correct at constant pressure?
A B
B C
C D
D
which one of the following graph is not correct for ideal gas ?
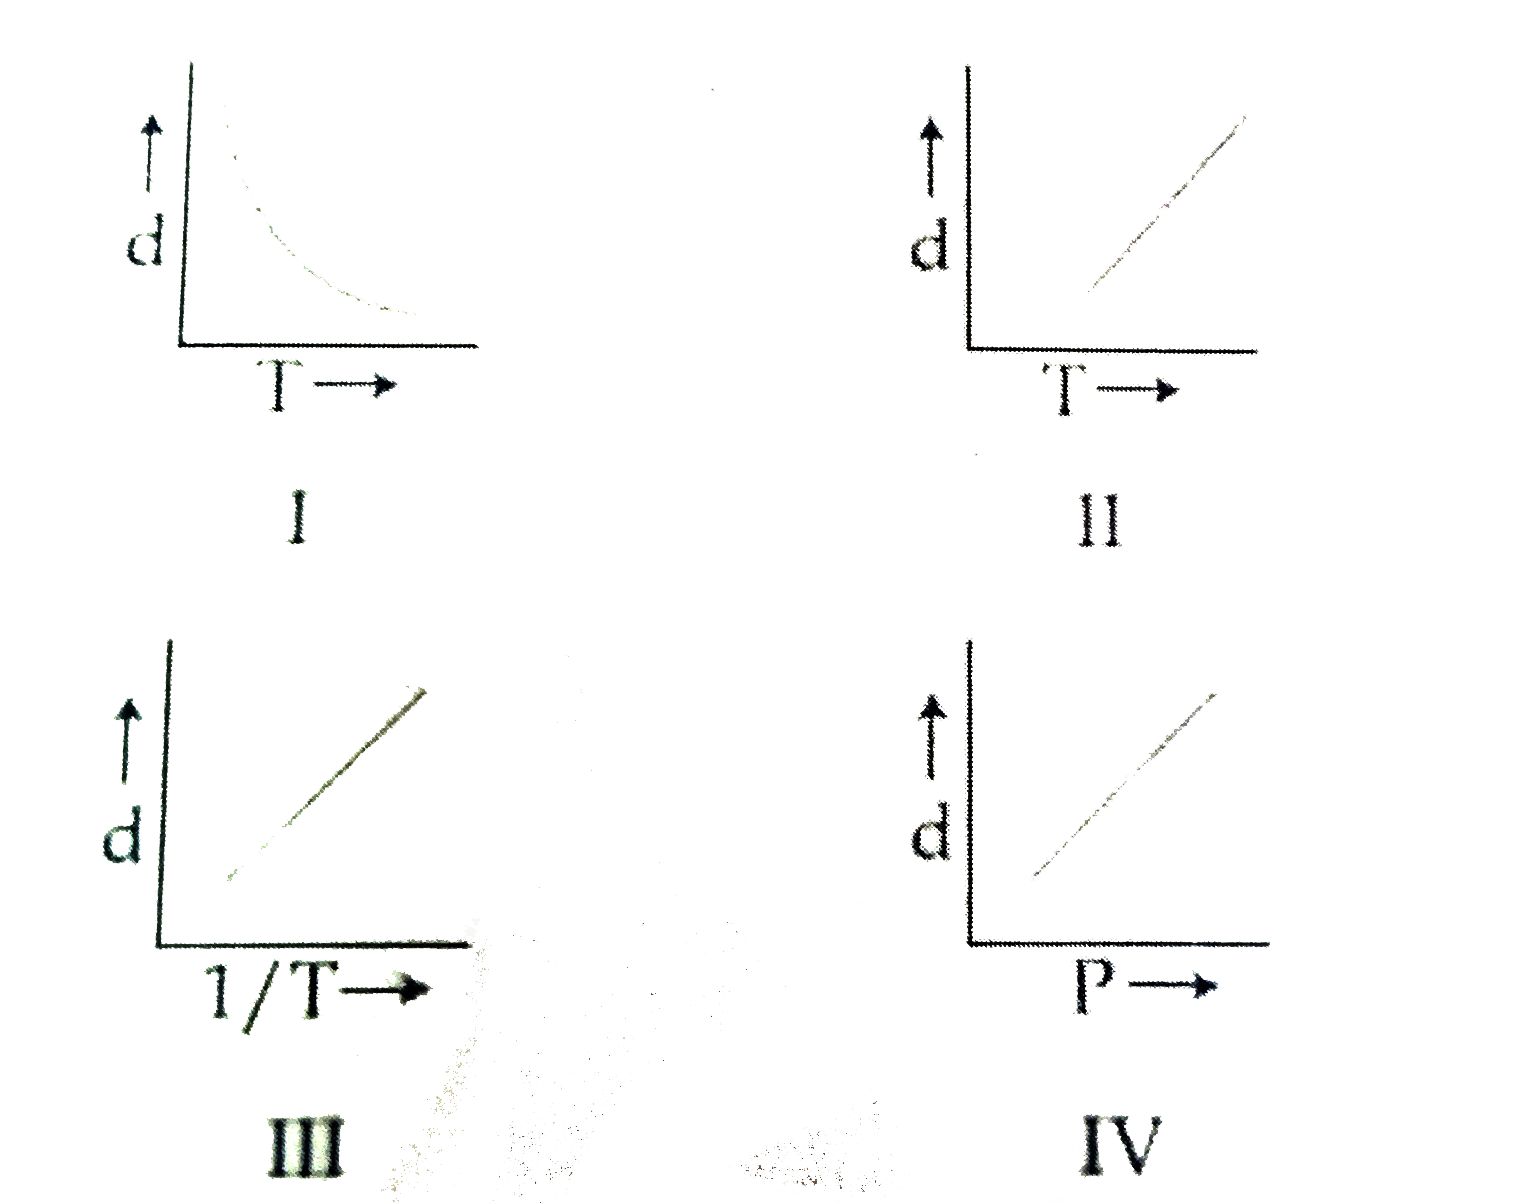
d=density ,P=pressure,T=Temperature
View SolutionWhich of the following graph best represents the relationship between absolute temperature of gas and the average kinetic energy of the gas molecules?
View SolutionWhich of the following shown the correct relationship between the pressure 'P' and density ρ of an idealgas at constant tem pera ture?
View SolutionAt constant pressure density of a gas is
View SolutionHeat supplied to an ideal gas sample at constant Pressure :
View Solution
