Which of the following plots represents an ideal binary mixture?
plot of Ptotalv/s1/XB is linear (XB= mole fraction of 'B' in liquid phase)
plot of Ptotalv/sYA is linear (YB= mole fraction of 'A' in vapour phase)
plot of 1Ptotalv/sYA is linear
plot of 1Ptotalv/sYB is non linear
The correct Answer is:C
1Ptotal=YAP∘A+YBP∘B
1Ptotal=YAP∘A+1−YAP∘B
1Ptotal=YA(P∘B−P∘A)P∘A×P∘B+1P∘B
Topper's Solved these Questions
- SOLUTIONSBook:ALLENChapter:SOLUTIONSExercise:EXERCISE-03
Explore 22 Videos
- SOLUTIONSBook:ALLENChapter:SOLUTIONSExercise:EXERCISE-04 [A]
Explore 17 Videos
- SOLUTIONSBook:ALLENChapter:SOLUTIONSExercise:EXERCISE -01
Explore 53 Videos
- S-BLOCK ELEMENTS Book:ALLENChapter:S-BLOCK ELEMENTS Exercise:EXERCISE -3
Explore 1 Video
- Some Basic Concepts of Chemistry (Mole concept)Book:ALLENChapter:Some Basic Concepts of Chemistry (Mole concept)Exercise:All Questions
Explore 39 Videos
Similar Questions
Knowledge Check
Which of the following plots are correct for an ideal gas ?
A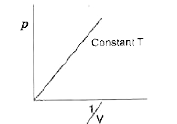 B
B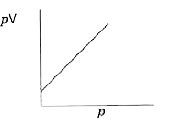 C
C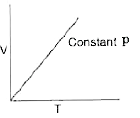 D
D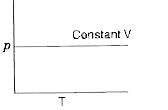
Which of the following plots represents an exothermic reaction?
A B
B C
C D
D
Which of the following plots represents an exothermic reaction?
A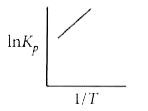 B
B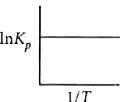 C
C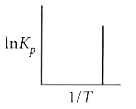 D
D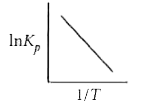
Which of the following is/are correct for an ideal binary correct of two volatile liquid (e.g., benzene and toluene)?
View SolutionWhich of the following is are correct for an ideal binary solution of two volatile liquids (eg. Benzene and toluene) ?
View SolutionWhich of the following plots represents schematically the dependence of the time period of a pendulum if measured and plotted as a function of its oscillations? (Note : amplitude need not be small)
View SolutionWhich of the following plots represents correctly variation of equivalent conductance (Λ) with dilution for a strong electrolyte ?
View SolutionWhich of the following represents a solid liquid mixture ?
View Solution

