Which of the following curve represents the variation of λM with √C for AgNO3?
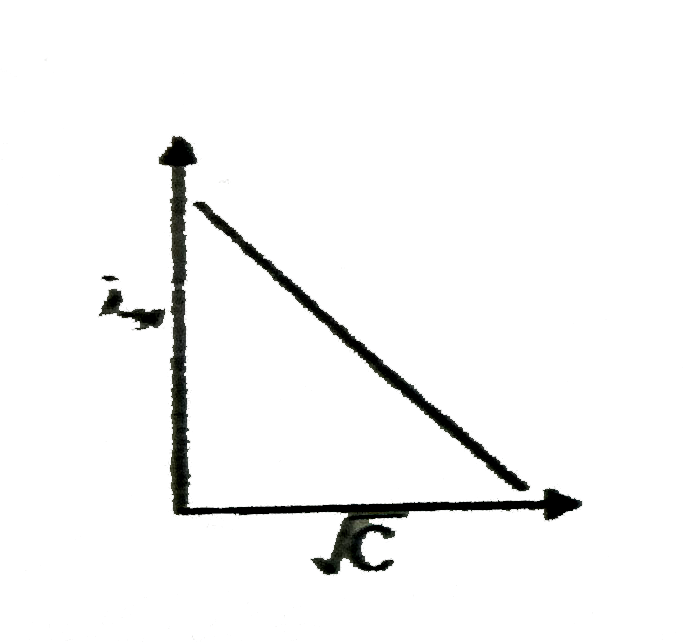
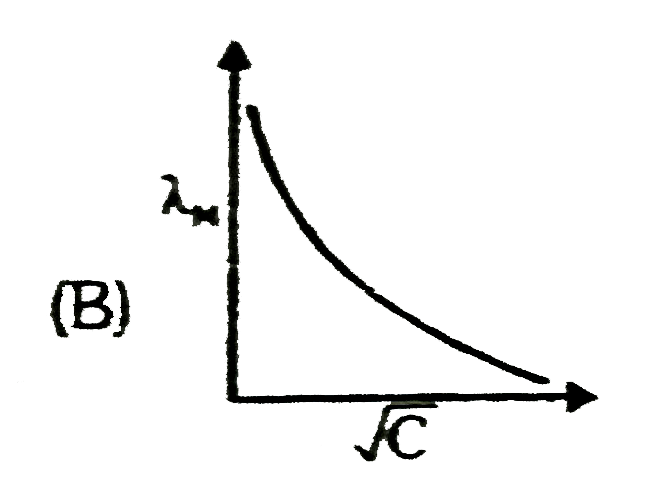
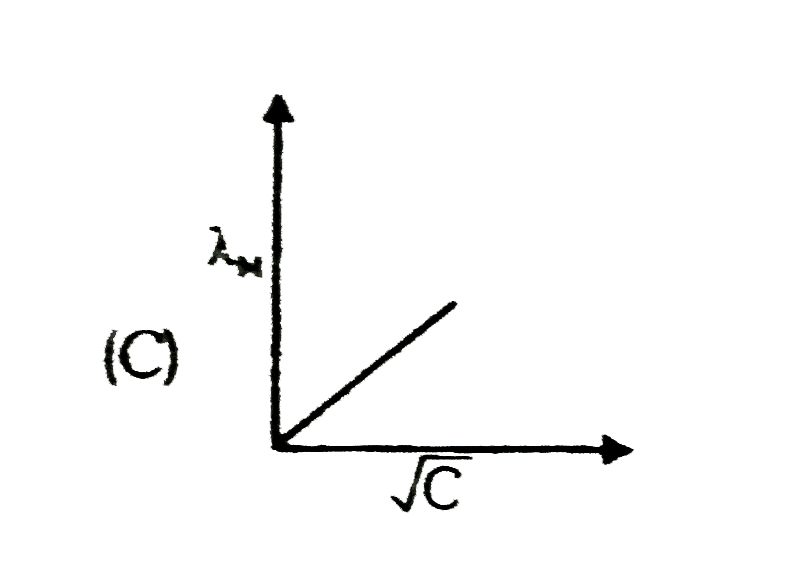
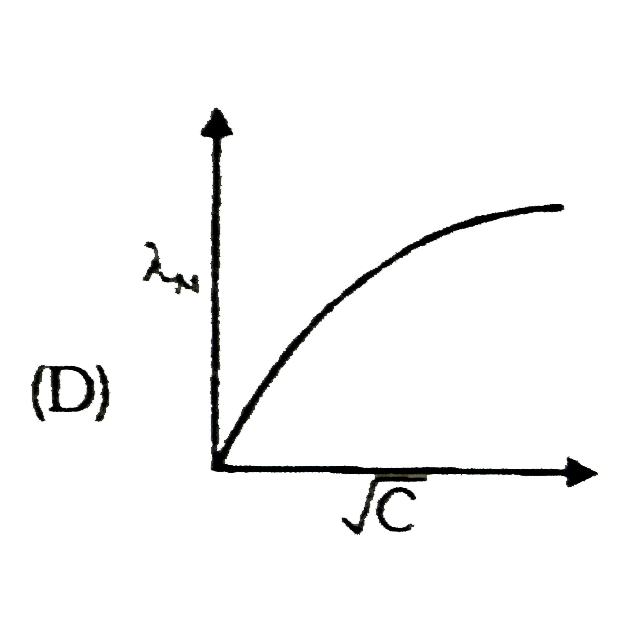
The correct Answer is:A
To solve the question regarding the variation of molar conductance (λM) with the square root of concentration (√C) for AgNO3, we can follow these steps:
1. Understand the Relationship:
The relationship between molar conductance (λM) and concentration (C) can be expressed as:
λM=λ0+k√C
where λ0 is the molar conductance at infinite dilution and k is a constant.
2. Rearranging the Equation:
We can rearrange the equation to fit the linear form y=mx+c:
λM=λ0+k√C
Here, y corresponds to λM, x corresponds to √C, m (the slope) is k, and c (the y-intercept) is λ0.
3. Graph Characteristics:
- The graph of λM versus √C will be a straight line.
- The slope k is positive, indicating that as √C increases, λM also increases.
- The y-intercept λ0 is positive, representing the molar conductance at infinite dilution.
4. Identifying the Correct Curve:
Based on the above analysis, the graph will be a straight line that starts from a positive y-intercept and has a positive slope. Therefore, the correct option that represents this relationship is Option A.
Final Answer:
The curve that represents the variation of λM with √C for AgNO3 is Option A.
The relationship between molar conductance (λM) and concentration (C) can be expressed as:
λM=λ0+k√C
where λ0 is the molar conductance at infinite dilution and k is a constant.
We can rearrange the equation to fit the linear form y=mx+c:
λM=λ0+k√C
Here, y corresponds to λM, x corresponds to √C, m (the slope) is k, and c (the y-intercept) is λ0.
- The graph of λM versus √C will be a straight line.
- The slope k is positive, indicating that as √C increases, λM also increases.
- The y-intercept λ0 is positive, representing the molar conductance at infinite dilution.
Based on the above analysis, the graph will be a straight line that starts from a positive y-intercept and has a positive slope. Therefore, the correct option that represents this relationship is Option A.
The curve that represents the variation of λM with √C for AgNO3 is Option A.
Topper's Solved these Questions
- BOOK - ALLENCHAPTER - ELECTROCHEMISTRYEXERCISE - EXERCISE-0324videos
ELECTROCHEMISTRY
- BOOK - ALLENCHAPTER - ELECTROCHEMISTRYEXERCISE - EXERCISE-04 [A]56videos
ELECTROCHEMISTRY
- BOOK - ALLENCHAPTER - ELECTROCHEMISTRYEXERCISE - Part (II) EXERCISE-0144videos
ELECTROCHEMISTRY
- BOOK - ALLENCHAPTER - CHEMISTRY AT A GLANCEEXERCISE - ORGANIC CHEMISTRY483videos
CHEMISTRY AT A GLANCE
- BOOK - ALLENCHAPTER - HYDROCARBONEXERCISE - MCQ15videos
HYDROCARBON
Similar Questions
Knowledge Check
- Question 1 - Select One
Which of the following curve represents the variation of λm with √C for AgNO3?
A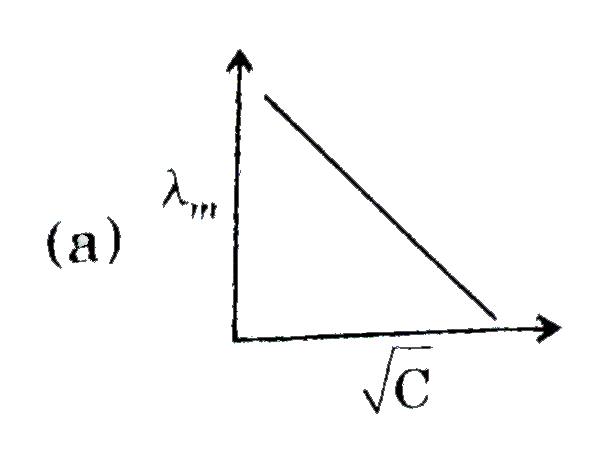 B
B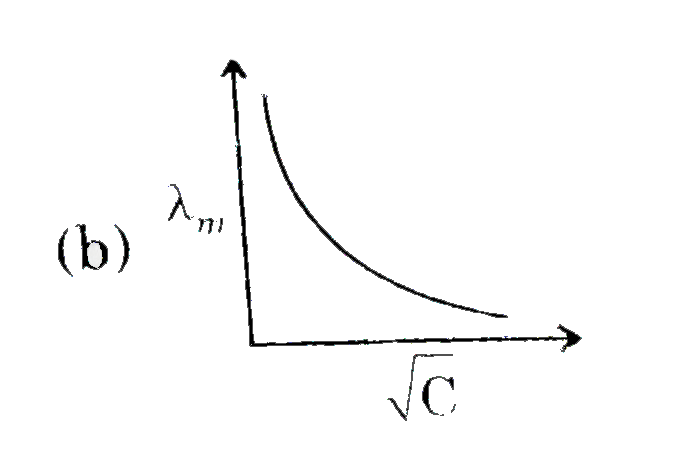 C
C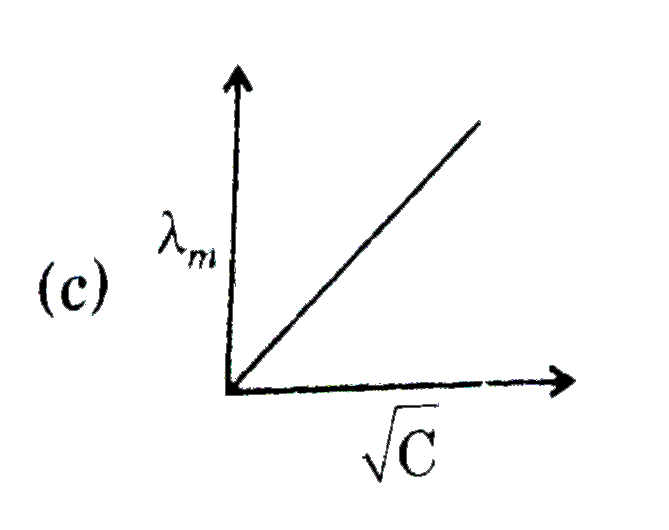 D
D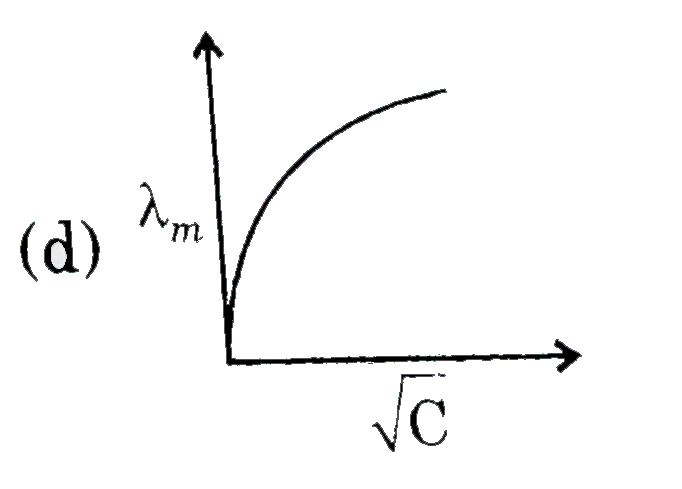
- Question 2 - Select One
Which of the following curve gives the variation of λm with √C for CH3COOH ?
A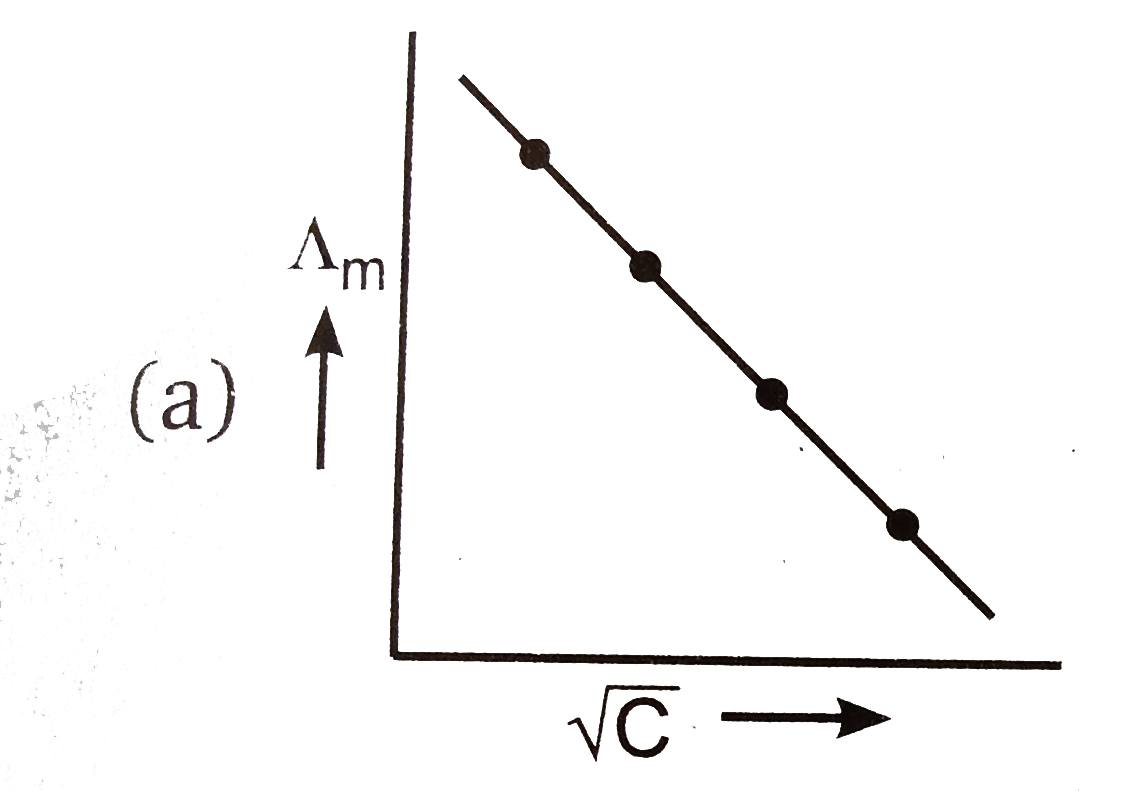 B
B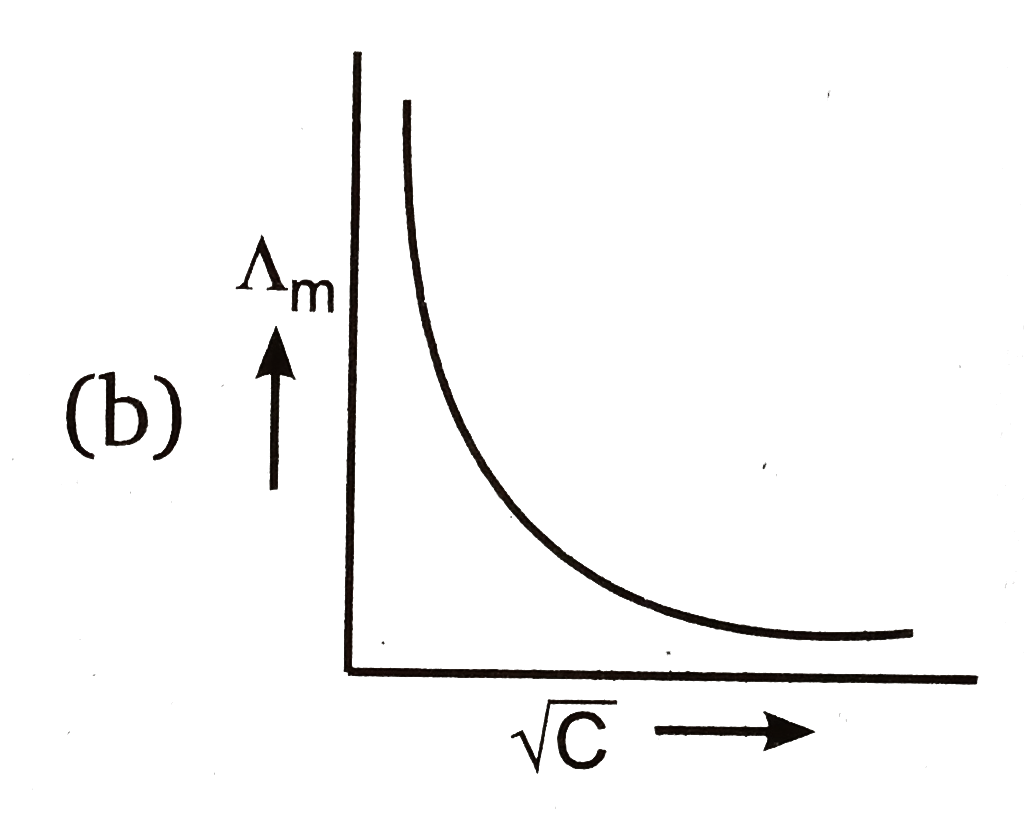 C
C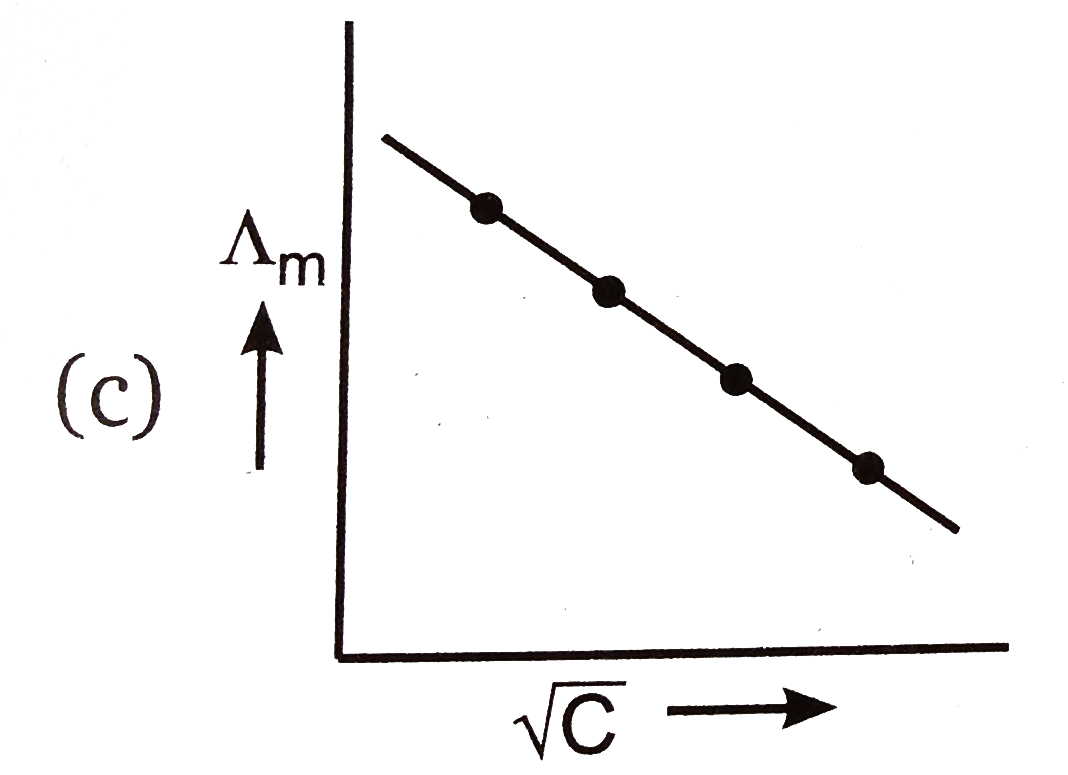 D
D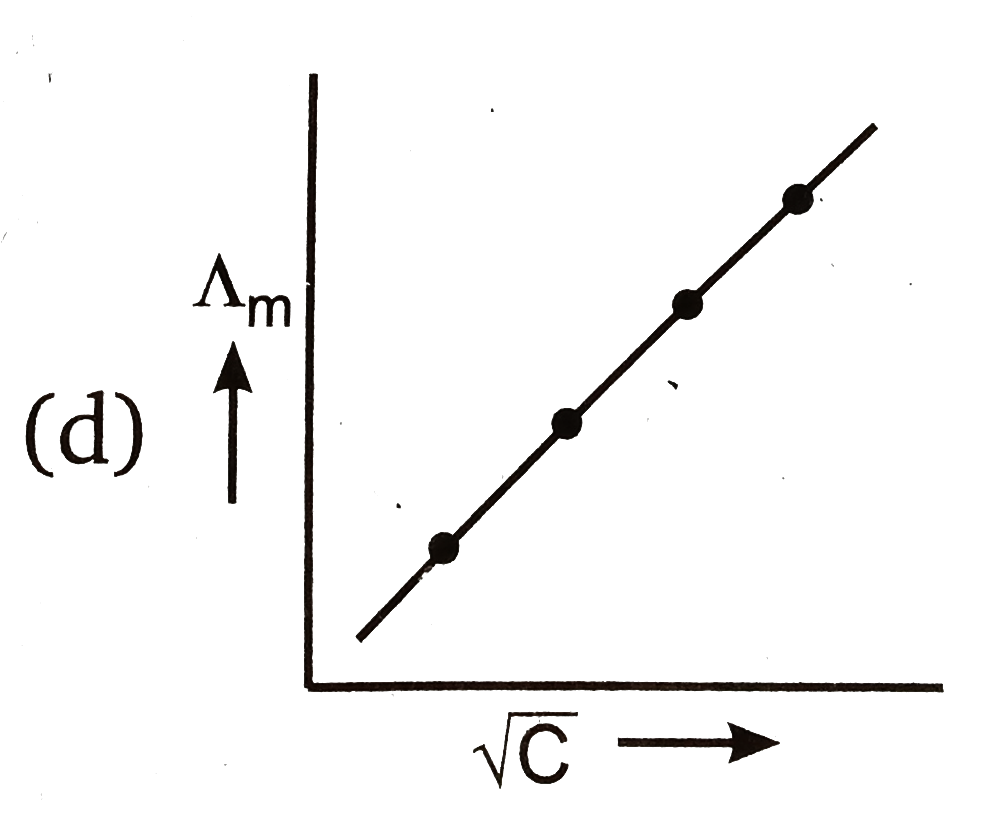
- Question 3 - Select One
Which of the following curves represent the Henry's law
A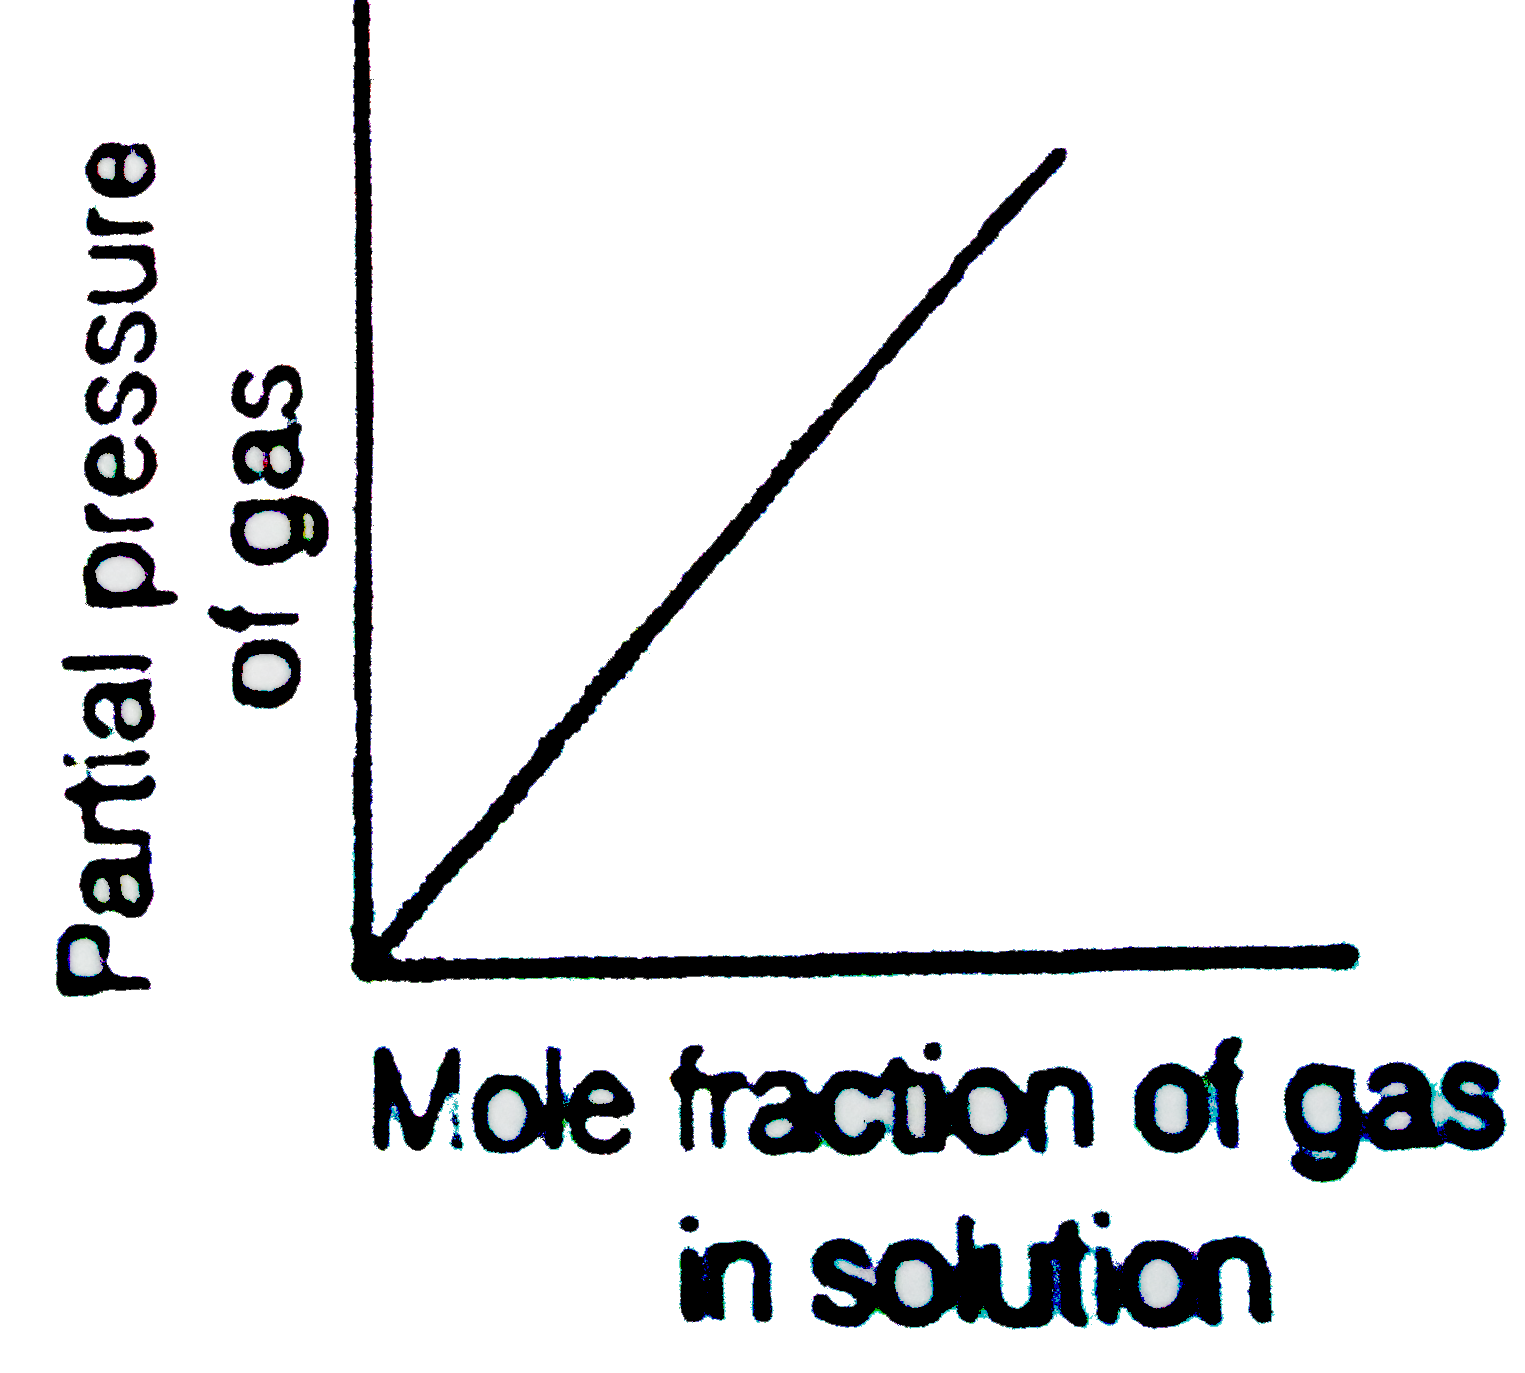 B
B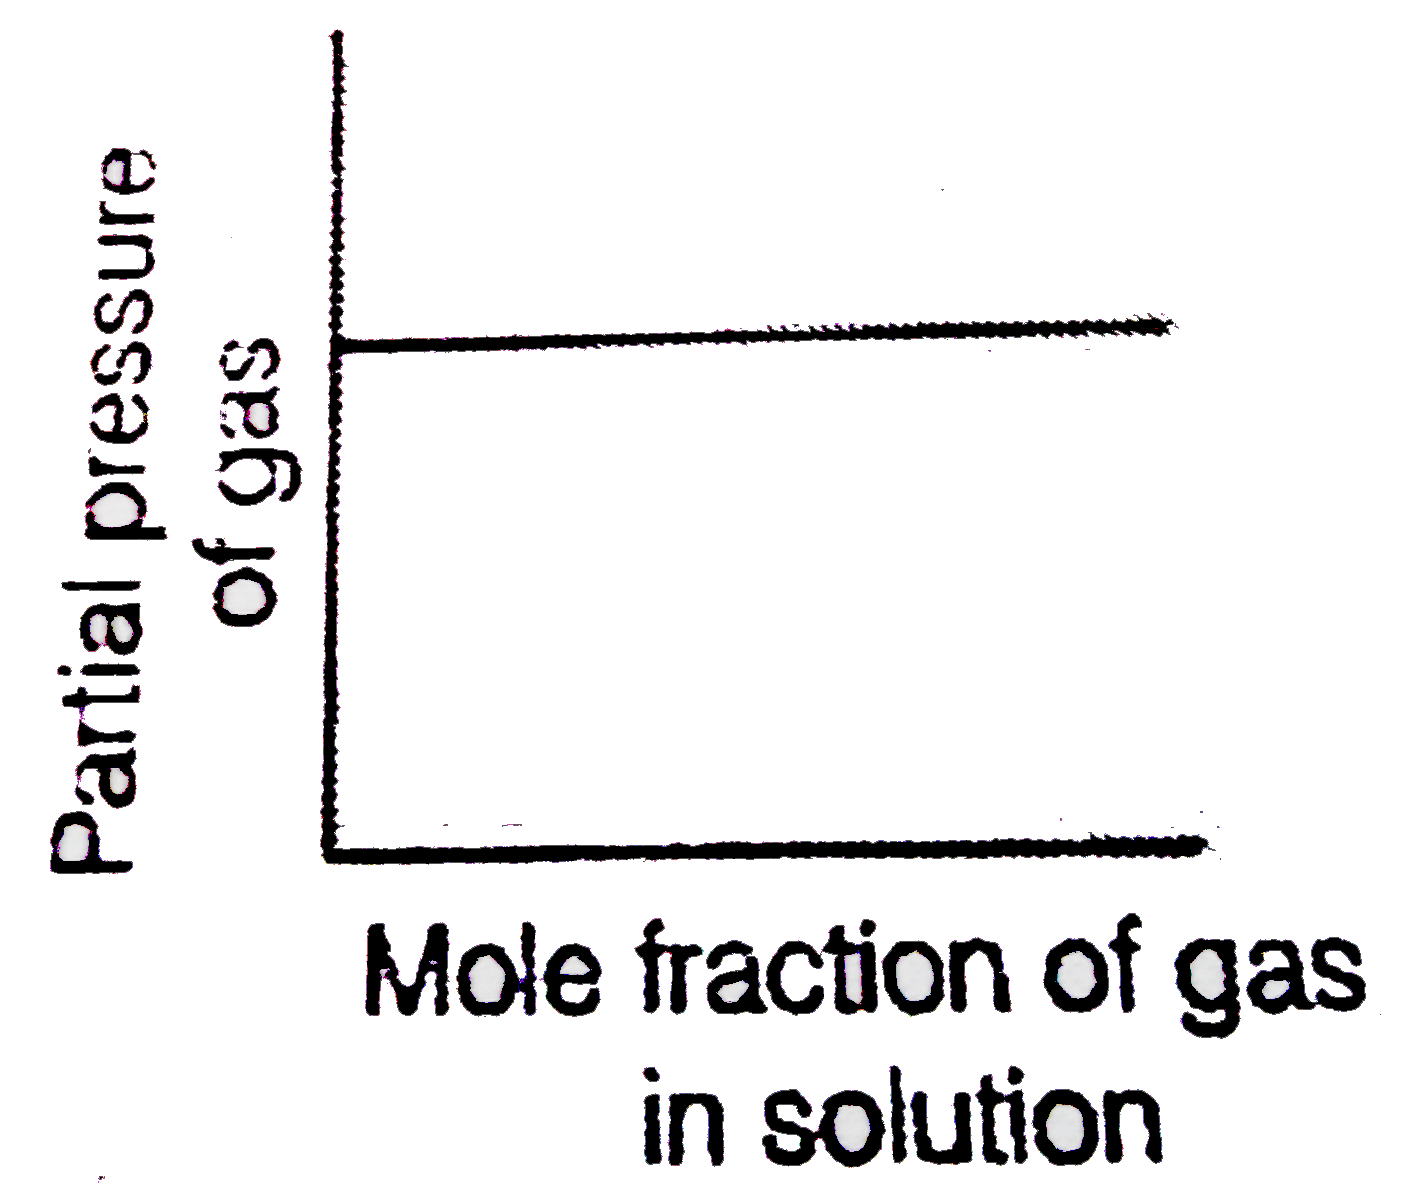 C
C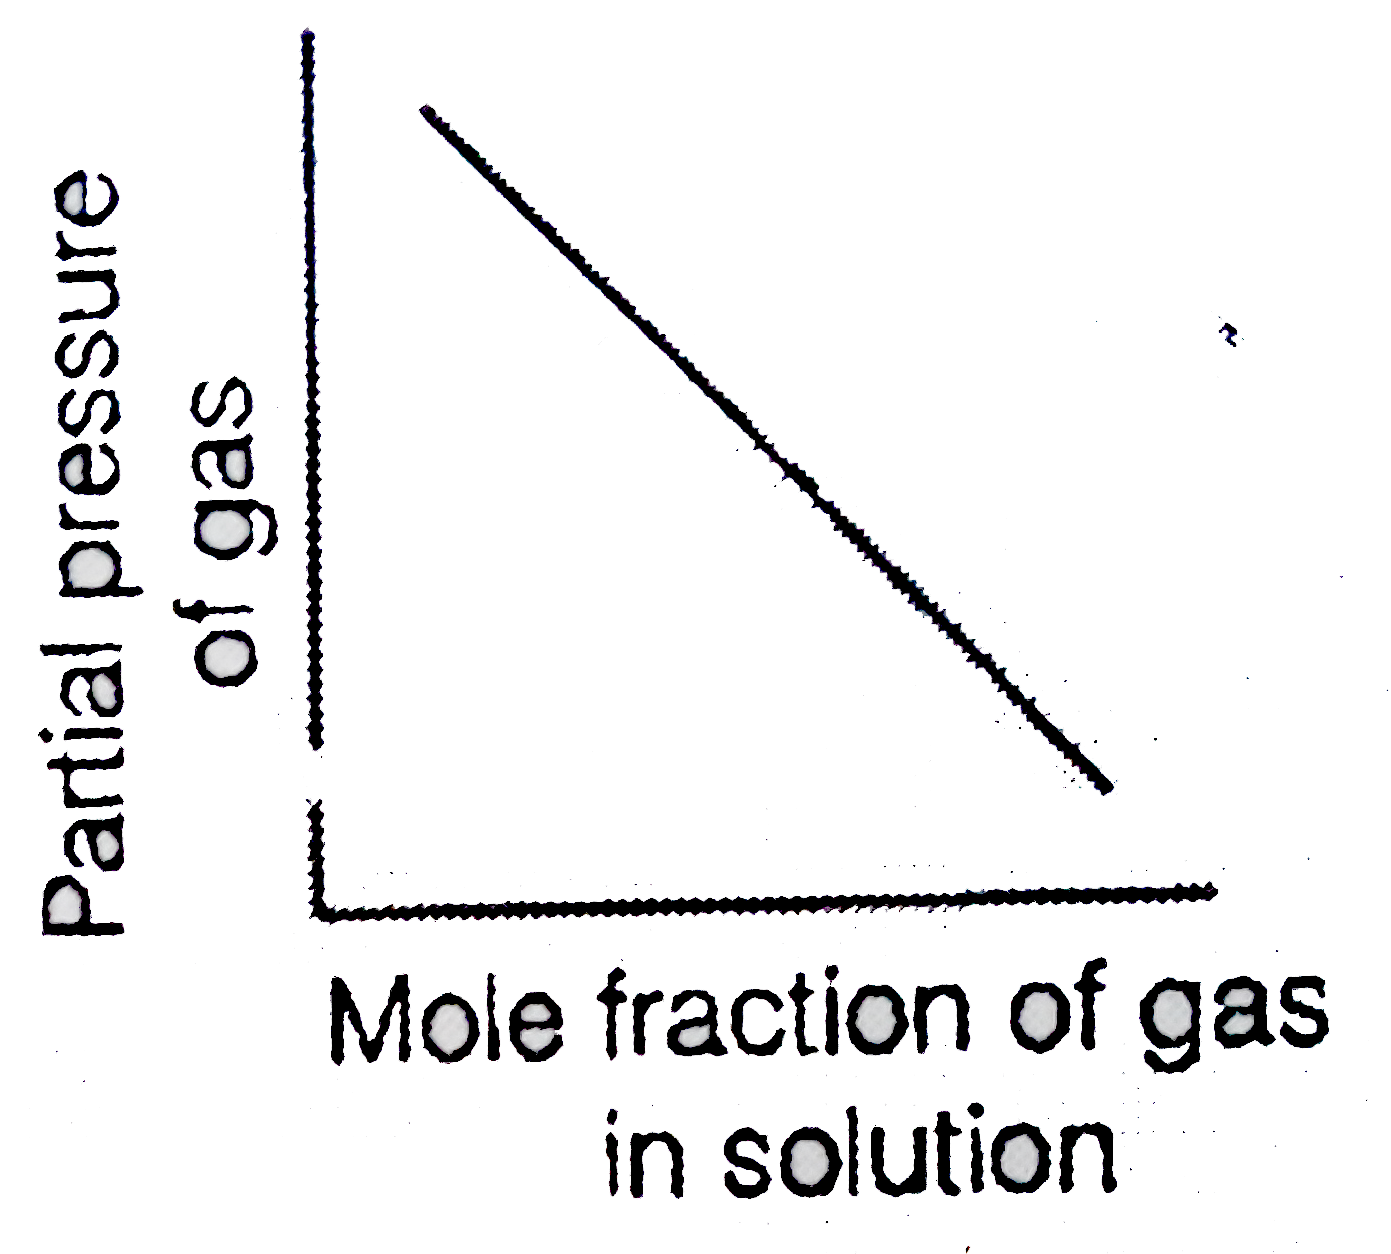 D
D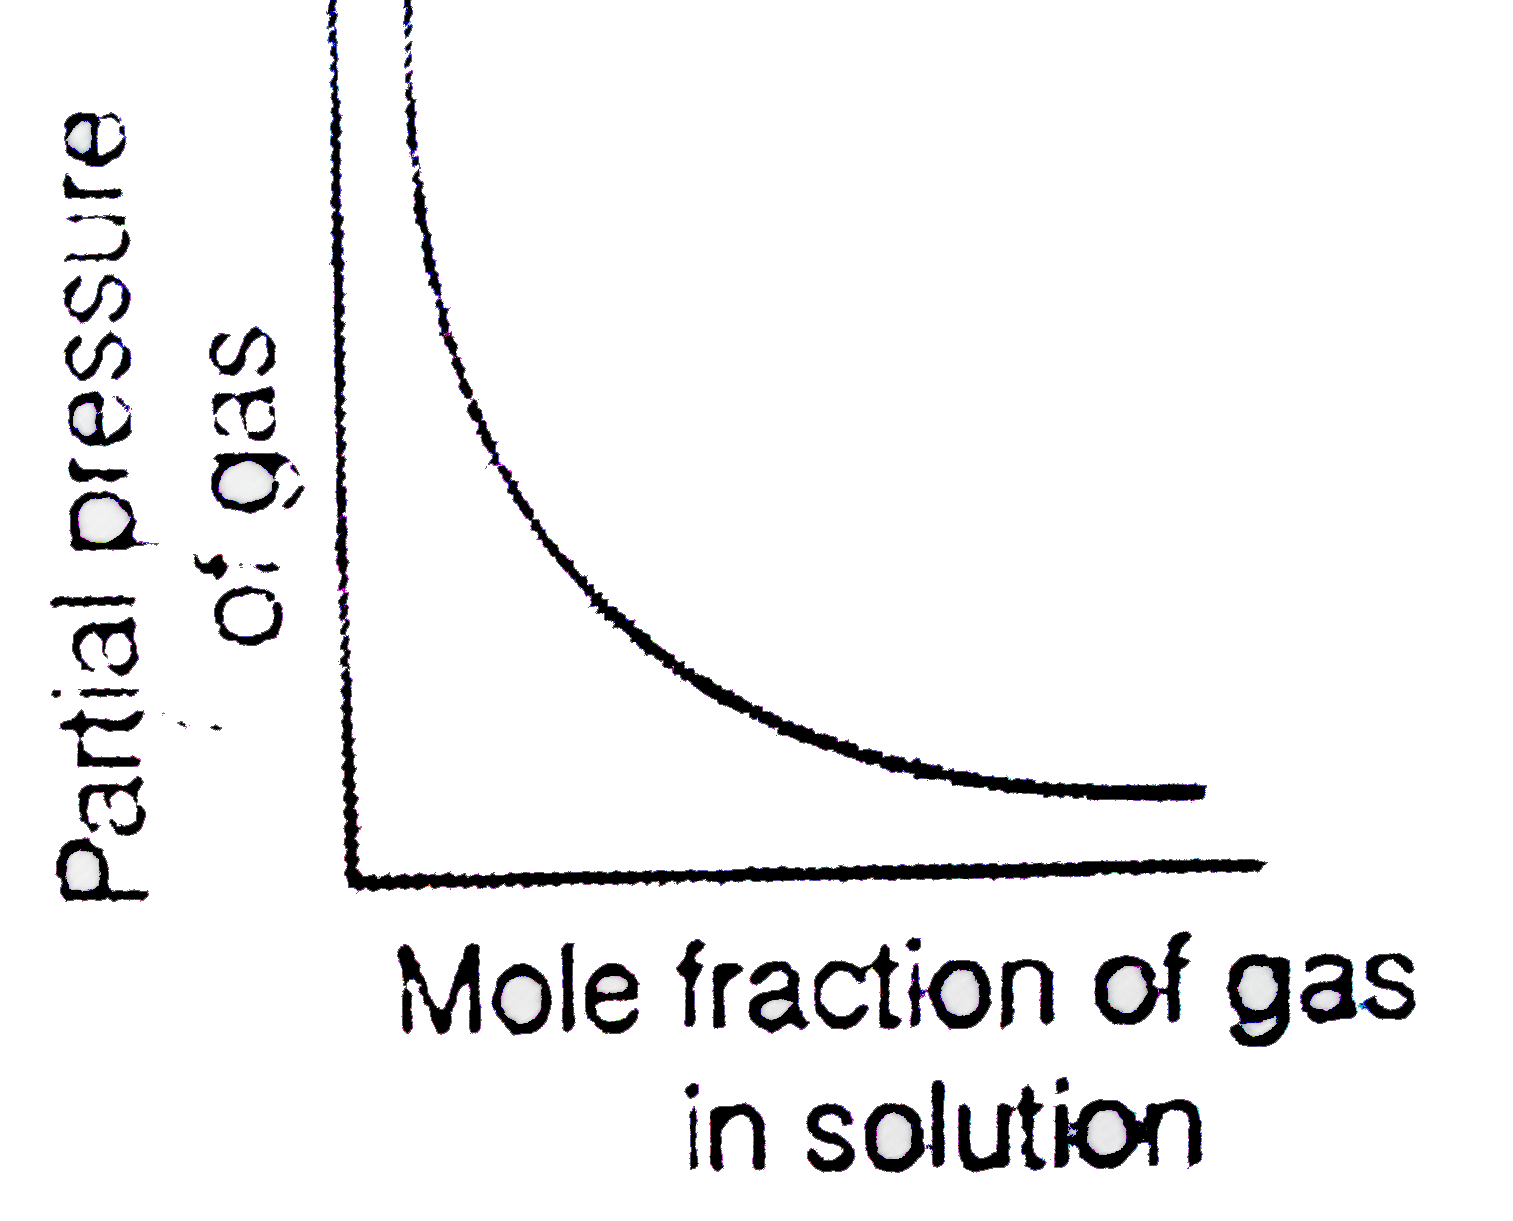
Which of the following curve gives the variation of Λm with √C for CH3COOH ?
View SolutionWhich of the following curve gives the variation of Λ∘m with √C to CH3COOH?
View SolutionWhich of the following curve gives the variation of Λmwith√C for CH3COOH ?
View SolutionWhich of the following curves represents a third order reaction ?
View SolutionWhich of the following curves represent(s) Boyle's law?
View Solution

