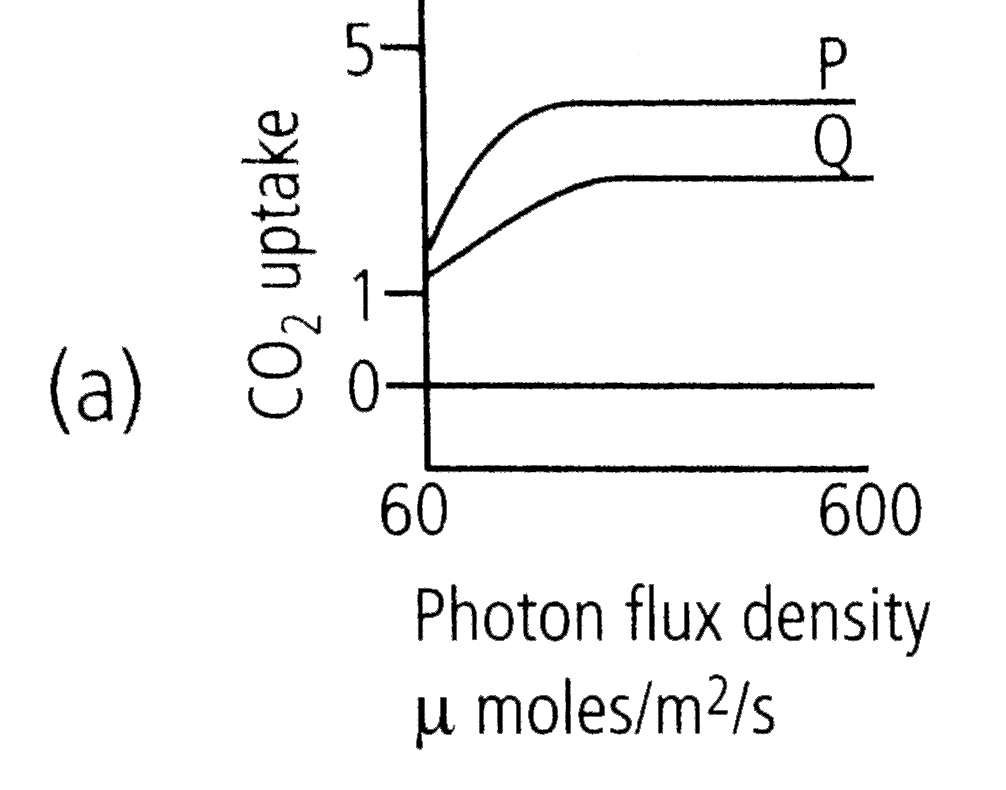
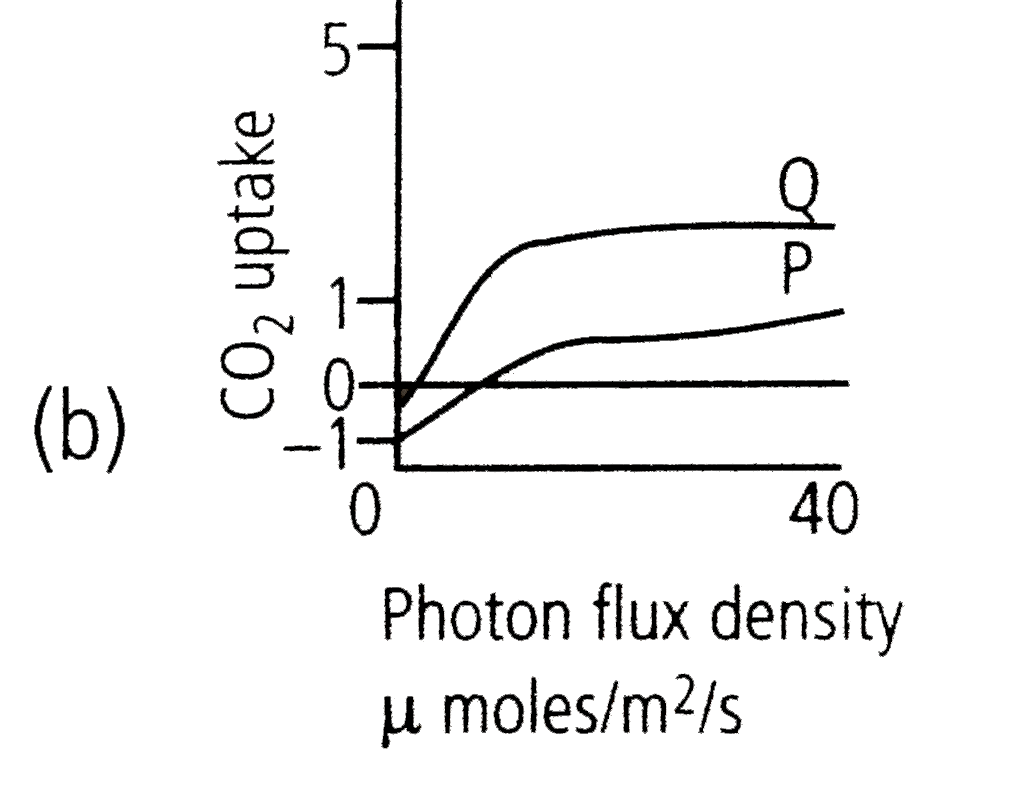
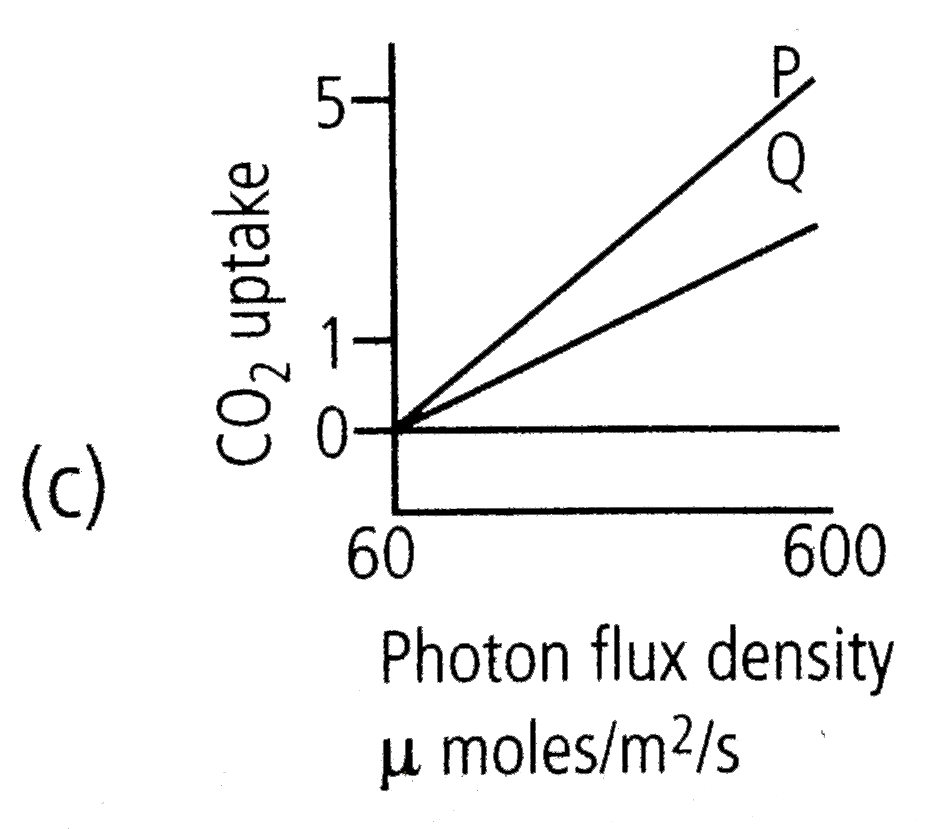
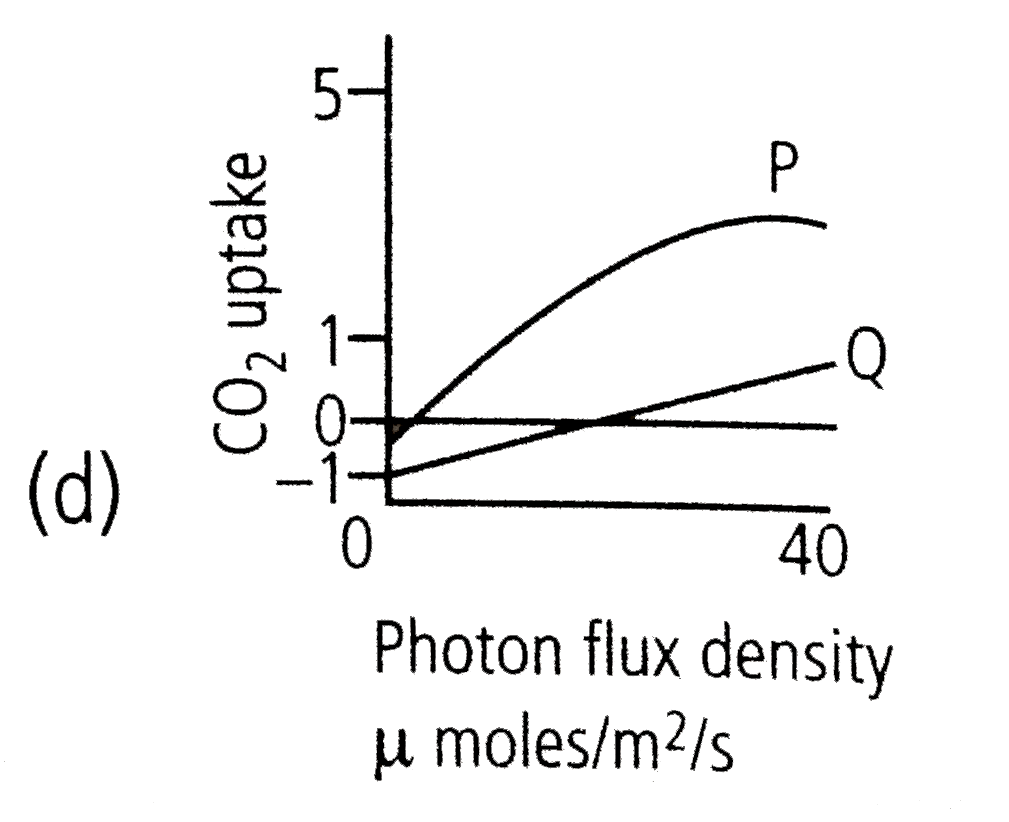
Which of the following graphs correctly depicts the rate of photosynthesis of sun plant (P) and shade plant (Q)?
A

B

C

D

Video Solution
Text Solution
The correct Answer is:D
The rate of phosynthesis is more in intense light than diffused light. The light intesntiy is more in heliophytes (sun loving plants) and less in sciophytes (shade loving plants) For a plant. Rate of photosynthesis increases with increase in light intensity except very high light intensity which causes solarisation.
|
Topper's Solved these Questions
Similar Questions
Knowledge Check
Which of the following correctly depicts the biochemical reaction for photosynthesis?
AC6H12O6+6O2Enzymes−−−−→6CO2+6H2O+energyBC6H12O6+6O2+6H2O→6CO2+12H2O+ energyC6CO2+6H2OSunlight−−−−−−→ChlorophyllC6H12O6+6O2D6CO2+12H2OSunlight−−−−−−→ChlorophyllC6H12O6+6O2+6H2OWhich of the following correctly depicts the dental formula of a child?
A21122112B21022102C21232123D21112111Which of the following correctly depicts the recongnition site for EcoRI ?
AG−A−A↓−T−T−CC−T−T−↑A−A−GBG−T−C↓−G−A−CC−A−G−↑C−T−GCG↓−T−C−G−A−CC−A−G−C−T−↑GDG↓−A−A−T−T−CC−T−T−A−A−↑G
How does water affect the rate of photosynthesis in plants?
View SolutionPhotosynthesis by green plants is a
View SolutionWhich of the following graphs correctly gives the relationship between the rate of photosynthesis and light intensity
View SolutionWhich of the following is not a plant factor regulating the photosynthesis ?
View SolutionIn photosynthesis plants .
View Solution

