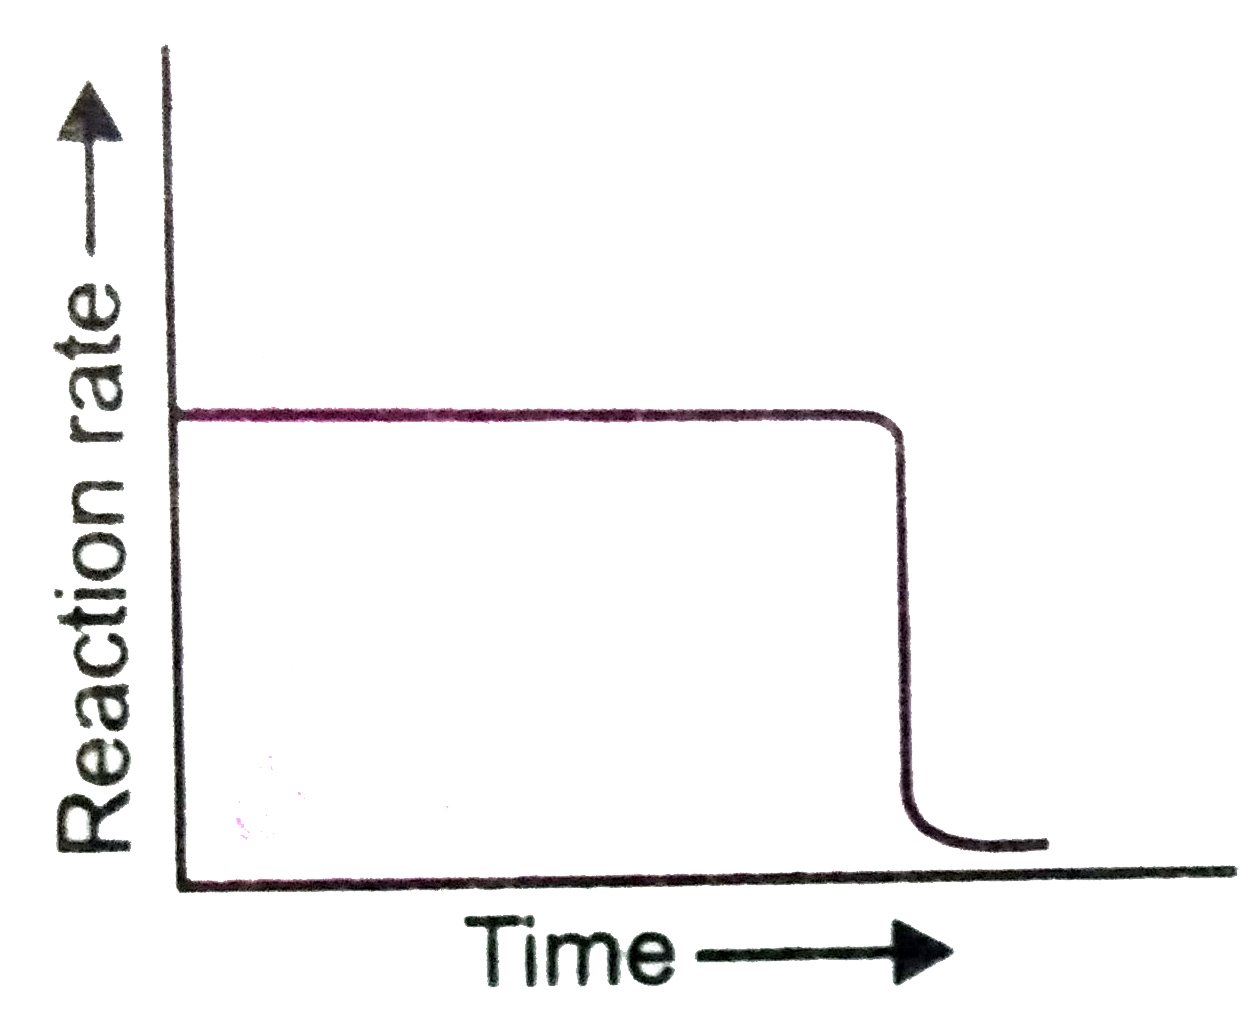
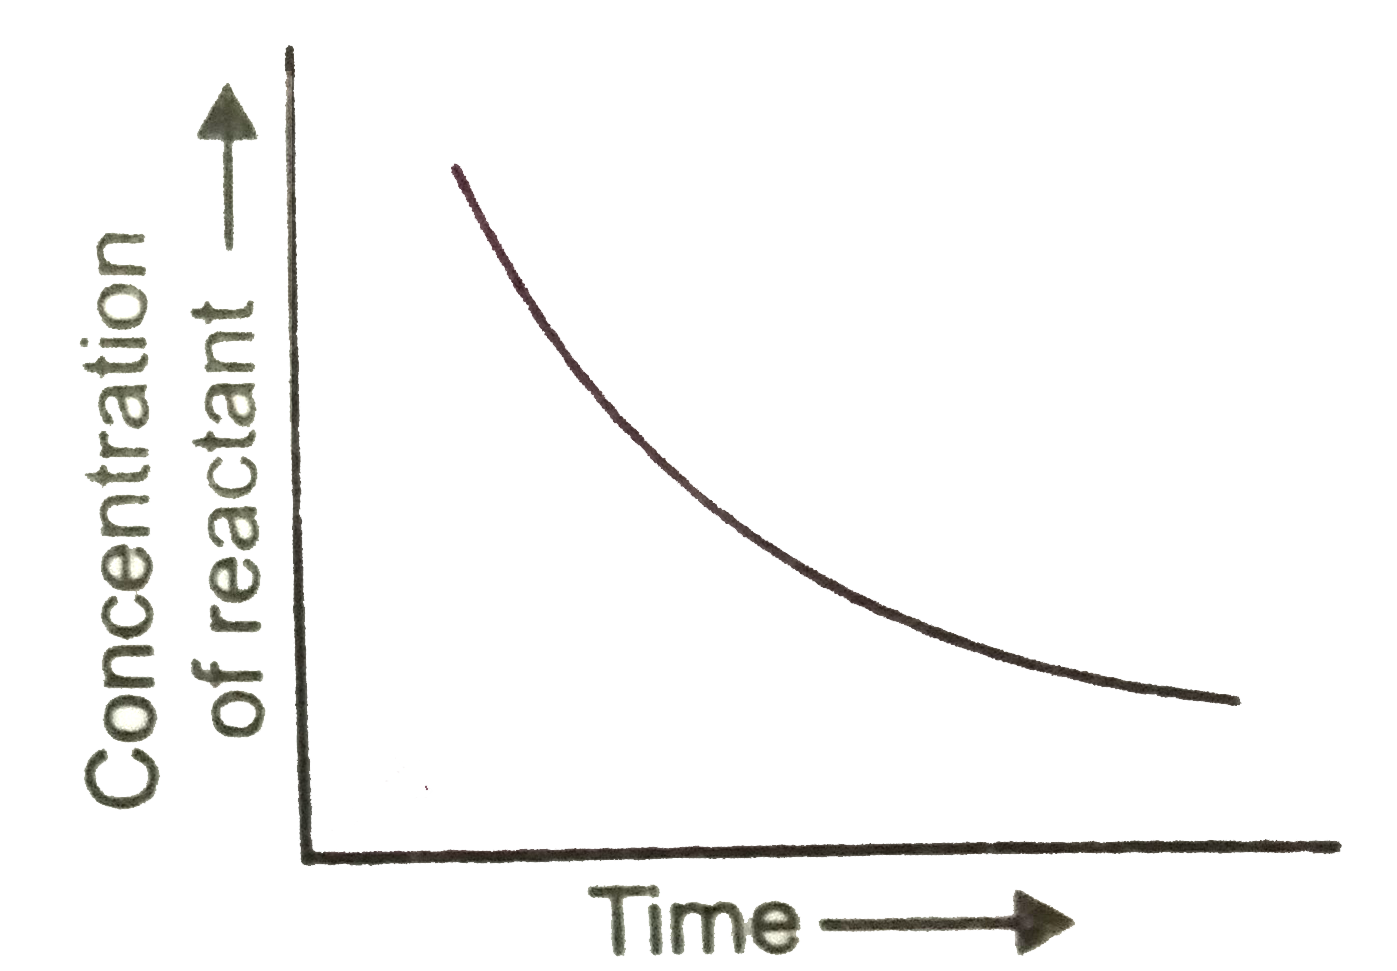
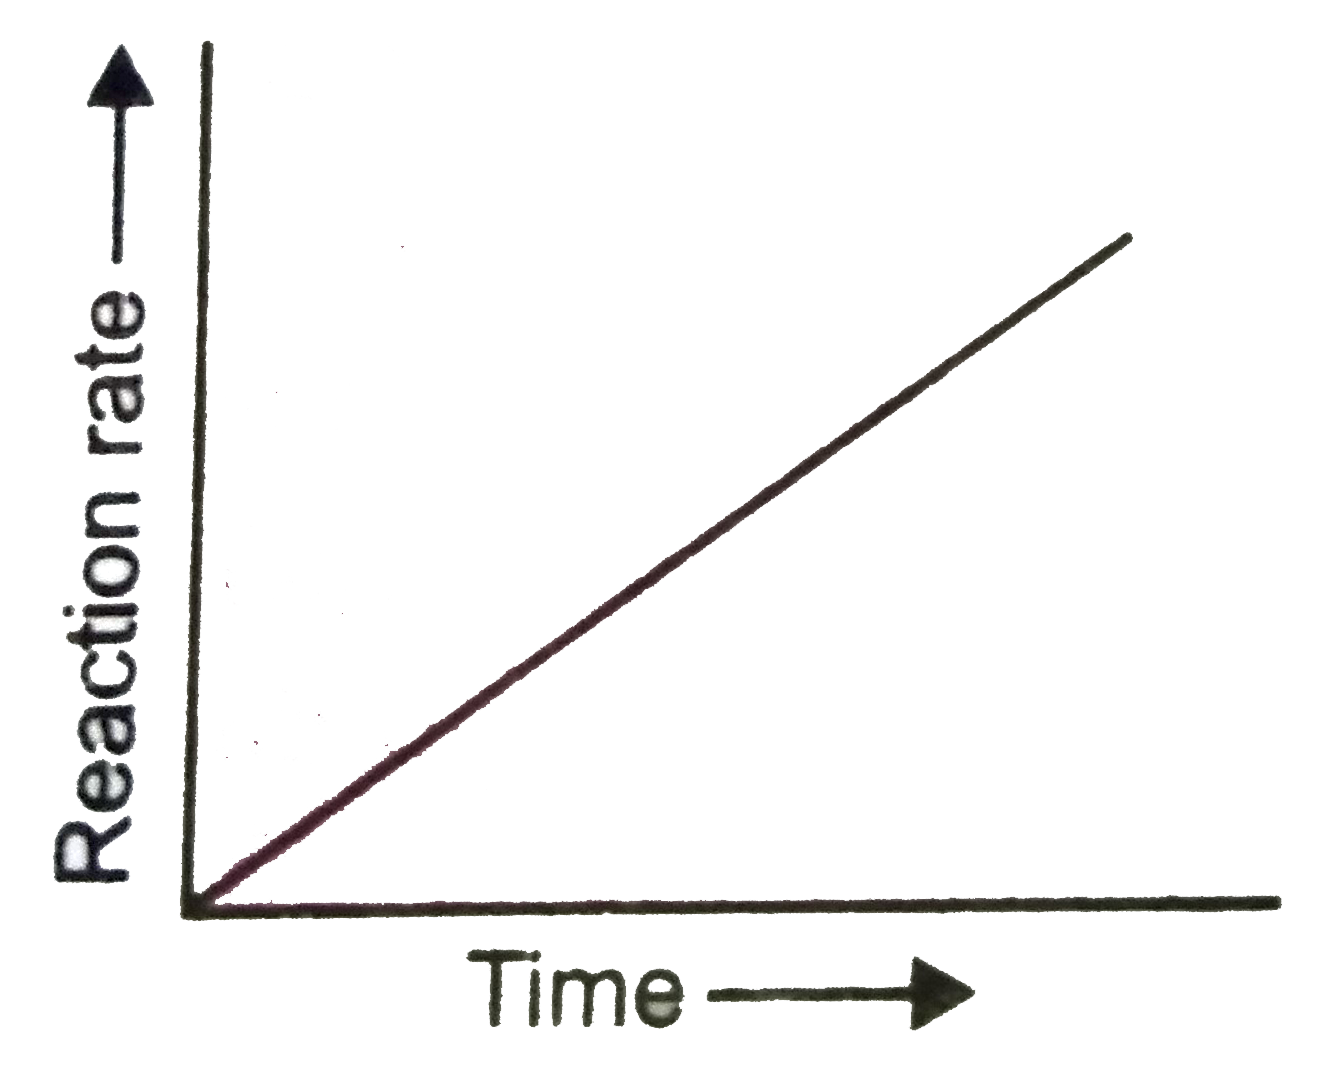
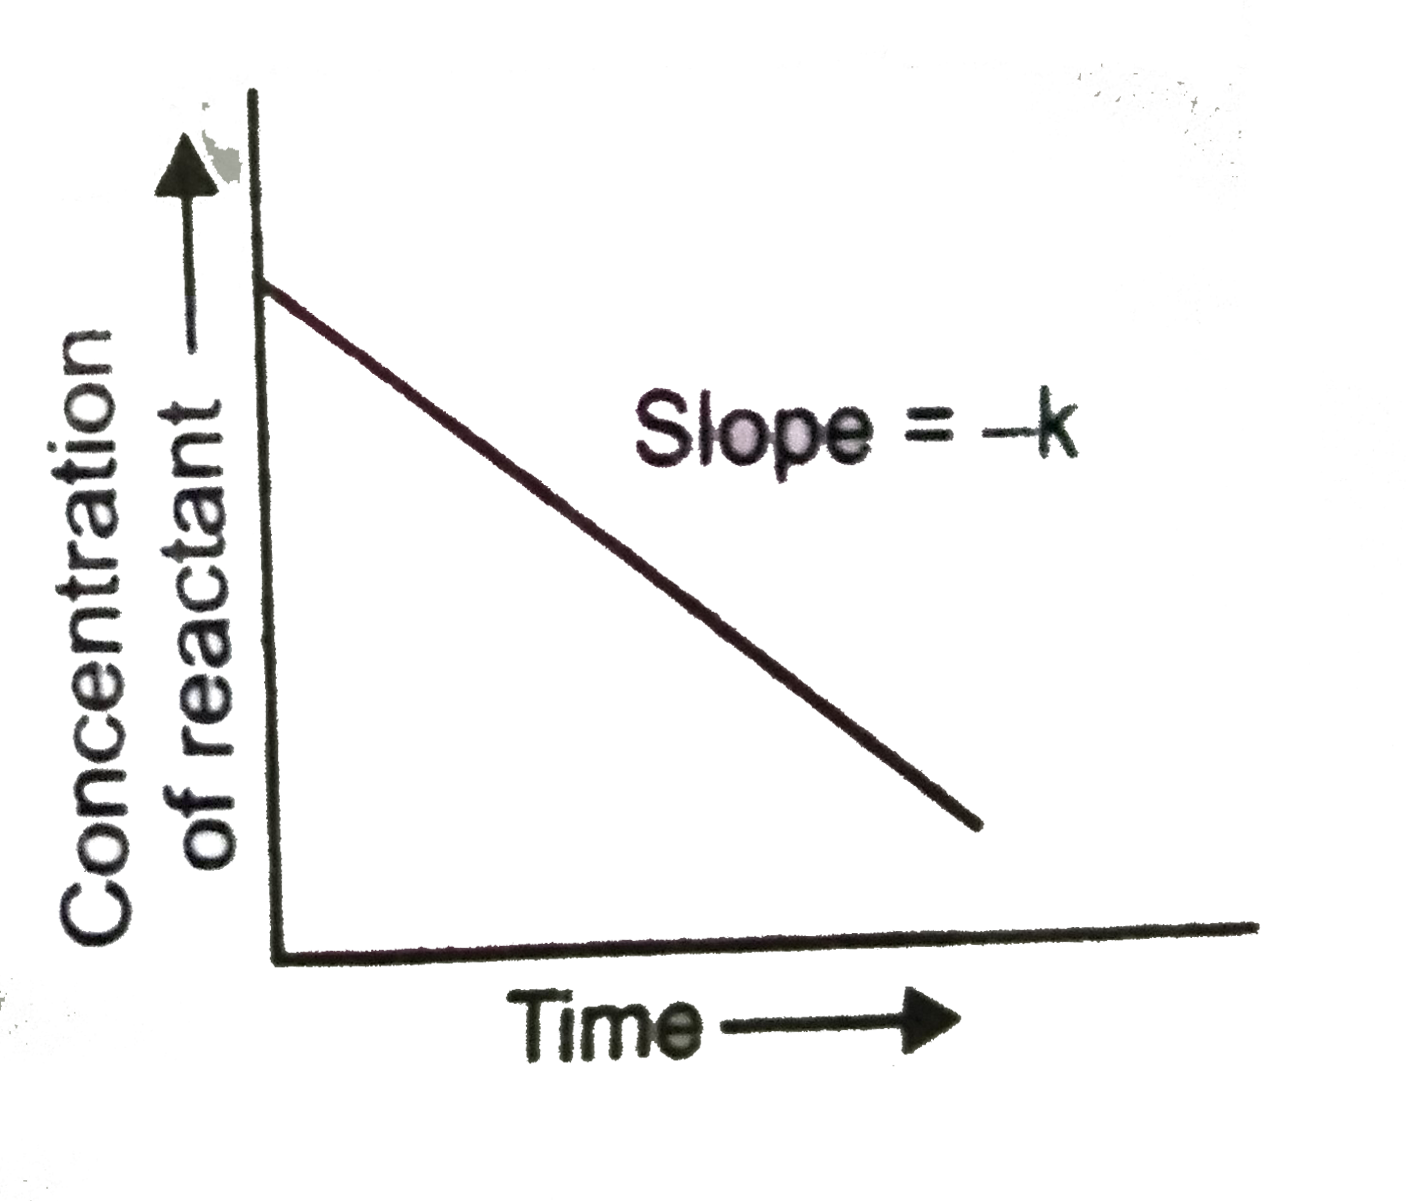
Which of the following graphs is correct for a zero order reaction ?
The correct Answer is:A, D
Step-by-Step Solution:
1. Understanding Zero Order Reactions:
- A zero-order reaction is characterized by a constant rate that does not depend on the concentration of the reactants. The rate of reaction can be expressed as:
Rate=k
- Here, k is the rate constant, and it remains constant regardless of the concentration of the reactant.
2. Rate vs. Time Graph:
- For a zero-order reaction, the rate remains constant over time until the reactant is depleted. Therefore, the graph of the rate versus time would be a horizontal line, indicating that the rate does not change as time progresses.
3. Concentration vs. Time Graph:
- The concentration of the reactant decreases linearly over time for a zero-order reaction. The relationship can be expressed as:
(A)t=(A)0−kt
- This indicates that the concentration decreases at a constant rate. The graph of concentration versus time will be a straight line with a negative slope.
4. Identifying the Correct Graph:
- Based on the characteristics of a zero-order reaction:
- The correct graph for concentration vs. time will show a straight line with a negative slope.
- The rate vs. time graph will be a horizontal line.
5. Conclusion:
- The correct graphs for a zero-order reaction are:
- A horizontal line for the rate vs. time graph.
- A straight line with a negative slope for the concentration vs. time graph.
- A zero-order reaction is characterized by a constant rate that does not depend on the concentration of the reactants. The rate of reaction can be expressed as:
Rate=k
- Here, k is the rate constant, and it remains constant regardless of the concentration of the reactant.
- For a zero-order reaction, the rate remains constant over time until the reactant is depleted. Therefore, the graph of the rate versus time would be a horizontal line, indicating that the rate does not change as time progresses.
- The concentration of the reactant decreases linearly over time for a zero-order reaction. The relationship can be expressed as:
(A)t=(A)0−kt
- This indicates that the concentration decreases at a constant rate. The graph of concentration versus time will be a straight line with a negative slope.
- Based on the characteristics of a zero-order reaction:
- The correct graph for concentration vs. time will show a straight line with a negative slope.
- The rate vs. time graph will be a horizontal line.
- The correct graphs for a zero-order reaction are:
- A horizontal line for the rate vs. time graph.
- A straight line with a negative slope for the concentration vs. time graph.
Topper's Solved these Questions
- BOOK - PRADEEPCHAPTER - CHEMICAL KINETICSEXERCISE - NCERT EXEMPLAR PROBLEMS WITH ANSWERS, HINTS AND SOLUTTIONS (SHORT ANSWER QUESTIONS)20videos
CHEMICAL KINETICS
- BOOK - PRADEEPCHAPTER - CHEMICAL KINETICSEXERCISE - NCERT EXEMPLAR PROBLEMS WITH ANSWERS, HINTS AND SOLUTTIONS (MATCHING TYPE QUESTIONS)3videos
CHEMICAL KINETICS
- BOOK - PRADEEPCHAPTER - CHEMICAL KINETICSEXERCISE - NCERT EXEMPLAR PROBLEMS WITH ANSWERS, HINTS AND SOLUTTIONS (MULTIPLE CHOICE QUESTIONS-1)20videos
CHEMICAL KINETICS
- BOOK - PRADEEPCHAPTER - BIOMOLECULES EXERCISE - IMPORTANT QUESTIONS (FOR BOARD EXAMINATION)25videos
BIOMOLECULES
- BOOK - PRADEEPCHAPTER - CHEMISTRY IN EVERYDAY LIFE EXERCISE - IMPORTANT QUESTION FOR BOARD EXAMINATION30videos
CHEMISTRY IN EVERYDAY LIFE
Similar Questions
Knowledge Check
- Question 1 - Select One or More
Which of the following graphs is correct for a zero order of reaction?
A B
B C
C D
D
- Question 2 - Select One
Which of the following graph is correct for zero order reaction?
A B
B C
C D
D
- Question 3 - Select One or More
Which of the following graph is correct for a first order reaction ?
A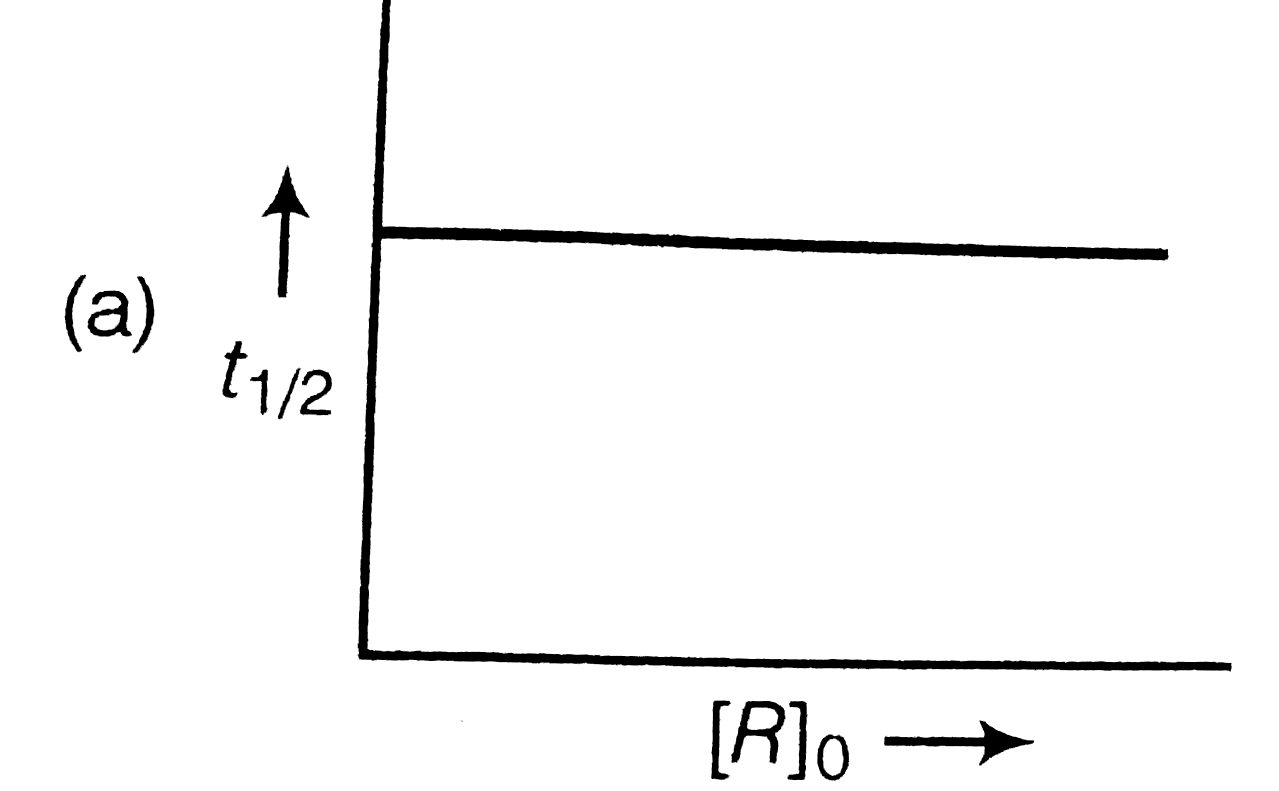 B
B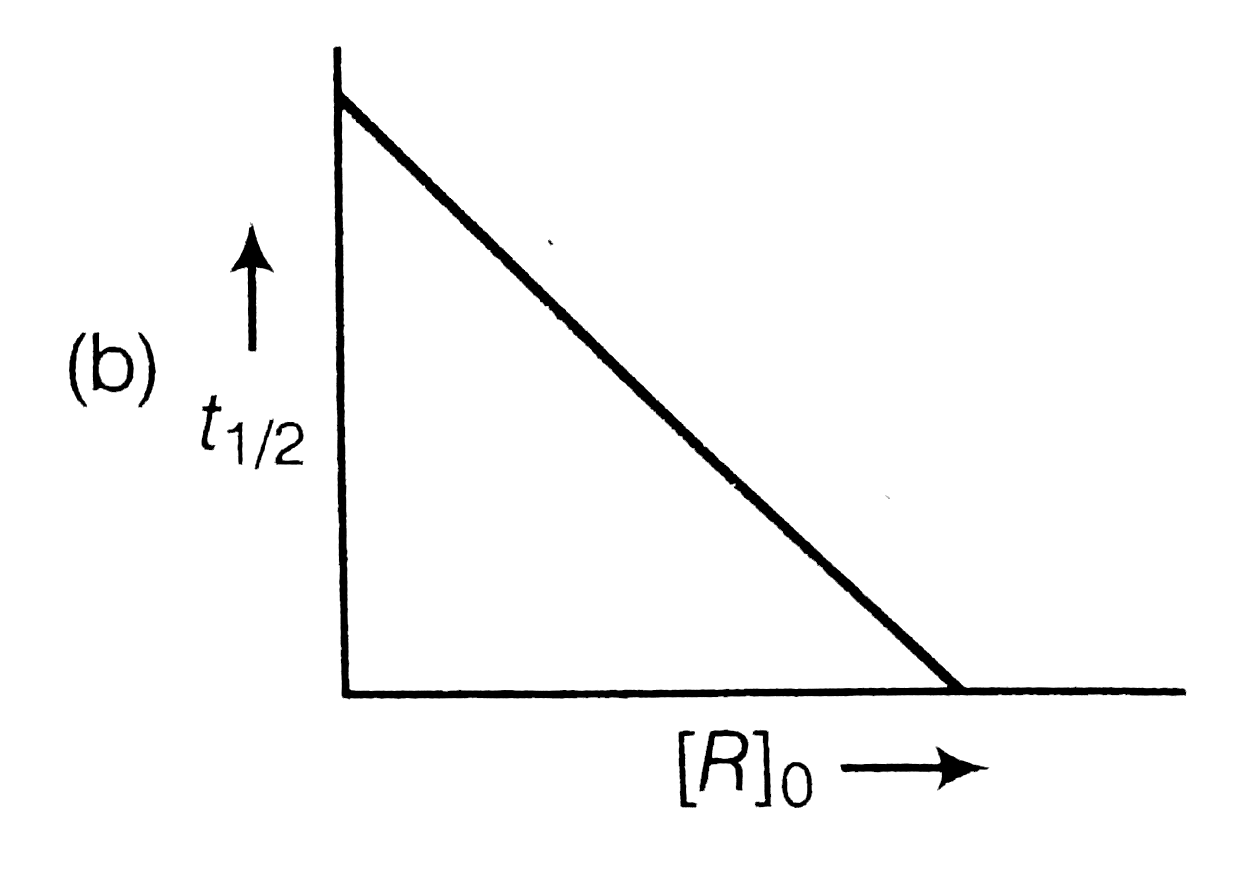 C
C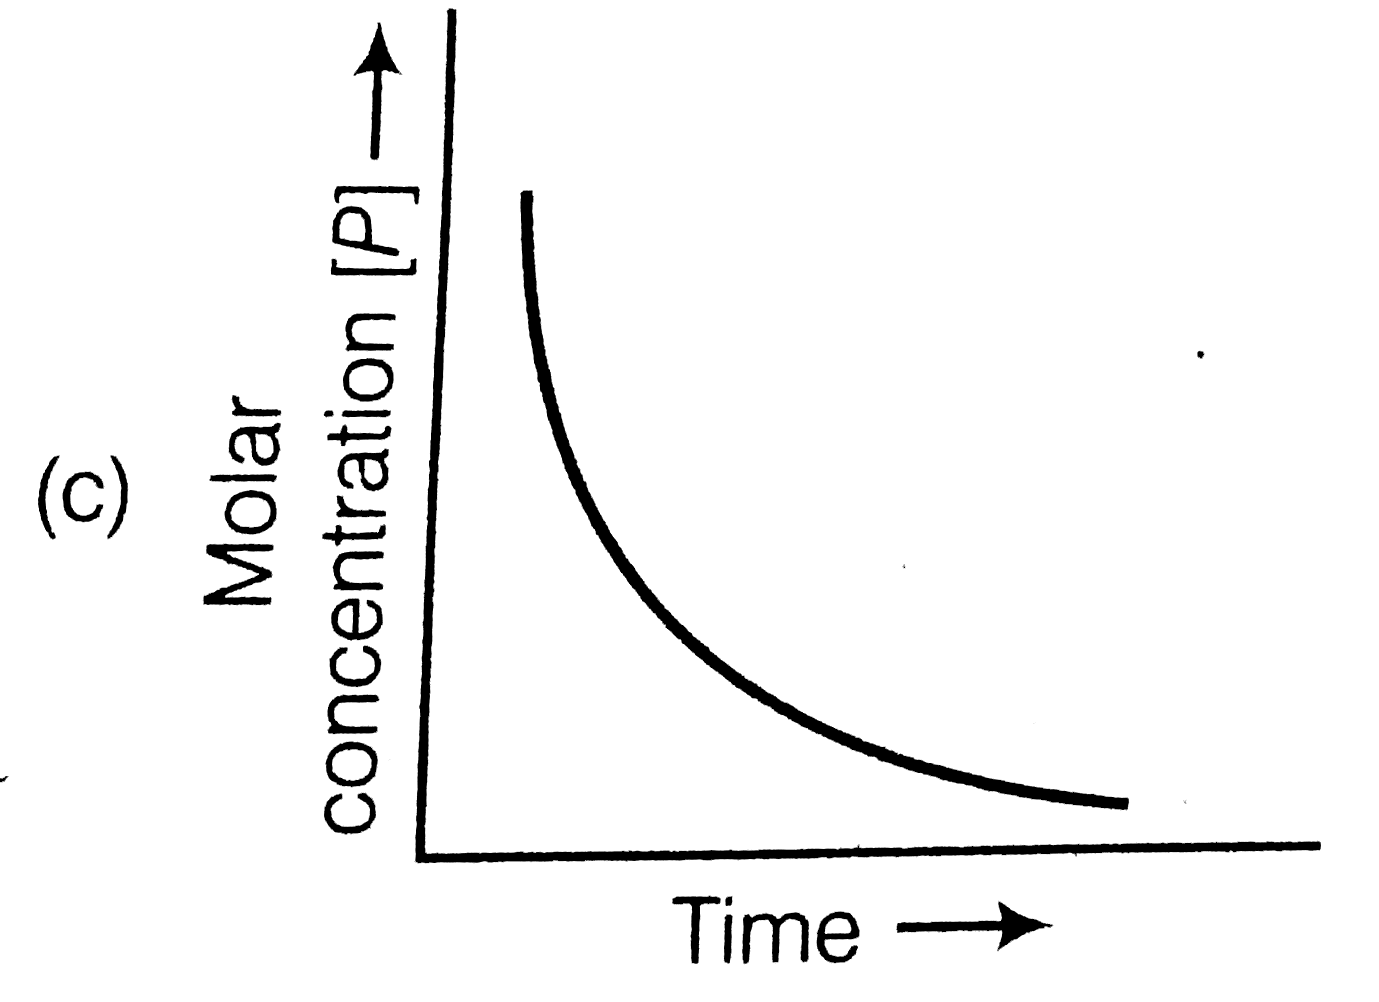 D
D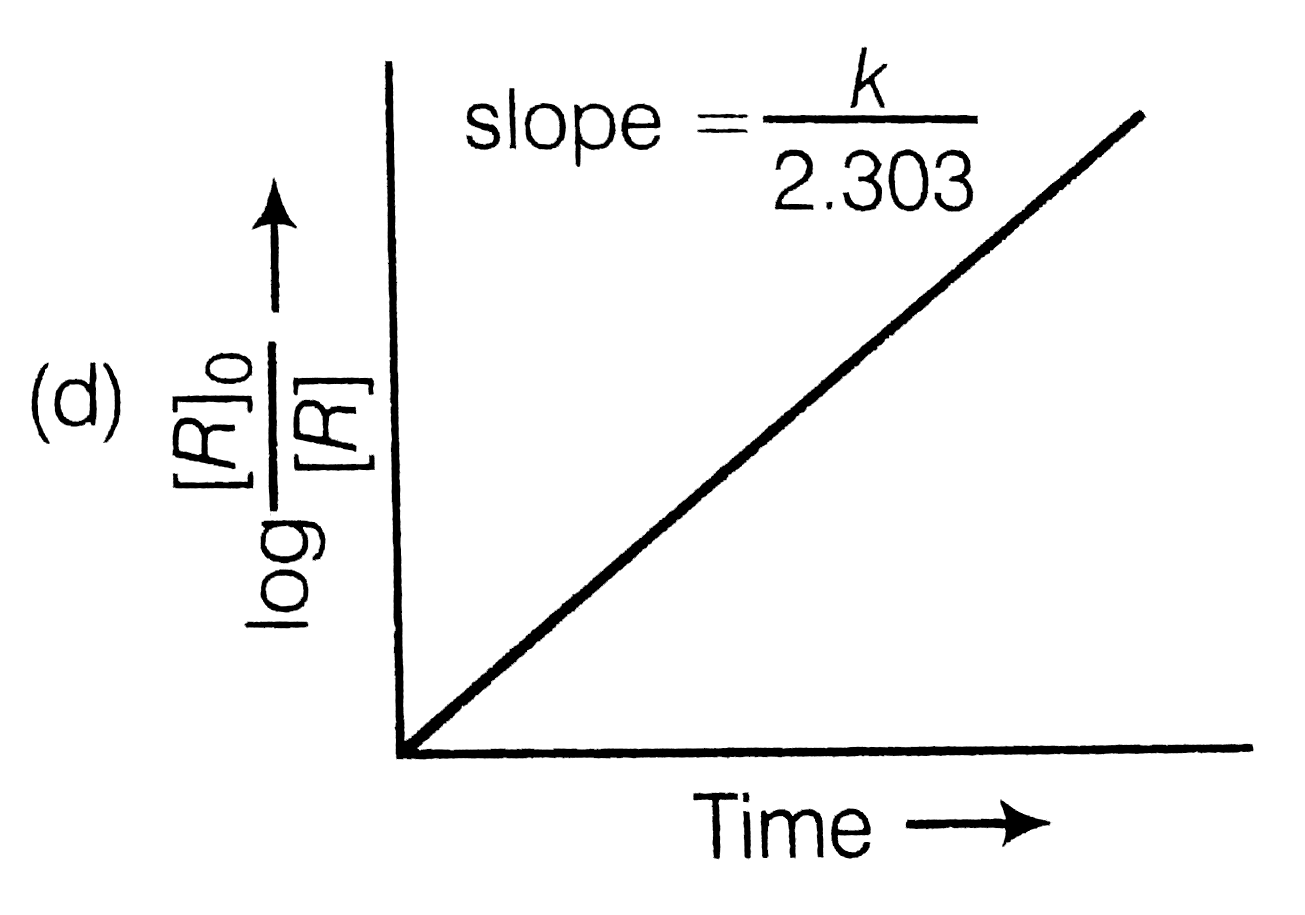
Which of the following graphs is correct for second order reaction ?
View SolutionWhich of the following graphs is correct for a first order reaction ? (R→P)
View SolutionWhich of the following graph is correct for a first order reaction of the type R→P?
Where [] represents concentration.View SolutionWhich of the following relation is correct for zero order reaction?
View Solution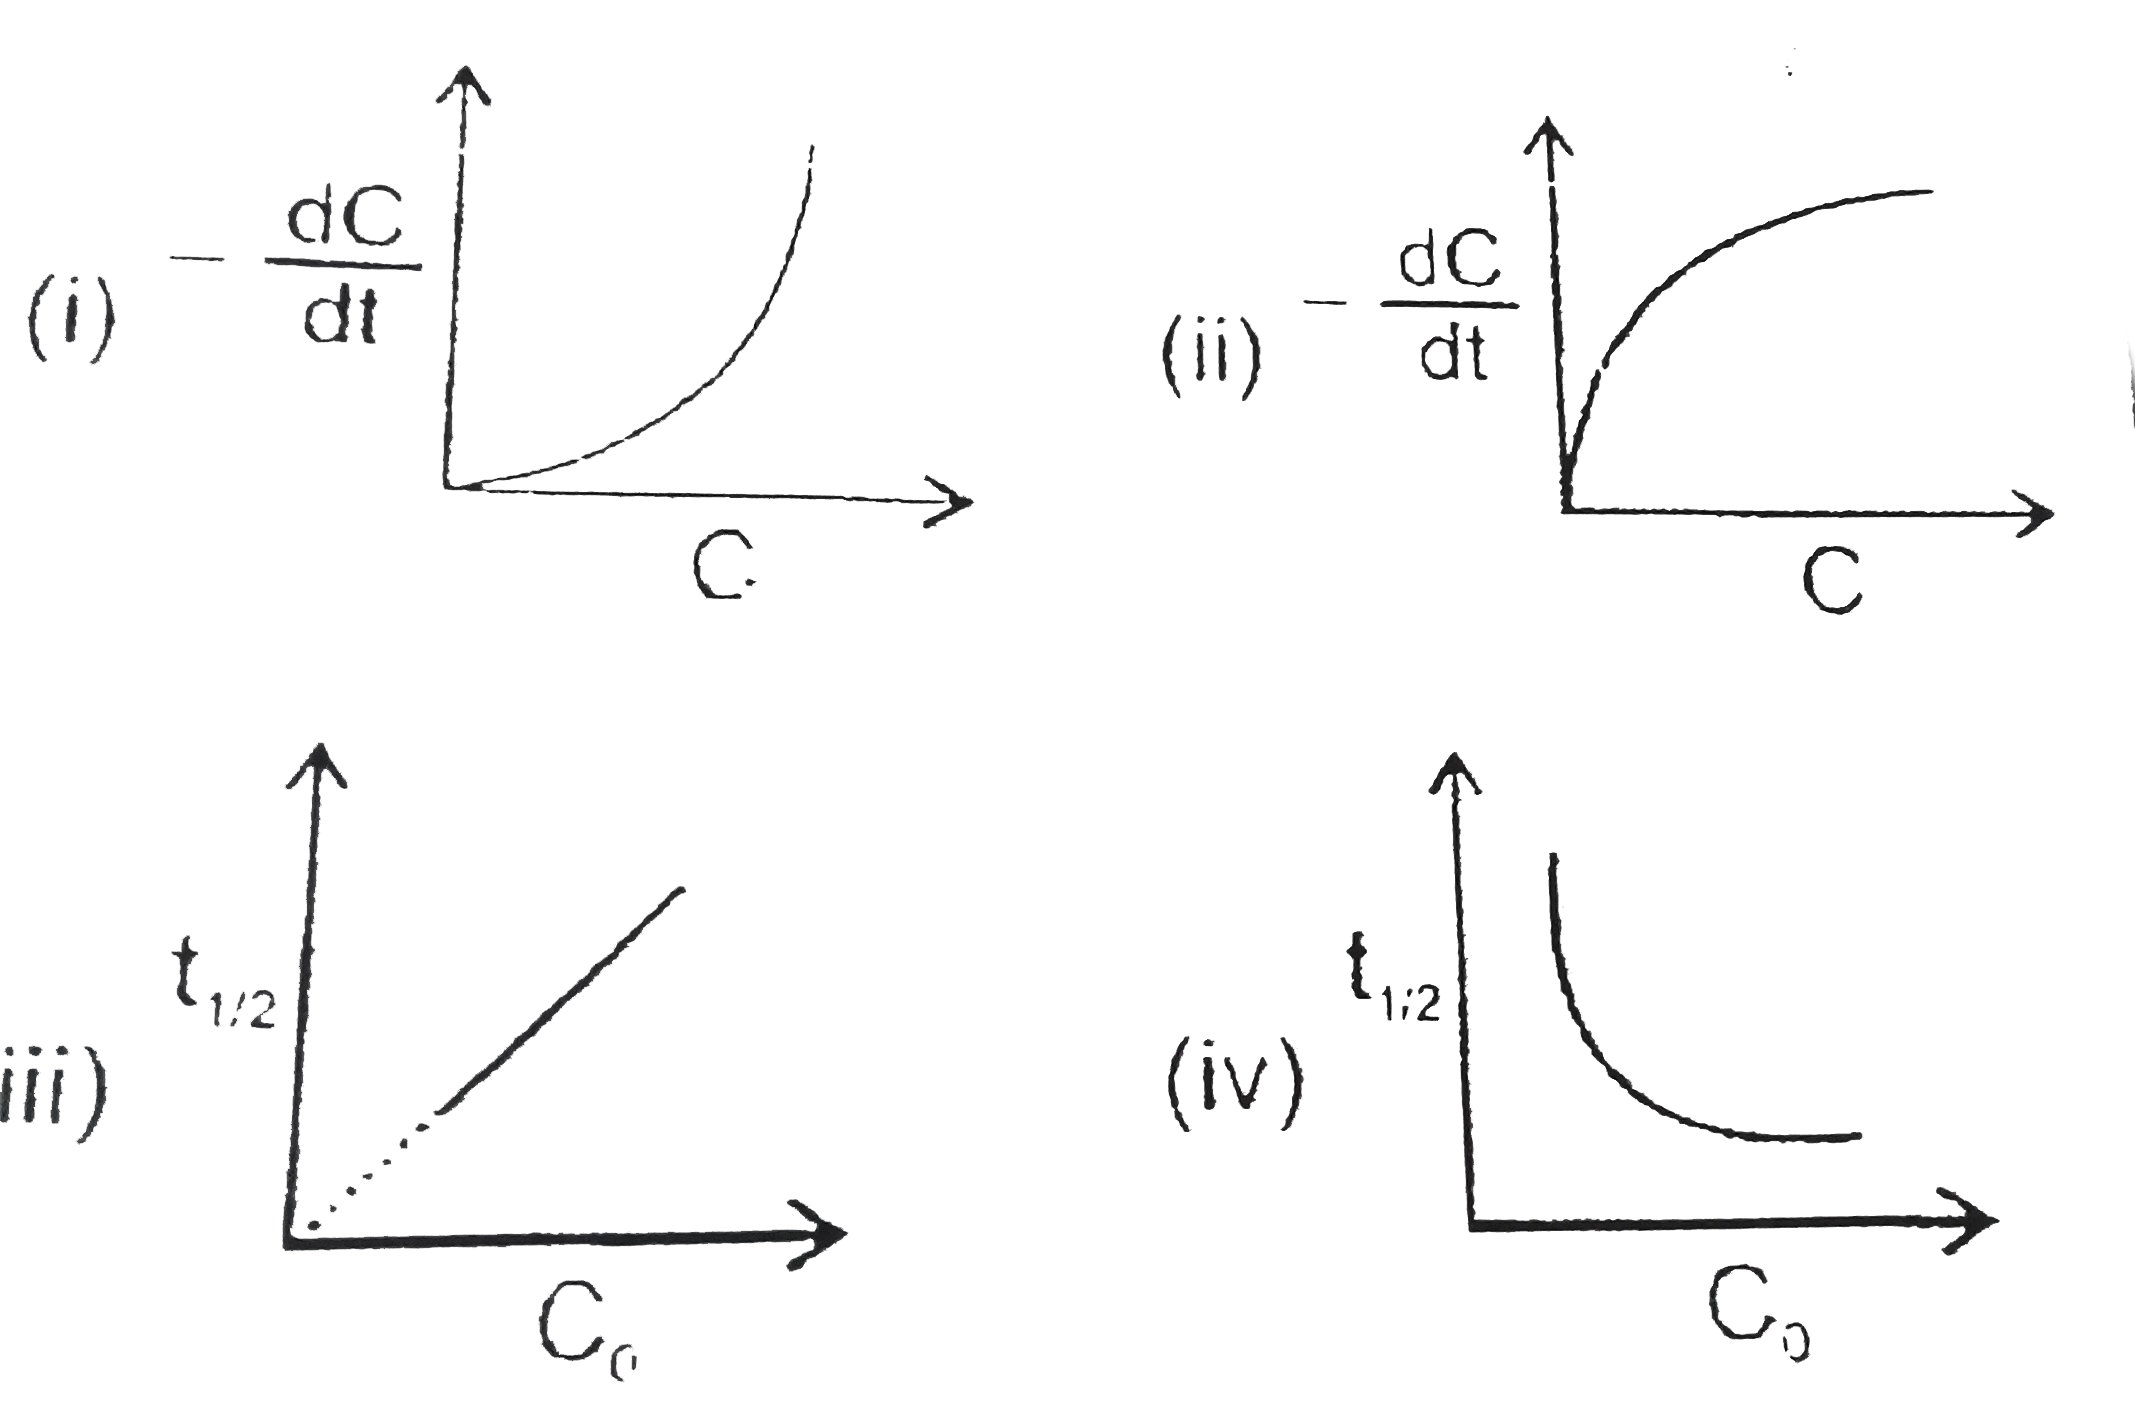
Which of the following graphs are correct for a second order reaction: (where symbols have their usual meanings)View Solution

