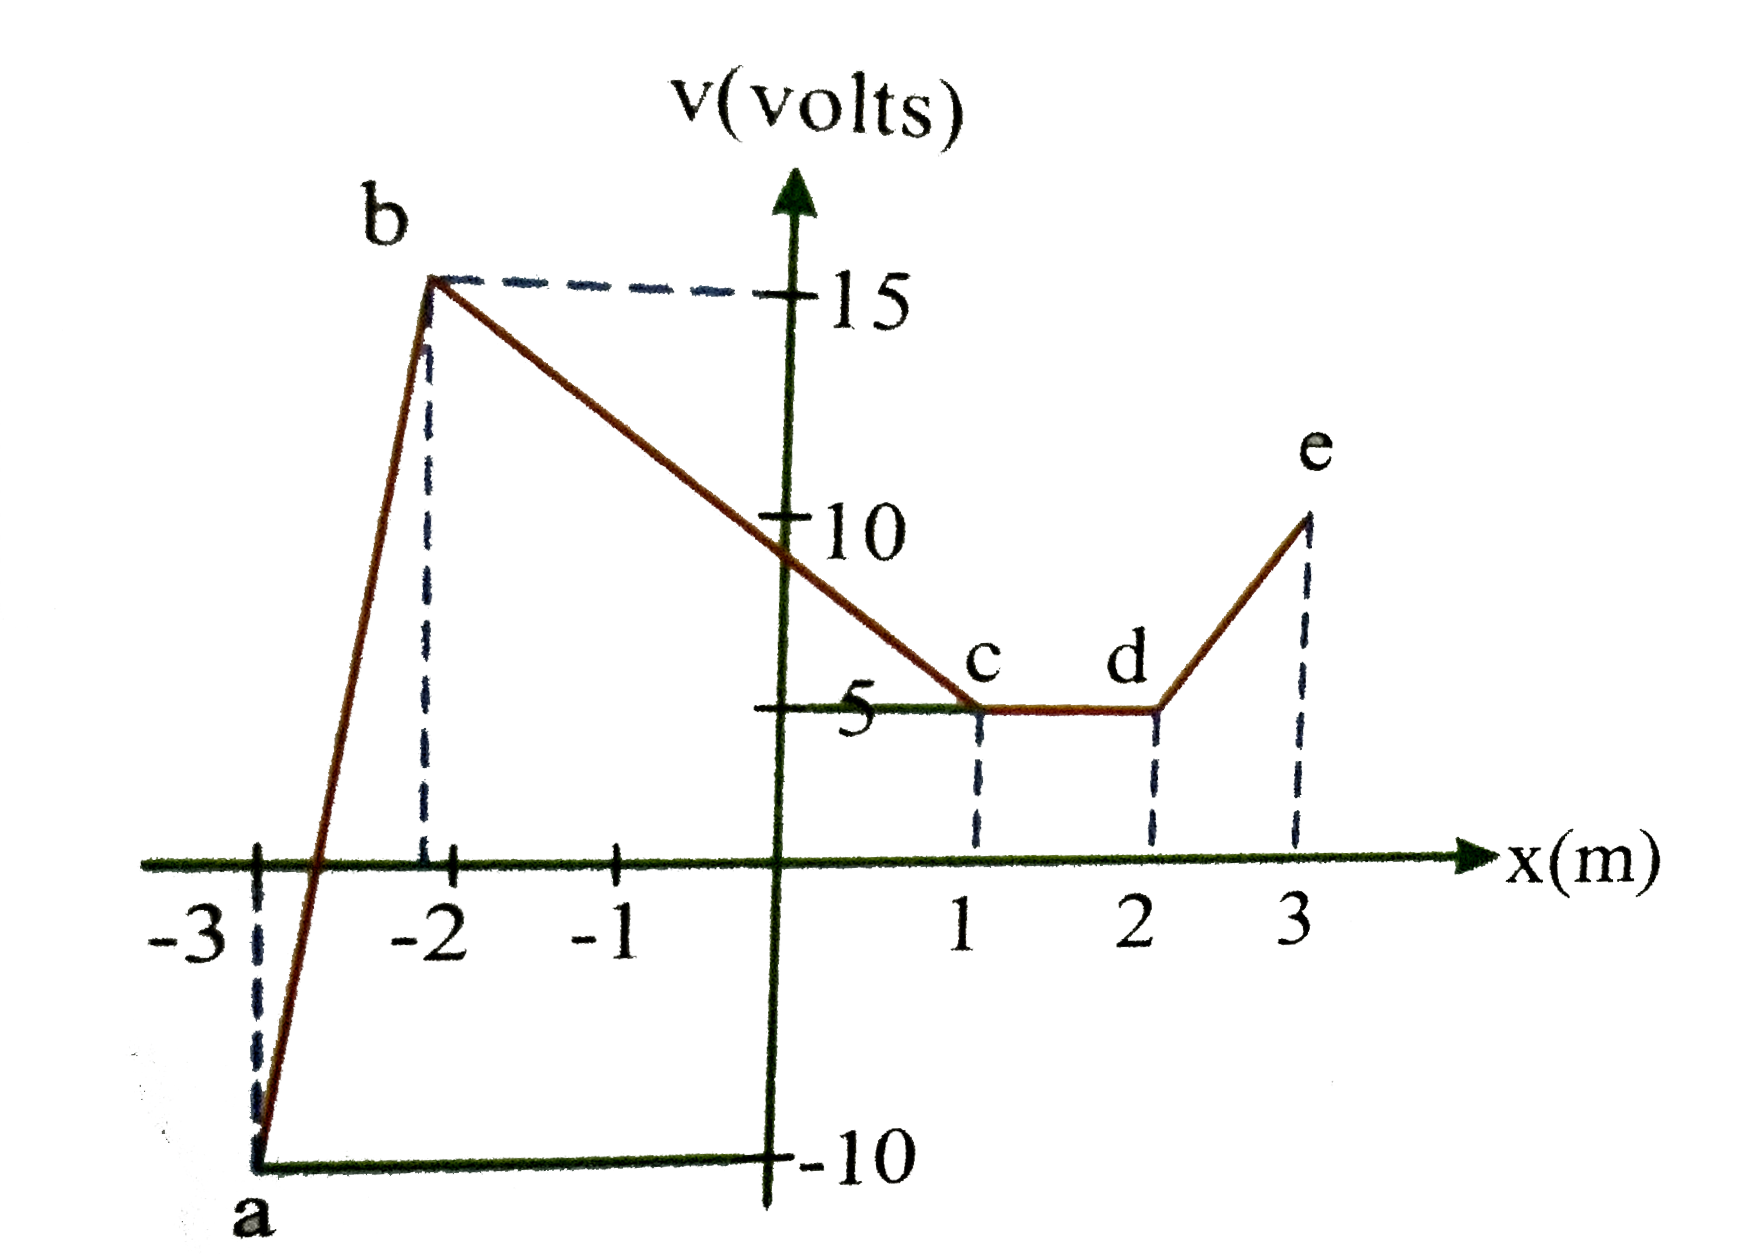
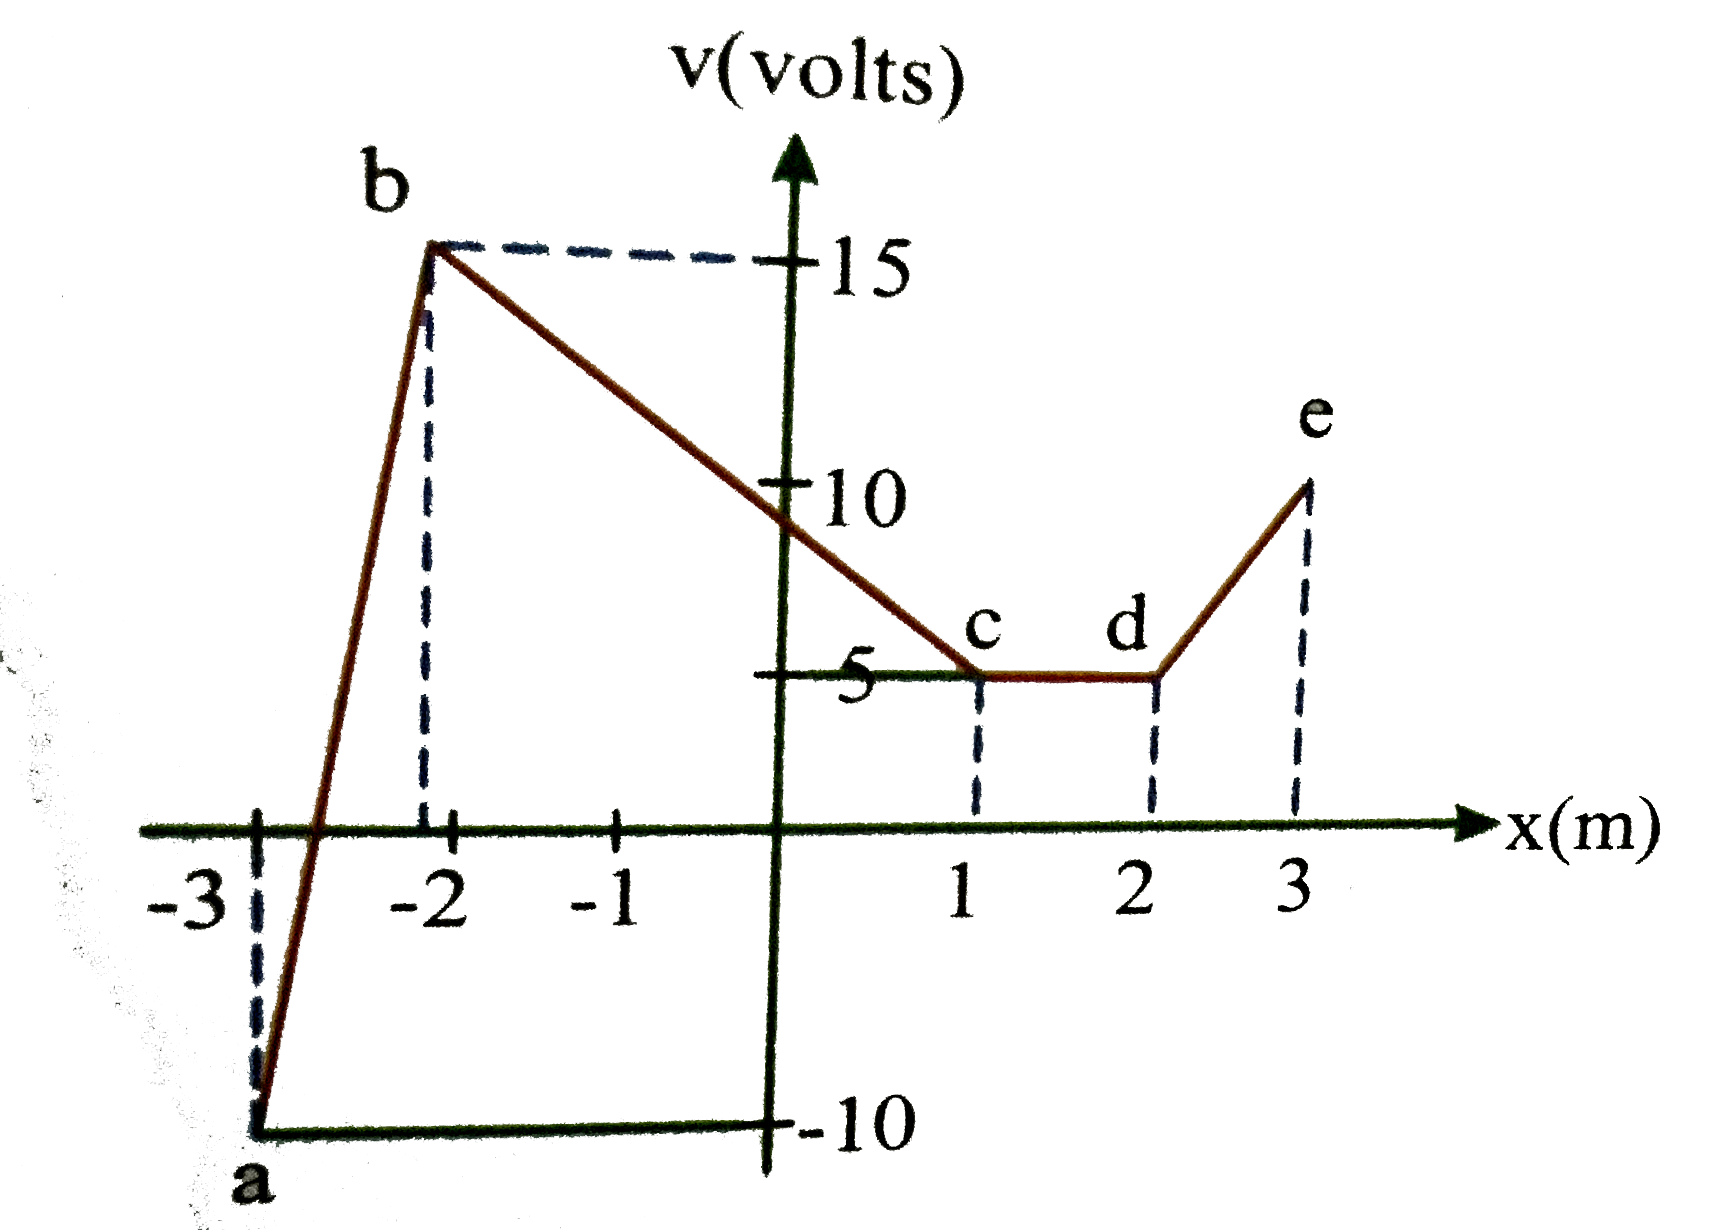
 Suppose electric potential varies along the x−aξs as shown in the above figure the potential doesnot vary in yorz direction of the intervals shown (ignore the behaviour at the end points of the intervals) the field Ex has a maximum absolute value FB_(1)Vm−1 in the region FB_(2) its value in the region cd is FB_(3)Vm−1 then
The region that fills FB_(2) is
ab
de
bc
dc
The correct Answer is:A
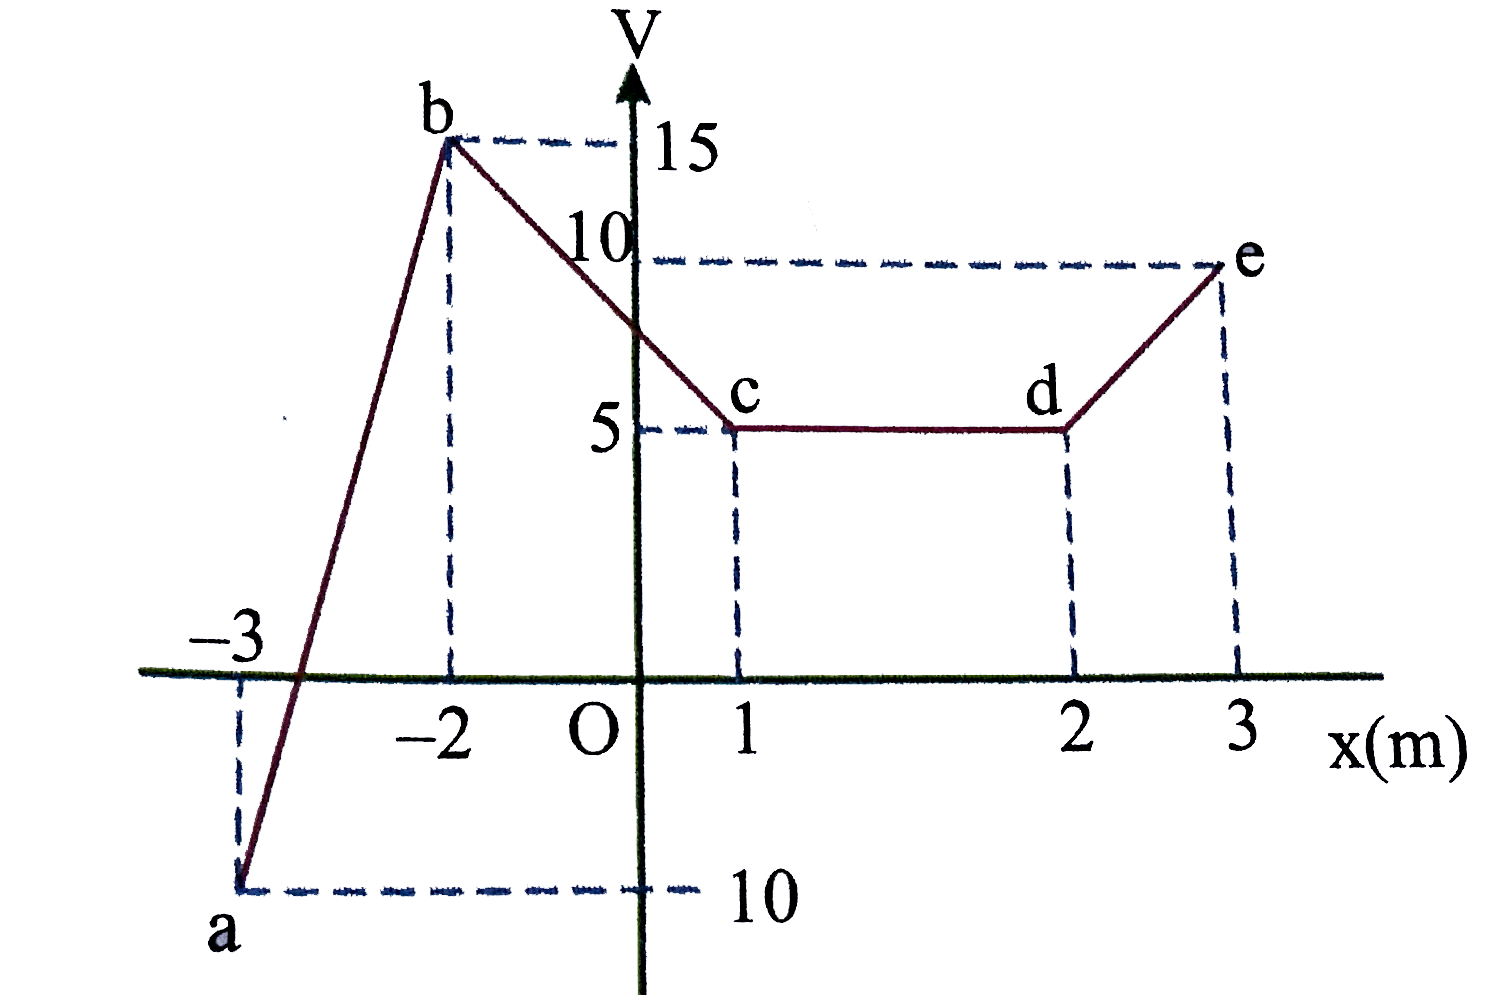
(Ex)maxValue 'FB1' in the region FB2
Ex=value of cdis FB3Vm−1
E=−dVdx⇒Eab=−(251)=−25
Ebe=(5−151+2)=103Ecd=0
Ede=−(15−53−2)=−10
⇒(Ex)Max=25V/m−1⇒FB2 is ab
Taking the values of Eab,Ebc,Ecd,Ede, .The plot of Ex Vsx will be as shown in D option.
For a→b part V=25x+65
∴ when V=0⇒x=−6525=−135m
Topper's Solved these Questions
- ELECTROSTATICS AND GAUSS LAWBOOK - NARAYNACHAPTER - ELECTROSTATICS AND GAUSS LAWEXERCISE - Passage V
3 Videos
- ELECTROSTATICS AND GAUSS LAWBOOK - NARAYNACHAPTER - ELECTROSTATICS AND GAUSS LAWEXERCISE - Passage VI
3 Videos
- ELECTROSTATICS AND GAUSS LAWBOOK - NARAYNACHAPTER - ELECTROSTATICS AND GAUSS LAWEXERCISE - Passage III
3 Videos
- ELECTROSTATIC POTENTIAL AND CAPACITANCEBOOK - NARAYNACHAPTER - ELECTROSTATIC POTENTIAL AND CAPACITANCEEXERCISE - ADDITIONAL PROBLEMS
14 Videos
- EXPERIMENTAL PHYSICSBOOK - NARAYNACHAPTER - EXPERIMENTAL PHYSICSEXERCISE - Comprehension type
6 Videos
Similar Questions
Use a definite integral to find the area of the region between the given curve and the x-axis on the interval [0, b]
y=x2+1
View Solution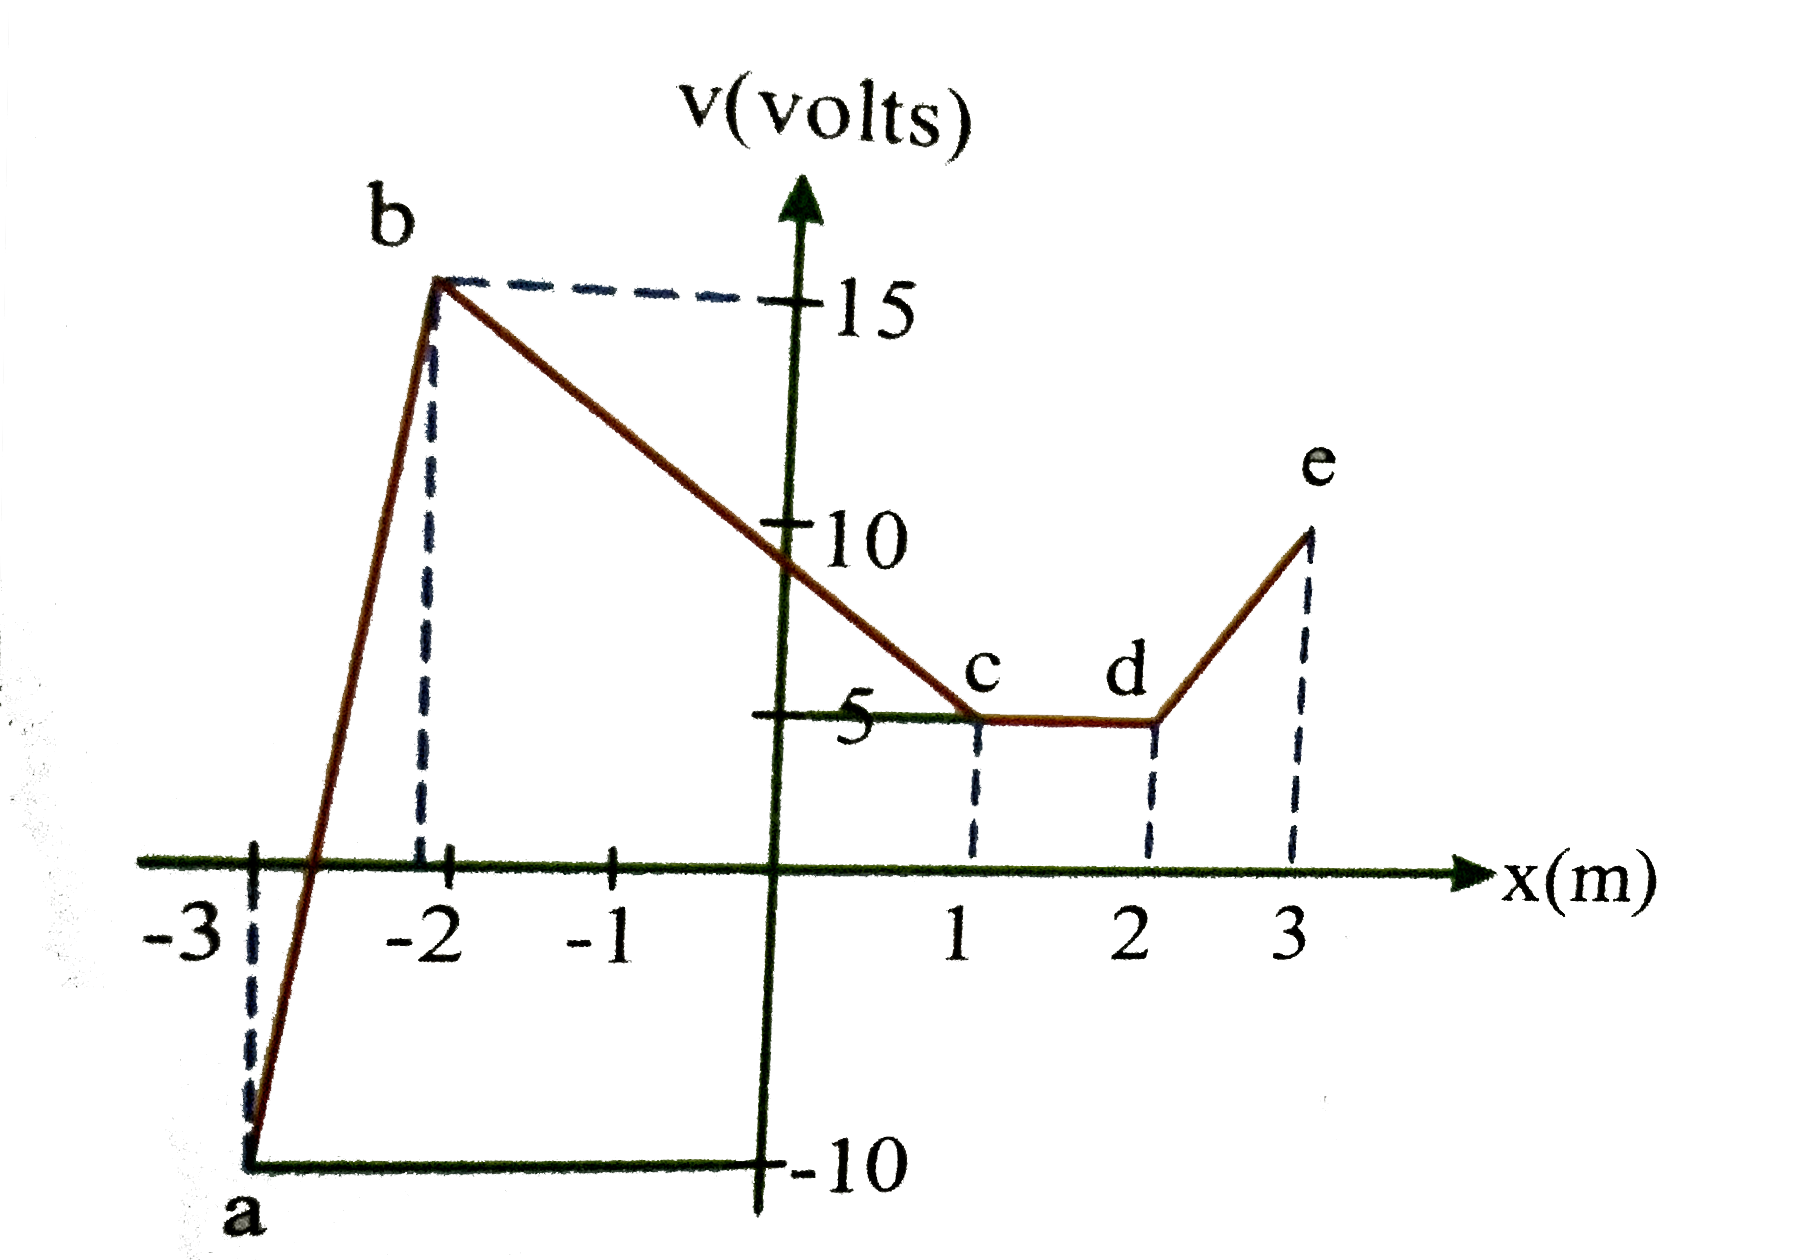 Suppose electric potential varies along the x-axis as shown in the above figure the potential doesnot vary in yorz direction of the intervals shown (ignore the behaviour at the end points of the intervals) the field Ex has a maximum absolute value FB_(1)Vm−1 in the region FB_(2) its value in the region cd is FB_(3)Vm−1 then
In the Vvsx curve ,the potential possesses a zero value at
View Solution
Knowledge Check
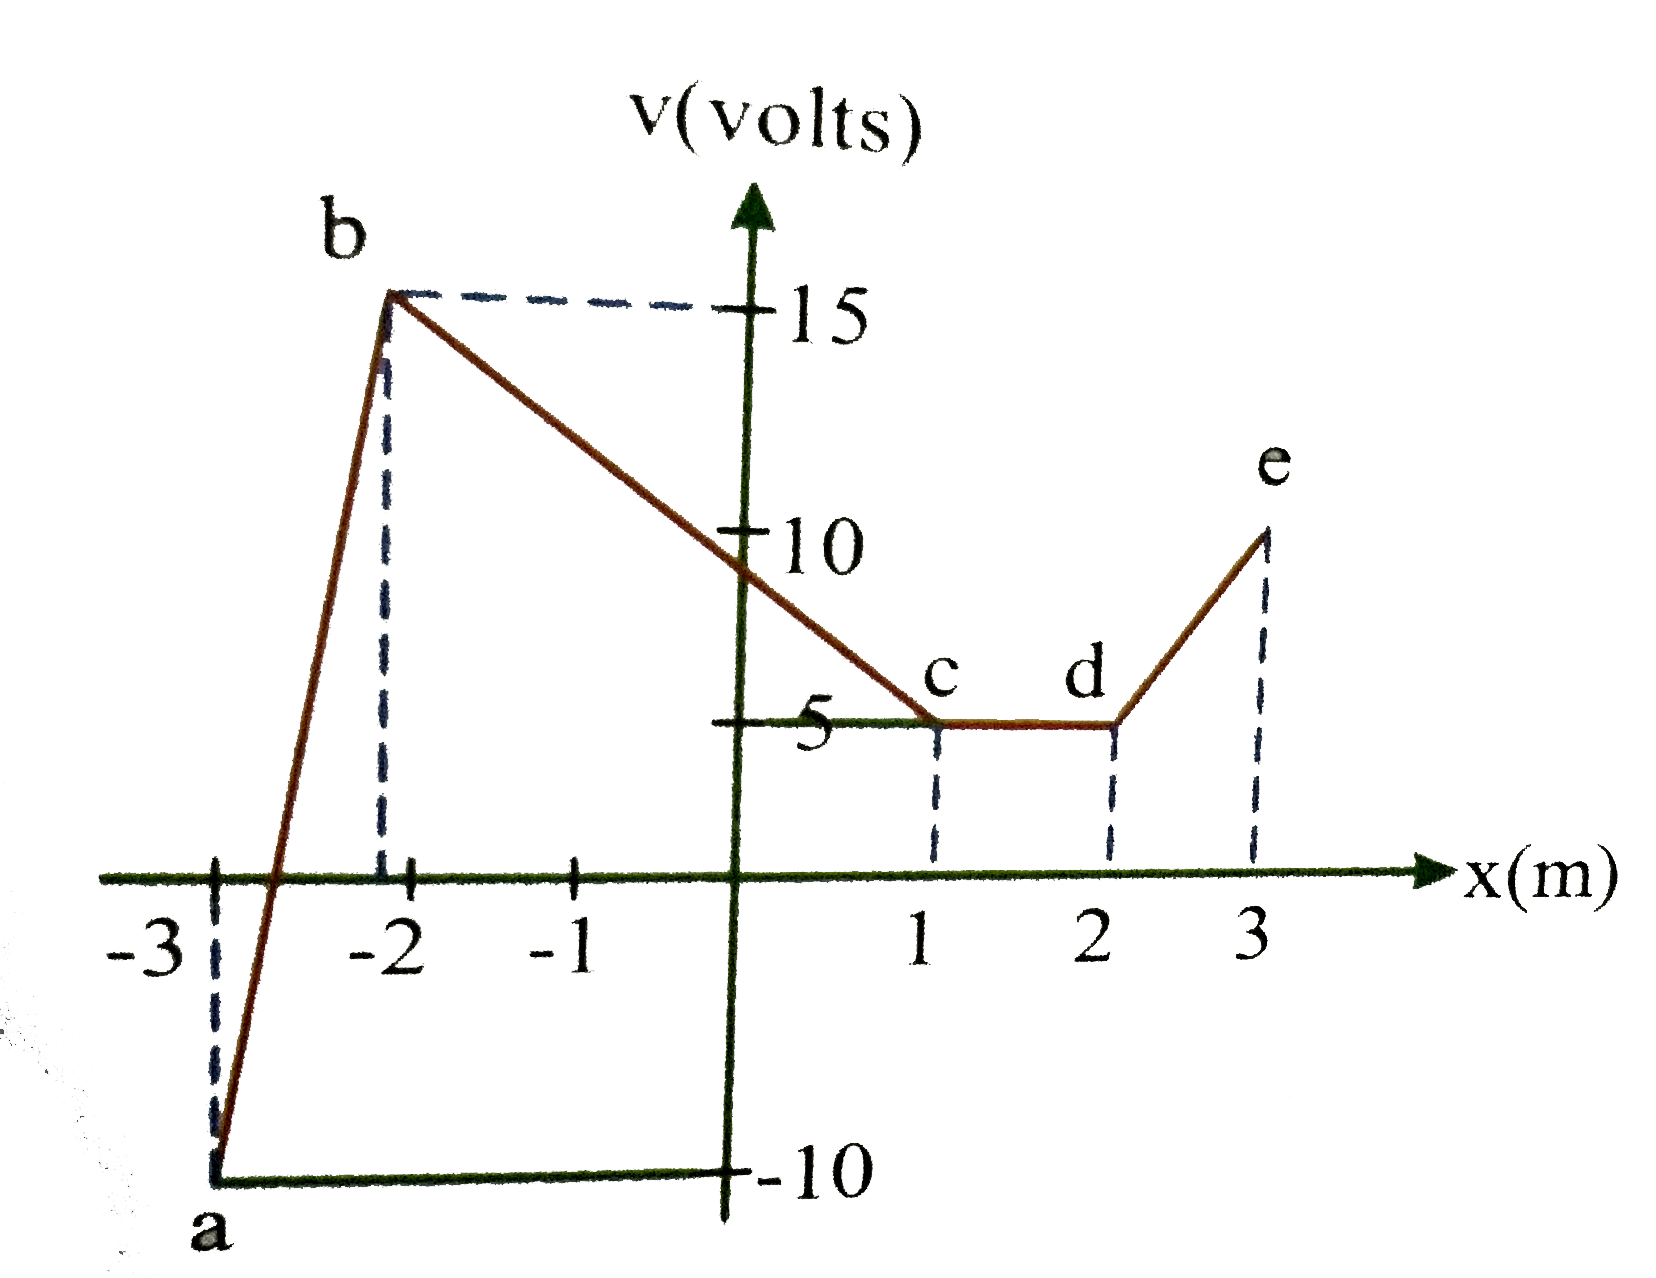 Suppose electric potential varies along the x-axis as shown in the above figure the potential doesnot vary in yorz direction of the intervals shown (ignore the behaviour at the end points of the intervals) the field Ex has a maximum absolute value FB_(1)Vm−1 in the region FB_(2) its value in the region cd is FB_(3)Vm−1 then
The plot Exvsx isA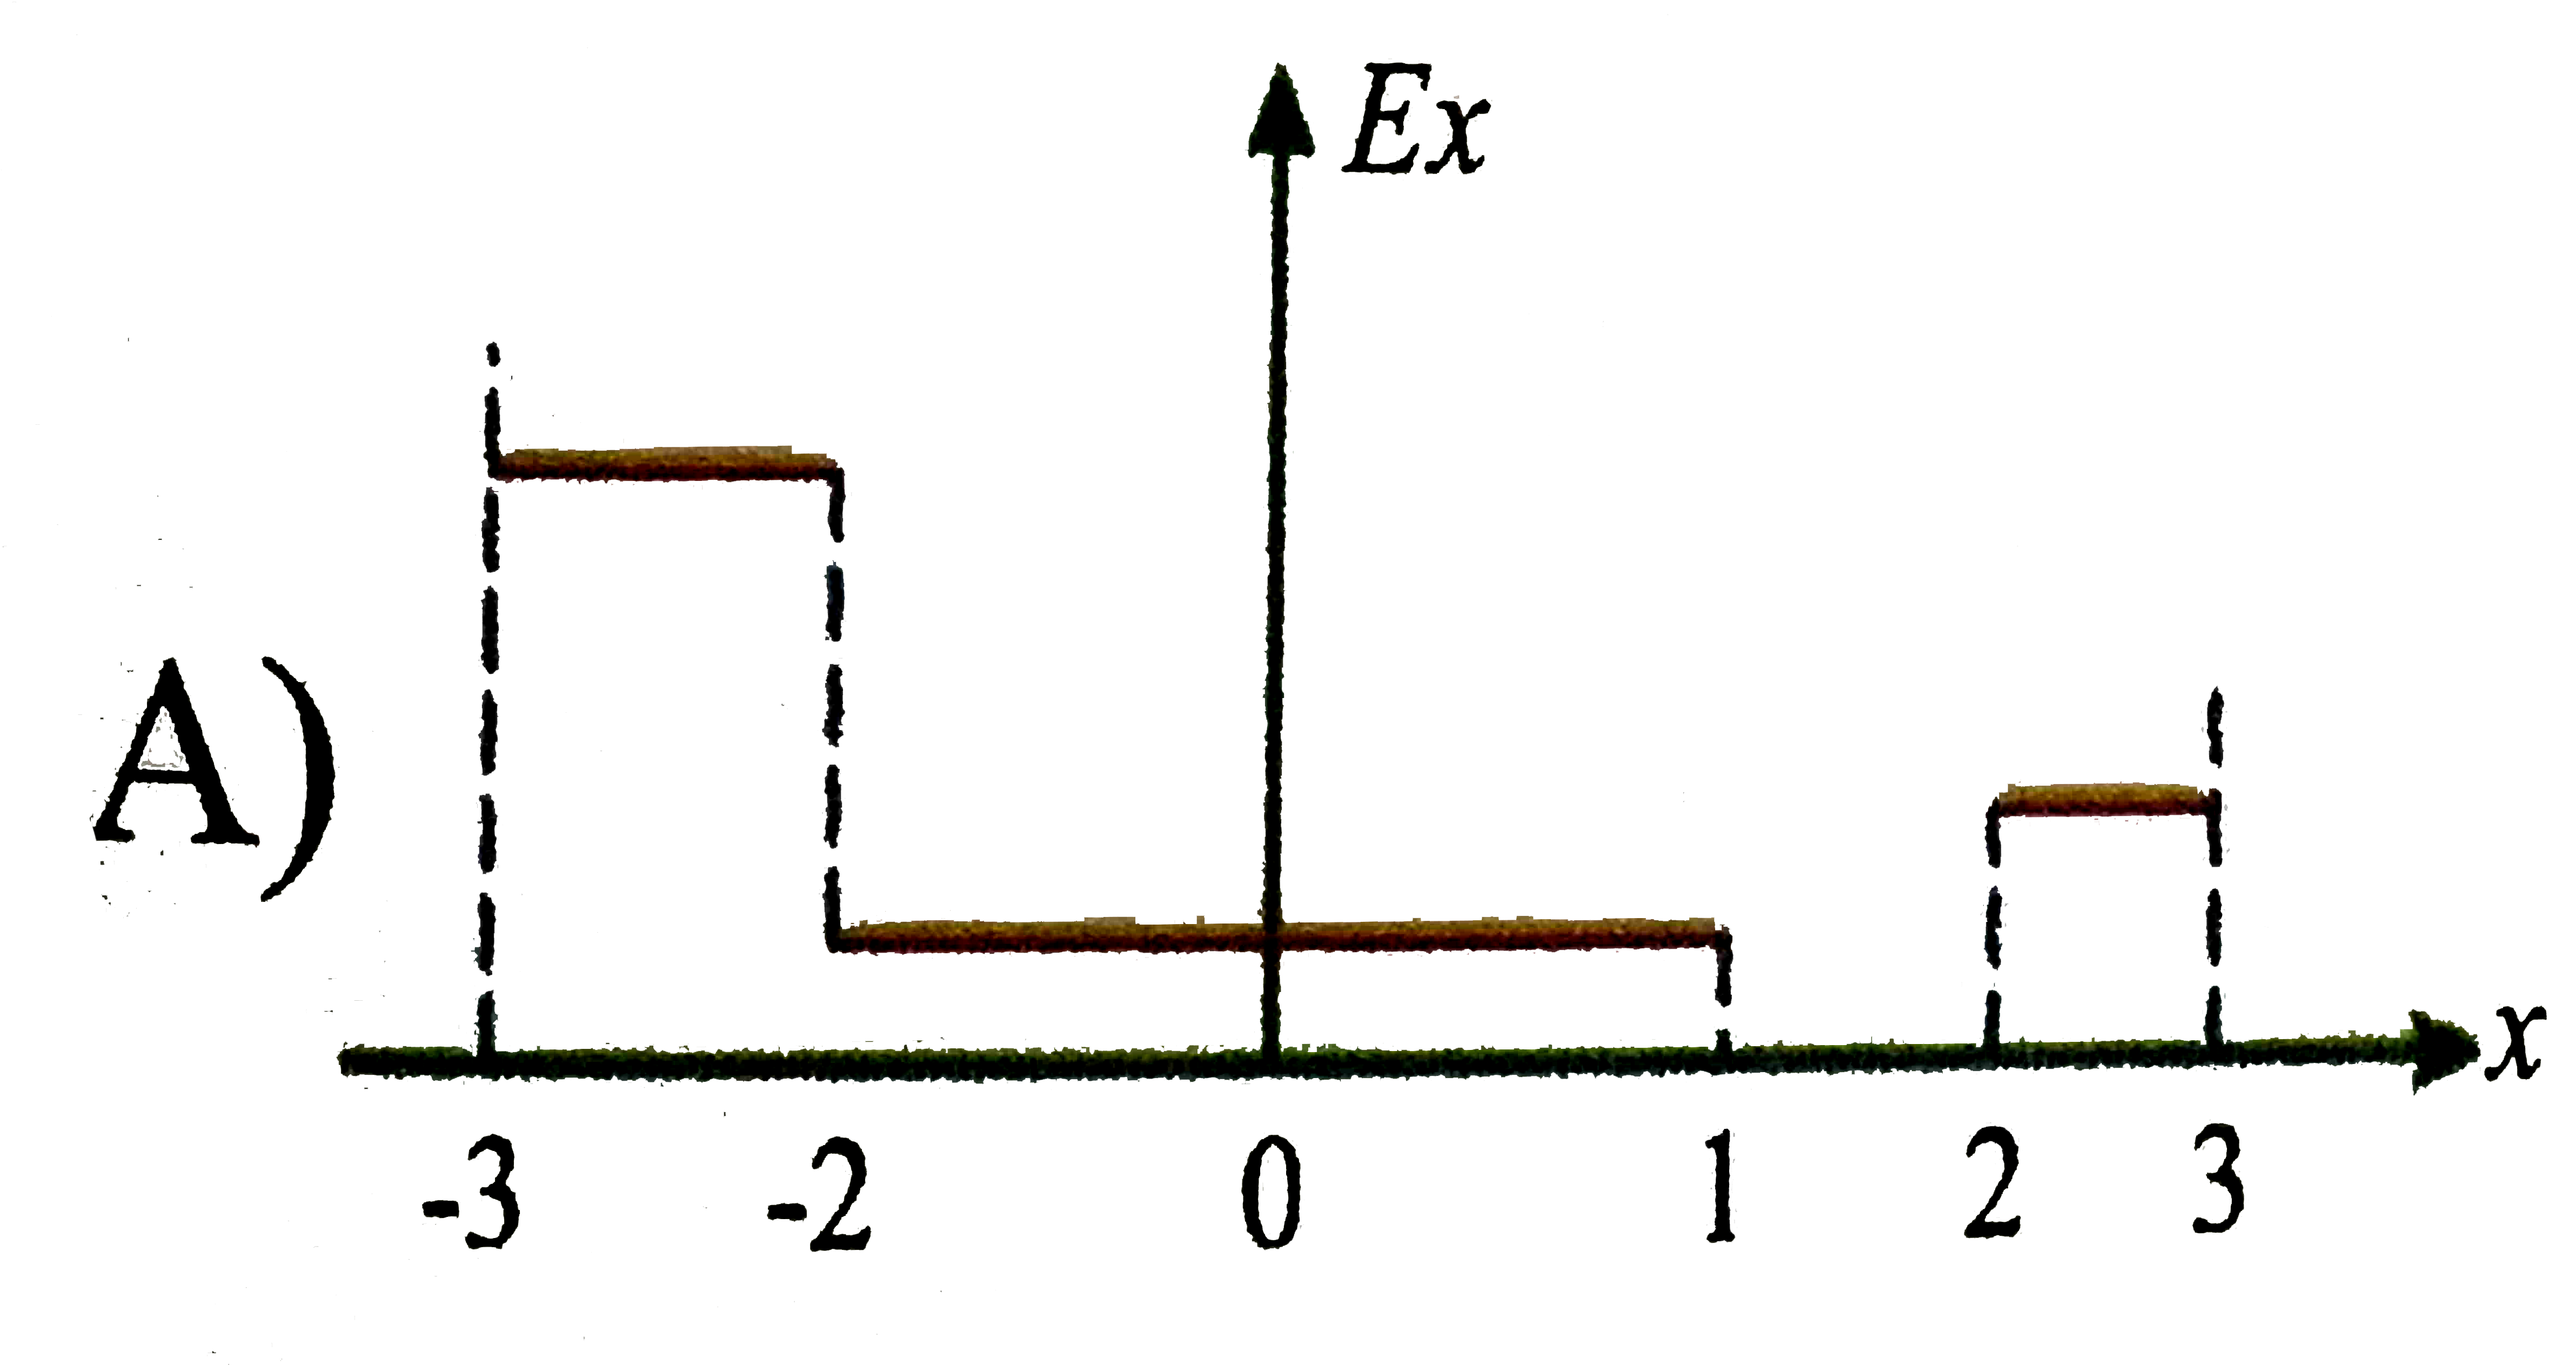 B
B C
C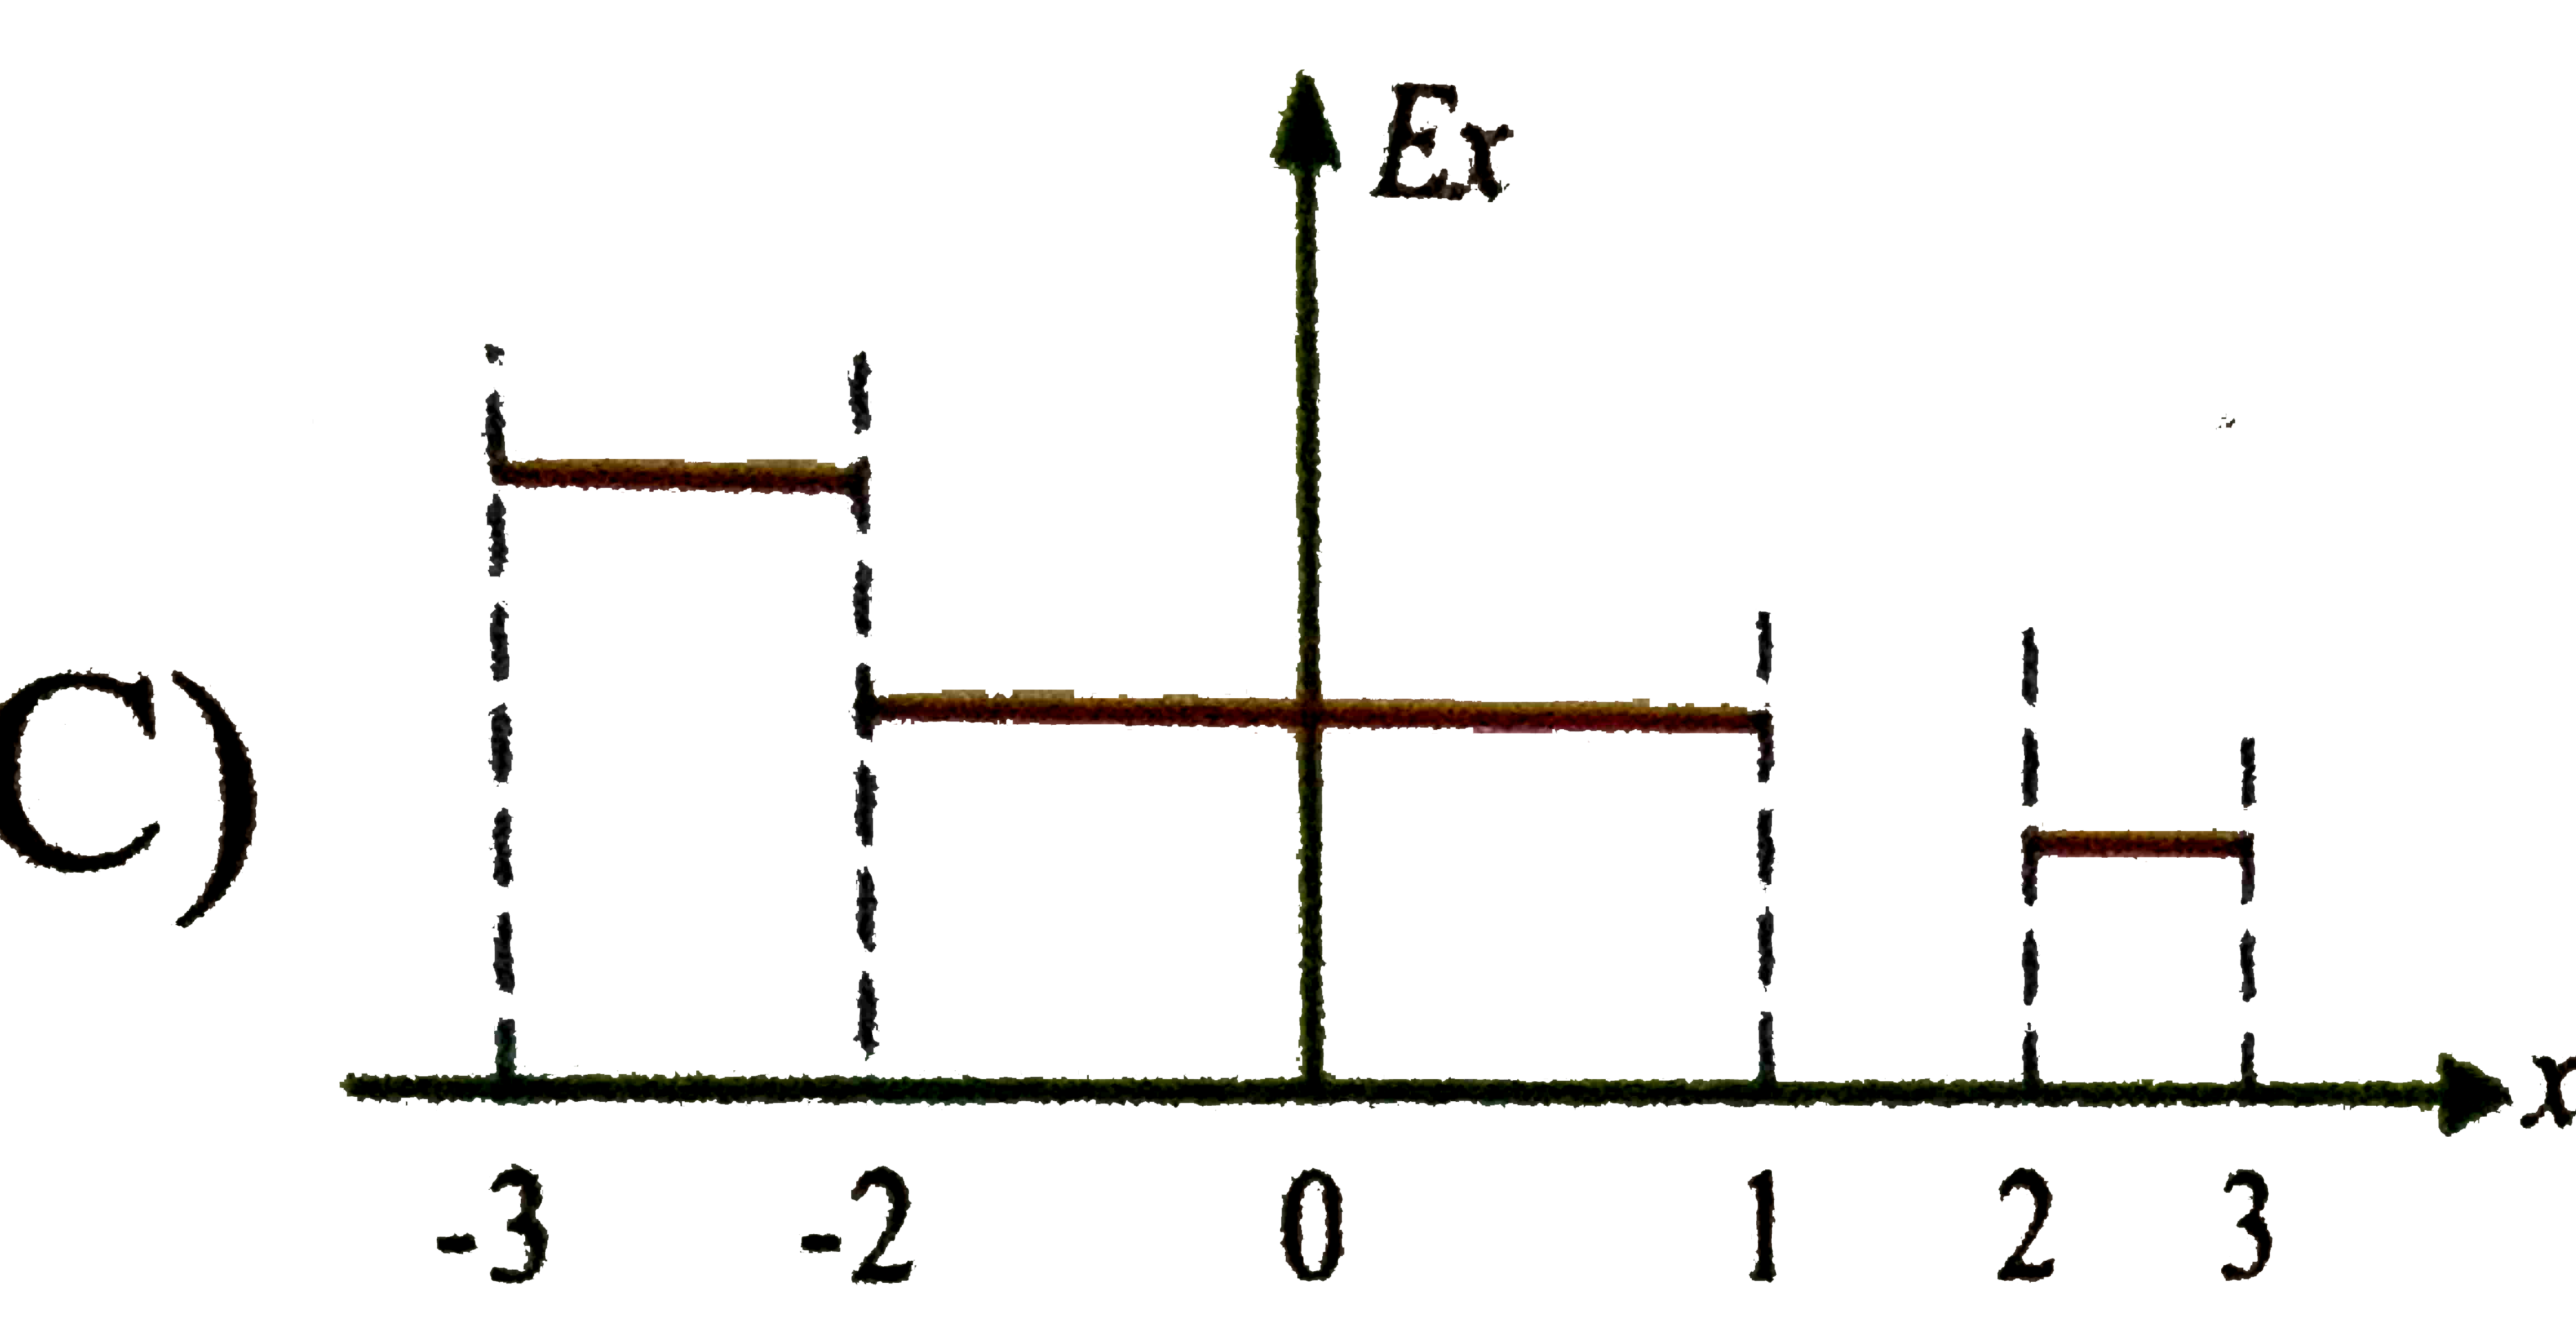 D
D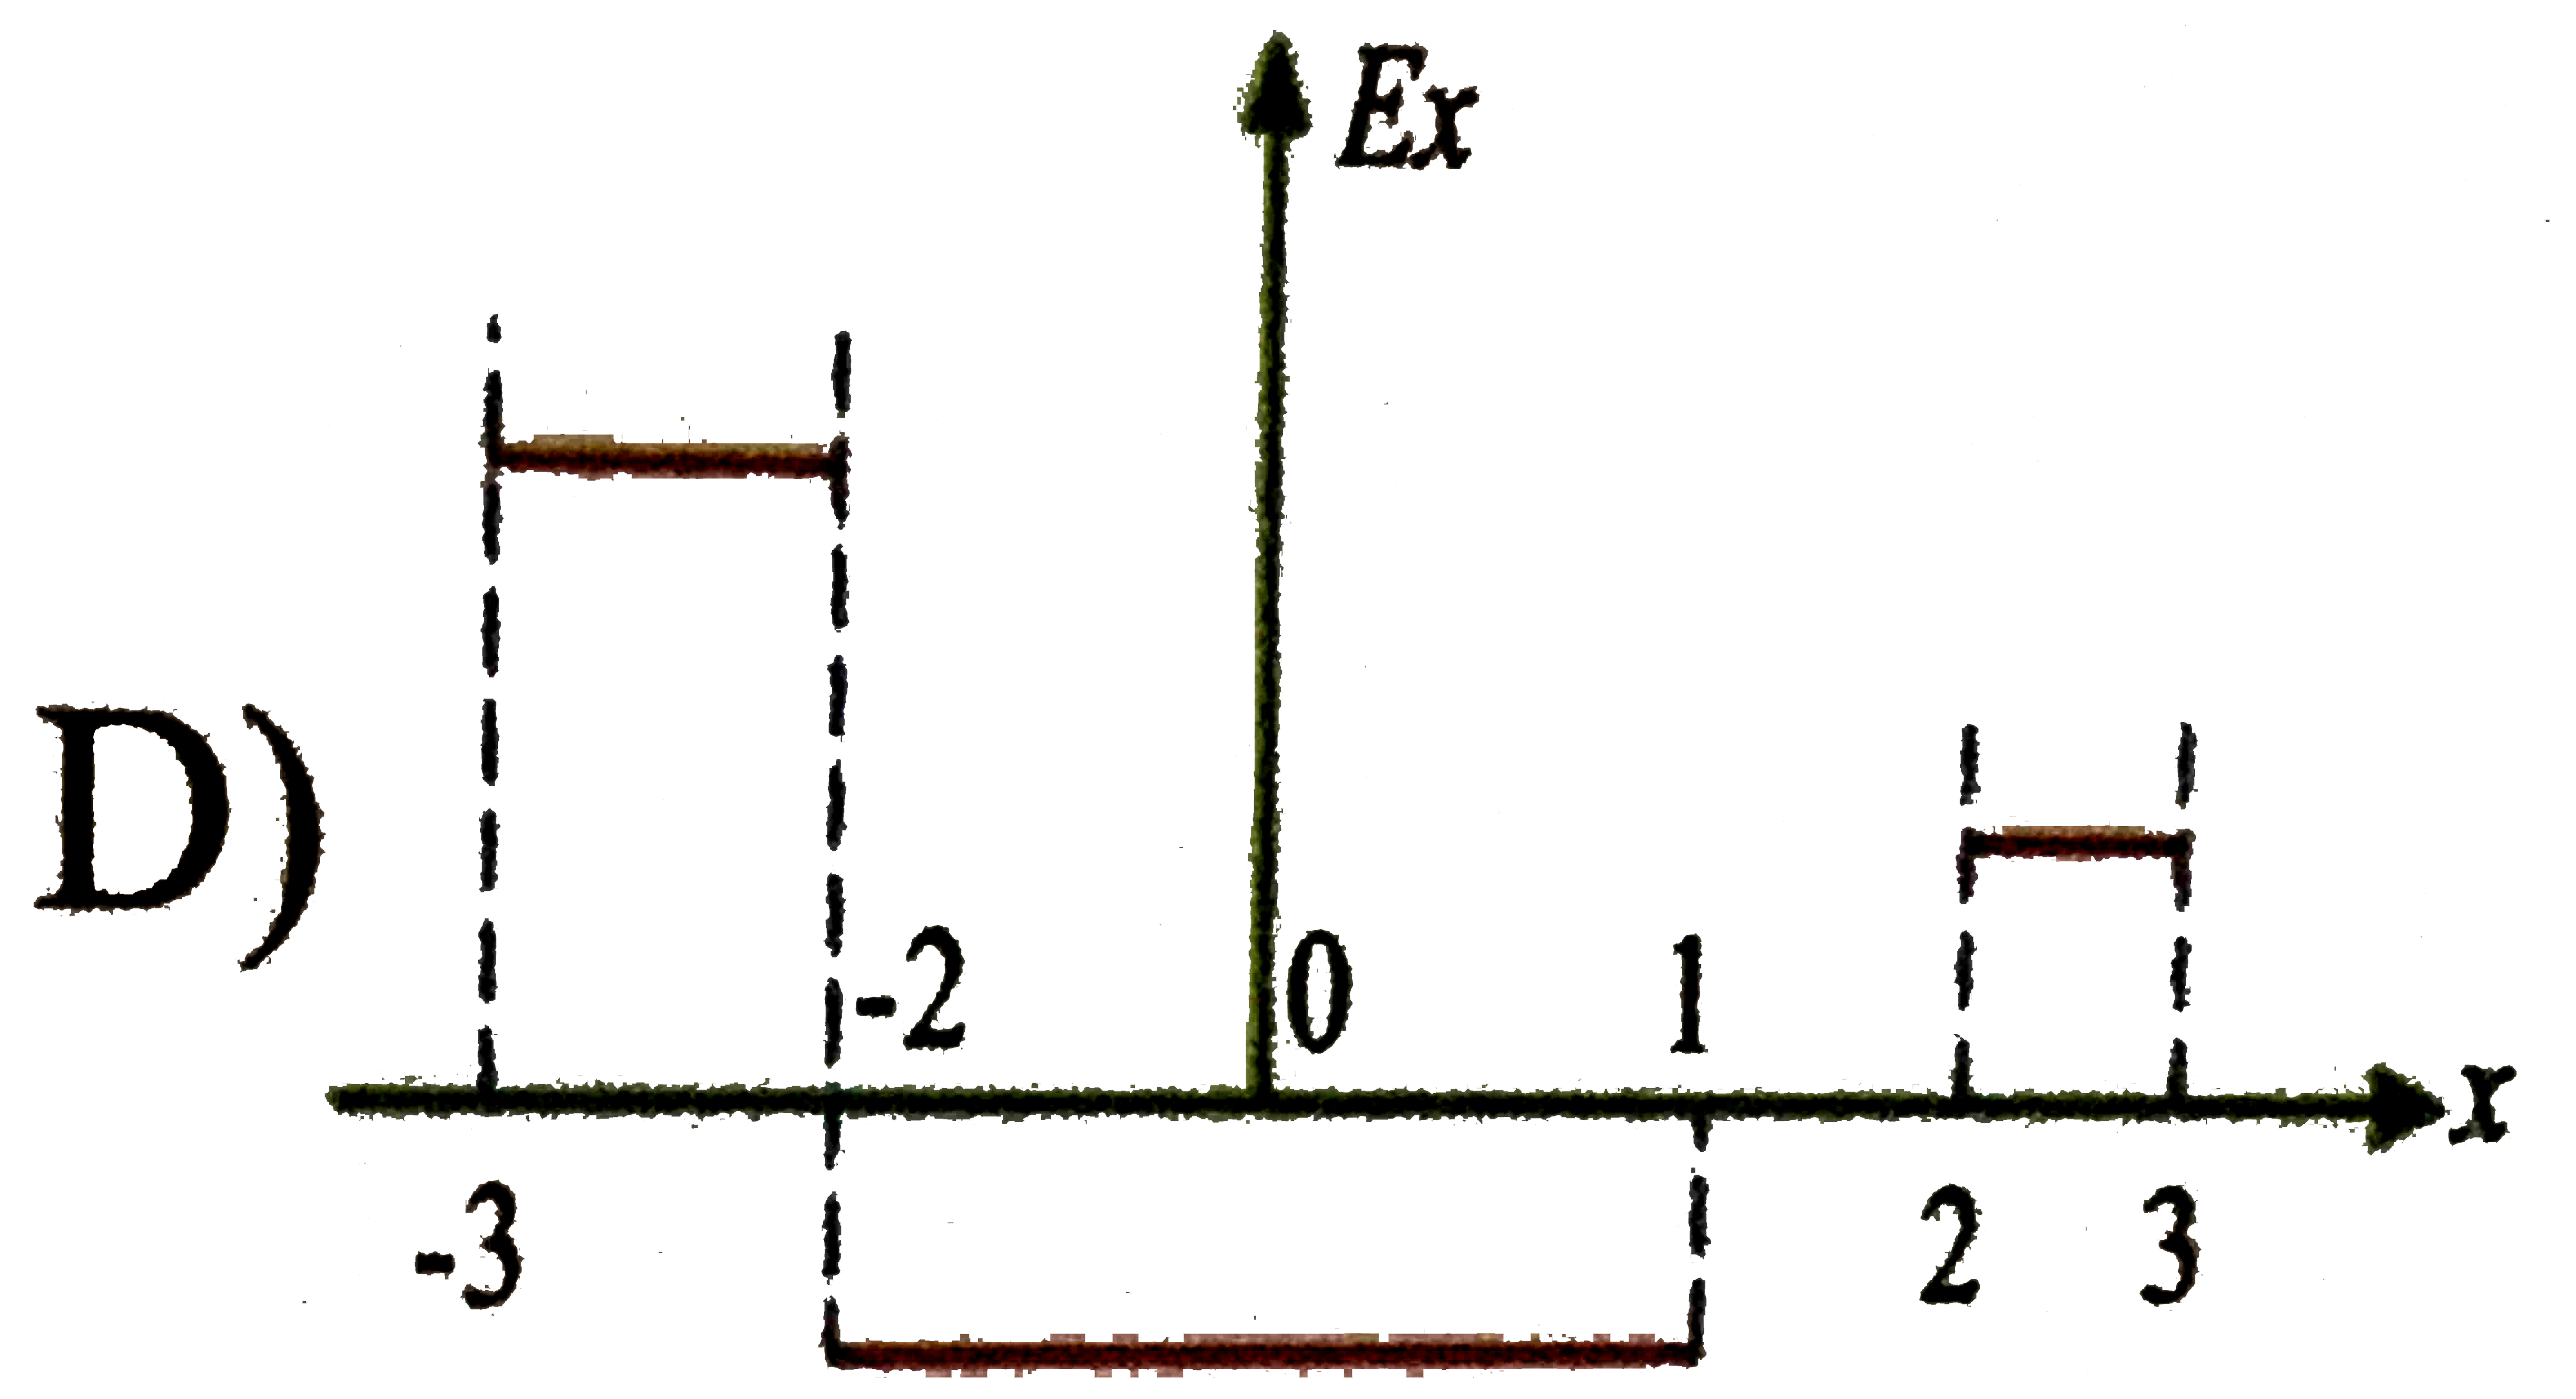
 Suppose electric potential varies along the x-axis as shown in the above figure the potential doesnot vary in yorz direction of the intervals shown (ignore the behaviour at the end points of the intervals) the field Ex has a maximum absolute value FB_(1)Vm−1 in the region FB_(2) its value in the region cd is FB_(3)Vm−1 then
The value that fills FB_(1) isA252B25C152D−50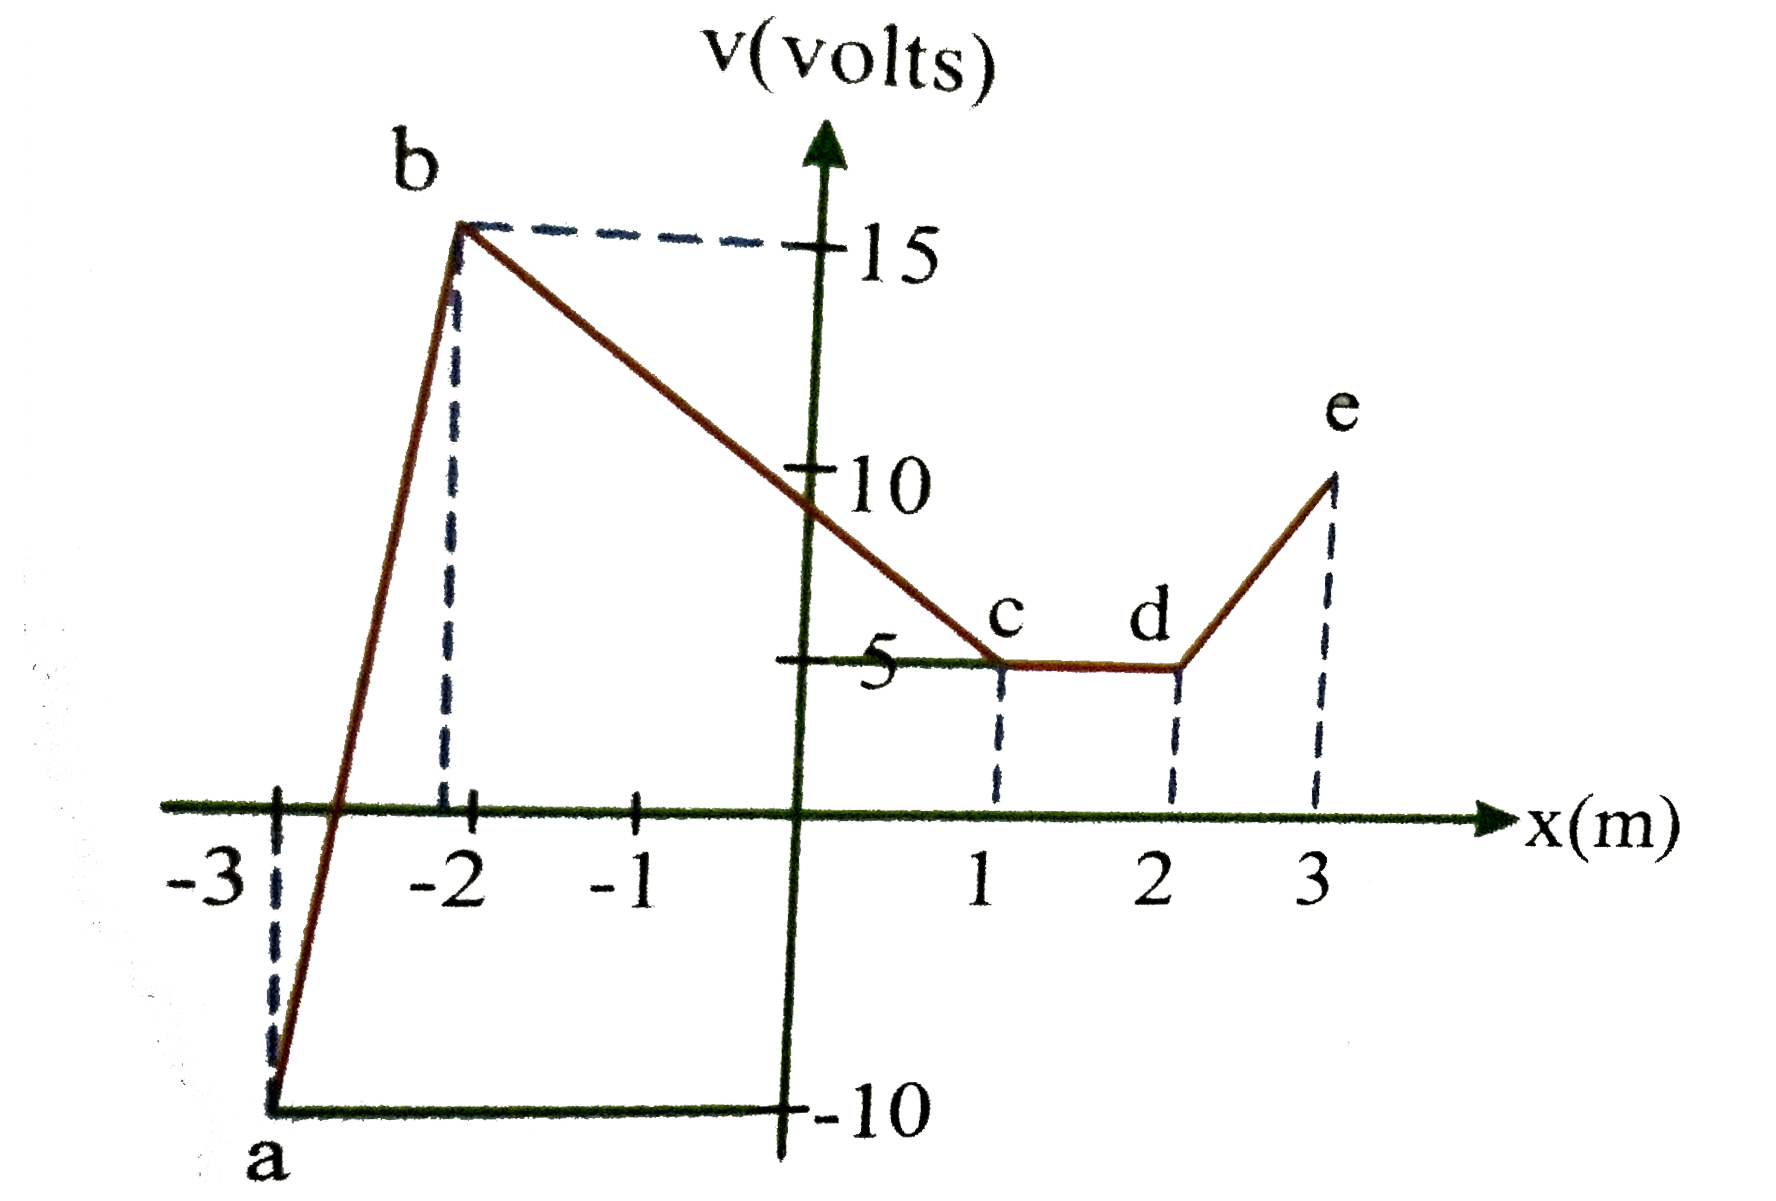 Suppose electric potential varies along the x-axis as shown in the above figure the potential doesnot vary in y or z direction of the intervals shown (ignore the behaviour at the end points of the intervals) the field Ex has a maximum absolute value FB1Vm−1 in the region FB_(2) its value in the region cd is FB_(3)Vm−1 then
The value that fills FB_(3) isA1B2C3Dzero
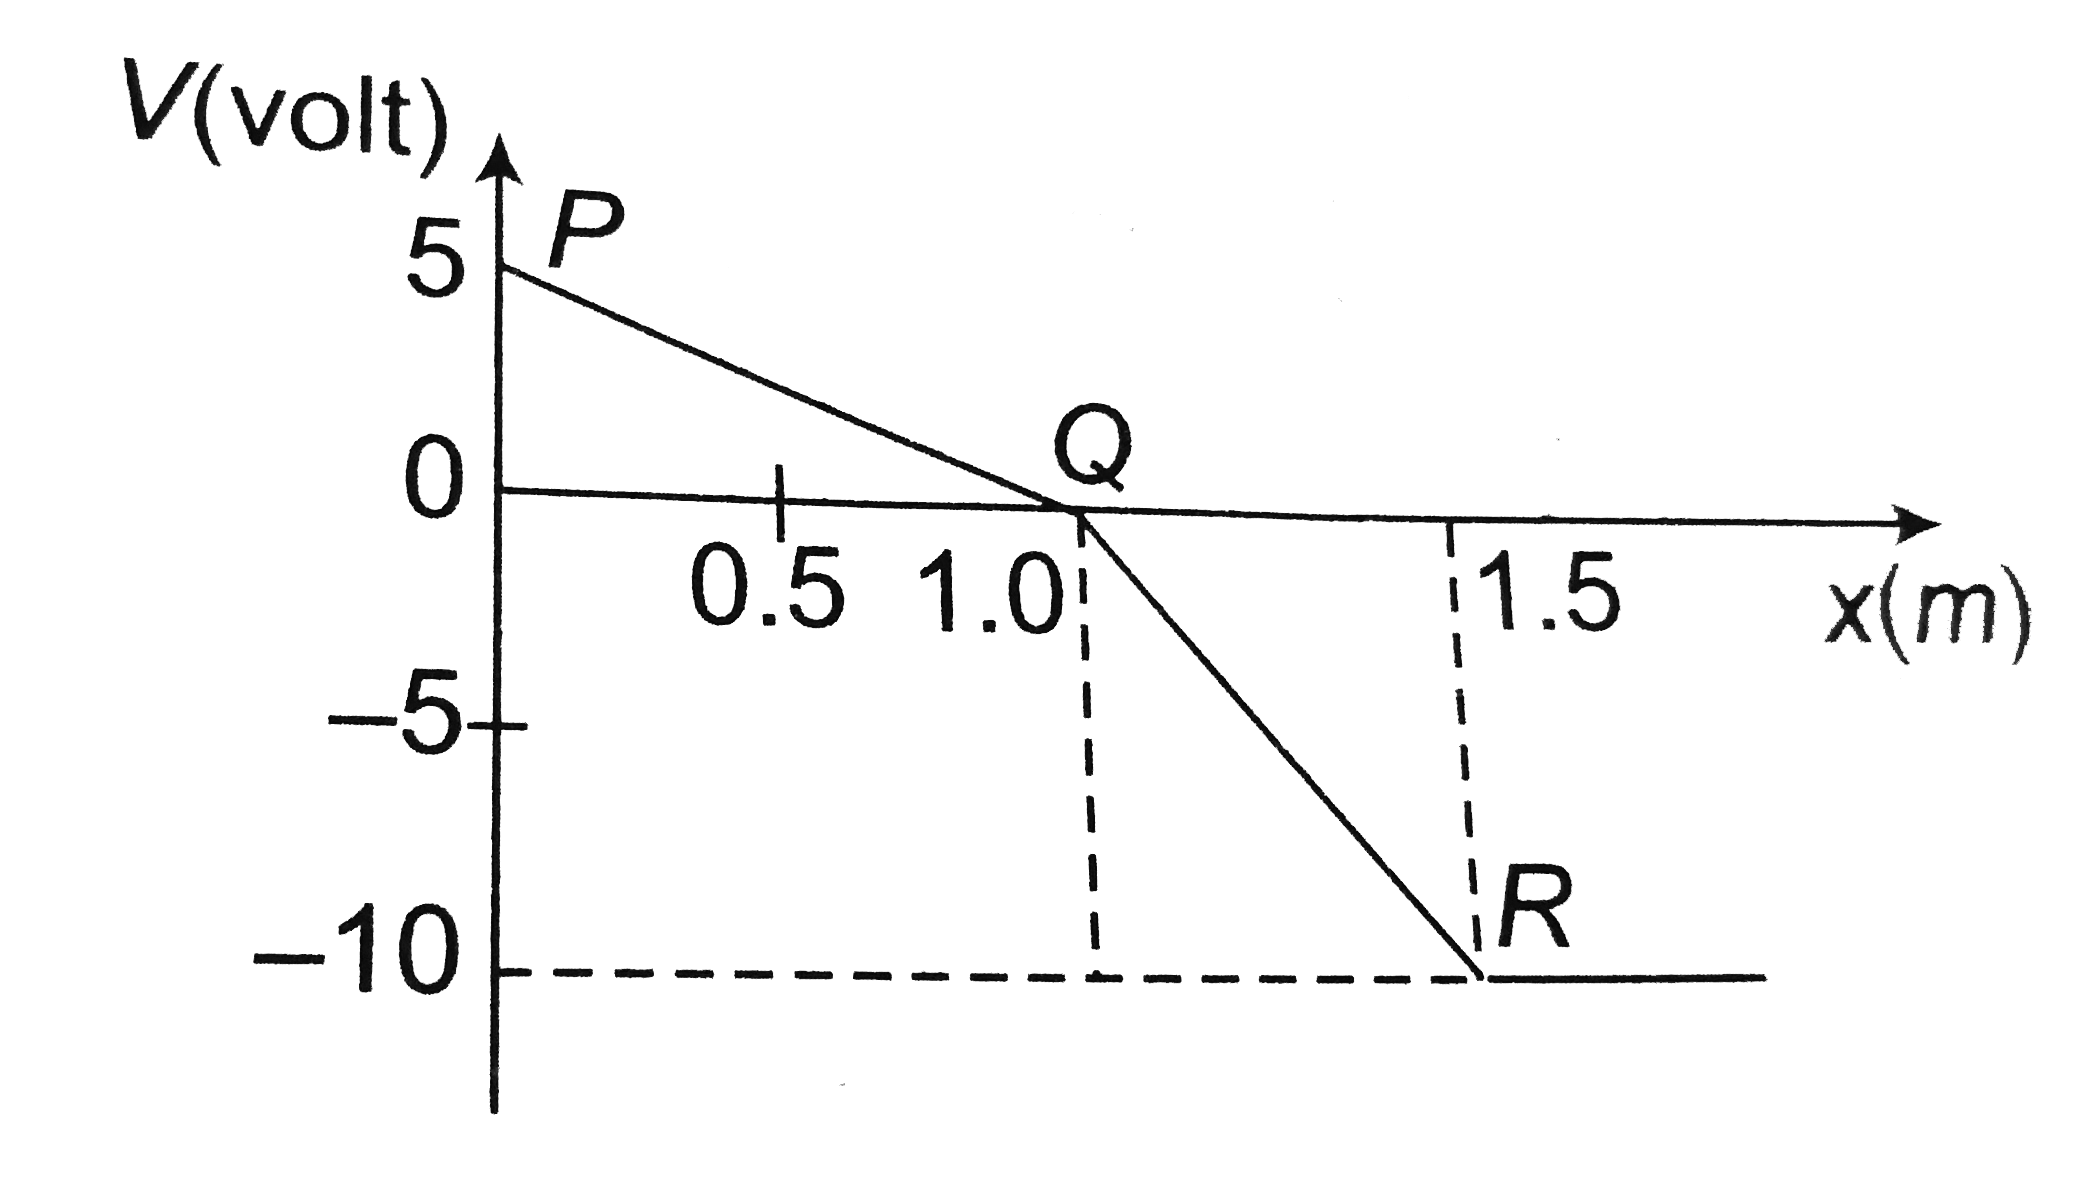
In an electric field region, the electric potential varies along the x-axis as shown in the graph. The x components of the electirc field in the regions for the intervals PQ and QR as market in the garph, in N/C, are respectively:
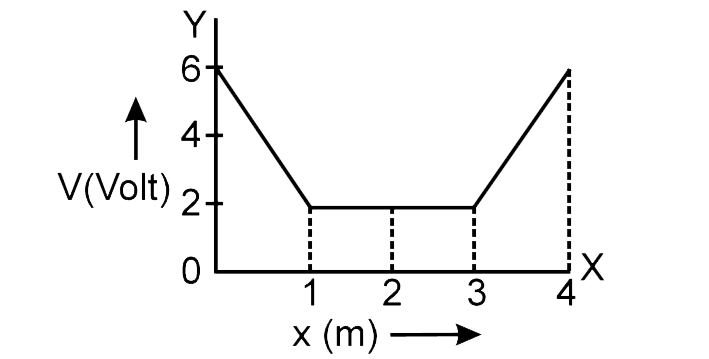
View SolutionThe variation of electric potential with distance from a fixed point is shown in figure. What is the value of electric field at x=2m -
View SolutionThe electric potential in a region is represented a v=2x+3y−z. Obtain expression for electric field strength.
View SolutionThe electric potential at any point x,yanz in metres is given by V=3x2. The electric field at a point (2,0,1) is
View SolutionAn electric dipole is placed along x–axis at the origin as shown in the figure. Electric field at the point P is parallel to the y–axis. If x–coordinate of P √2 is m, what is its y–coordinate?
View Solution
