Inverse Relation
What is Inverse Relation?
When two variables are interrelated but at the same, if the change of one causes the opposite change to the other then it is identified as inverse relation. In regression analysis, this is also known as a negative correlation. It means that if there is an increase in one variable, then the other vehicle decreases and vice versa. If we take the situation of the relationship between consumer spending and interest rates, then this can serve to be the best example. When interest rates increase, consumers are less willing to spend and more willing to save. There is also a decrease in consumer spending with the increase in unemployment because of the reason for the less disposable income of the people.
Let’s have a look at an example.
There are many real-life examples of inverse relationships. The speed of travel relative to travel time (the faster one travels from point to point B, the less travel time is required to arrive at point B from point A); savings and disposable income (the less the disposable income, the more the savings); government spending and unemployment rate (the higher the government spending, the lower the unemployment rate) and so on. So, it provides real-life examples in the case of inverse relationships.
The Philips Curve is the most common example of a negative relationship. In fact, when there is an increase in government spending, the unemployment rate decreases because of the creation of more jobs. Following the higher government spending, employees are better compensated, which means that they have more money to spend. On the other hand, during inflation, higher compensation costs are faced by the firms which are passed to consumers through inflation. Hence, the lower the unemployment rate, the higher the inflation.
It should also be noted that the invert relationship is portrayed as a downward sloping curve. The mathematical explanation of inverse relation equation is that if f(x) = x + 2 and y (x) = x -2.
In order to eliminate zero, f(x) = -x and f(x) = 1/x
Opposite of inverse relationship
The opposite of inverse relationship is known as a direct relationship. In this case, if one variable increases, it also leads to increase the other as well. A bigger circumference is seen from a circle with a bigger diameter. So, it proves to be linear when it comes to an inverse relationship
Inverse relation graph
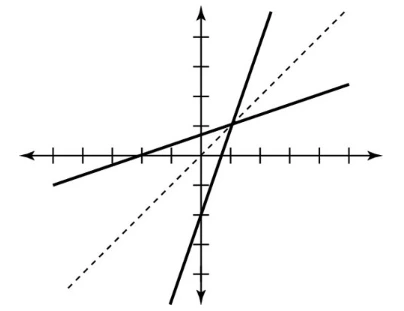
When it comes to finding the inverse relation graph, it is important to make sure of remembering that the line x=y is always reflected by a function and its inverse. This line has a slope of 1 that passes through the origin.
If there is a need to draw a function and its inverse, it can be done with the use of a dotted line. So, by doing so, it acts like a big mirror where the points of the function happen to reflect over the line. This becomes the inverse function points. Reflecting over that line switches the x and the y and gives you a graphical way to find the inverse without plotting tons of points.
The best way to understand this concept is to see it in action. For instance, suppose you know these two functions are inverses of each other:

You need to follow these steps to switch places of x and y
- Take any number and plug into the first given function
For example, if you pick -3 and you evaluate f (-3), you get – 9. So, in this case, it is written as (-3, -9)
- Now from step 1, you need to take the value and then plug into the other function.
In this case, you need to find g(–9). When you do, you get –3 back again. As a point, this is (–9, –3). Whoa!
Now, in order to graph a function and its inverse, all the x and y values in each point need to be switched. So, you can look at all the values that have switched places from the f(x) function to g (x) inverse that reflects over the line y = x

It is now possible to graph the function f(x) = 3x – 2 and it's inverse and that too without even knowing what its inverse is. Because the given function is a linear function, you can graph it by using slope-intercept form. First, graph y = x. The slope-intercept form provides you with the y-intercept at (0, –2). Since the slope is 3=3/1, you move up 3 units and over 1 unit to arrive at the point (1, 1). If you move again up 3 units and over 1 unit, you get the point (2, 4). The inverse function, therefore, moves through (–2, 0), (1, 1), and (4, 2). So, you can see both the function and its inverse.

Similar Questions
Derive the law of demand from the single commodity equilibrium condition ''Marginal utility = Price''.
OR
Derive the inverse relation between price of a good and its demand from the single commodity equilibrium condition 'Marginal utility = Price'.
View SolutionDefination || Domain,Range & Inverse OF Relation
View Solution
Knowledge Check
Rate of transpiration in inversely related to
AHumidityBLightCTemperatureDWater
Inverse function , How to find inverse OF a function , Inverse OF gOF & Important points OF inverse
View SolutionInverse Function |Graph of Inverse Trigonometric Function |Exercise Questions |OMR
View SolutionInverse variation (in mathematical form).
View SolutionInverse Functions
View SolutionInverse variation
View SolutionInverse Function
View SolutionInverse function
View Solution

