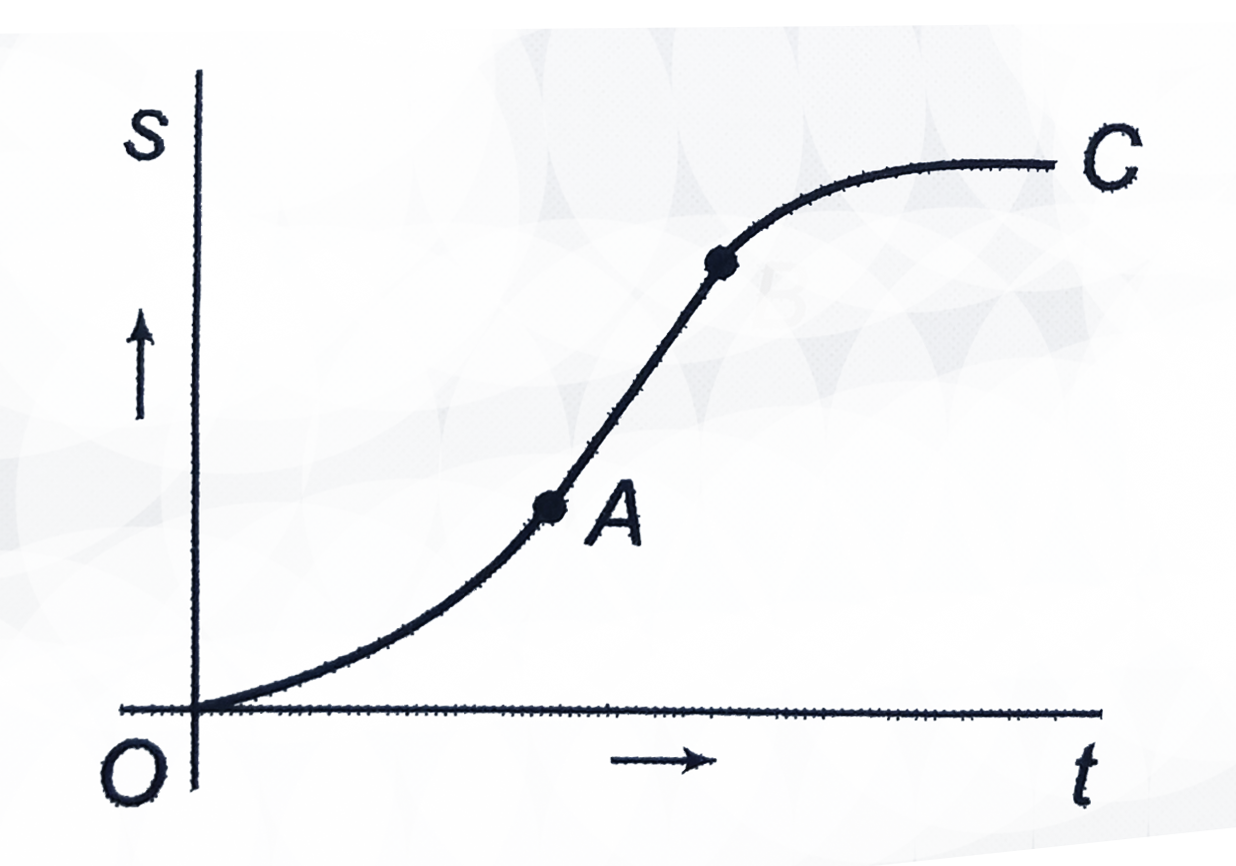
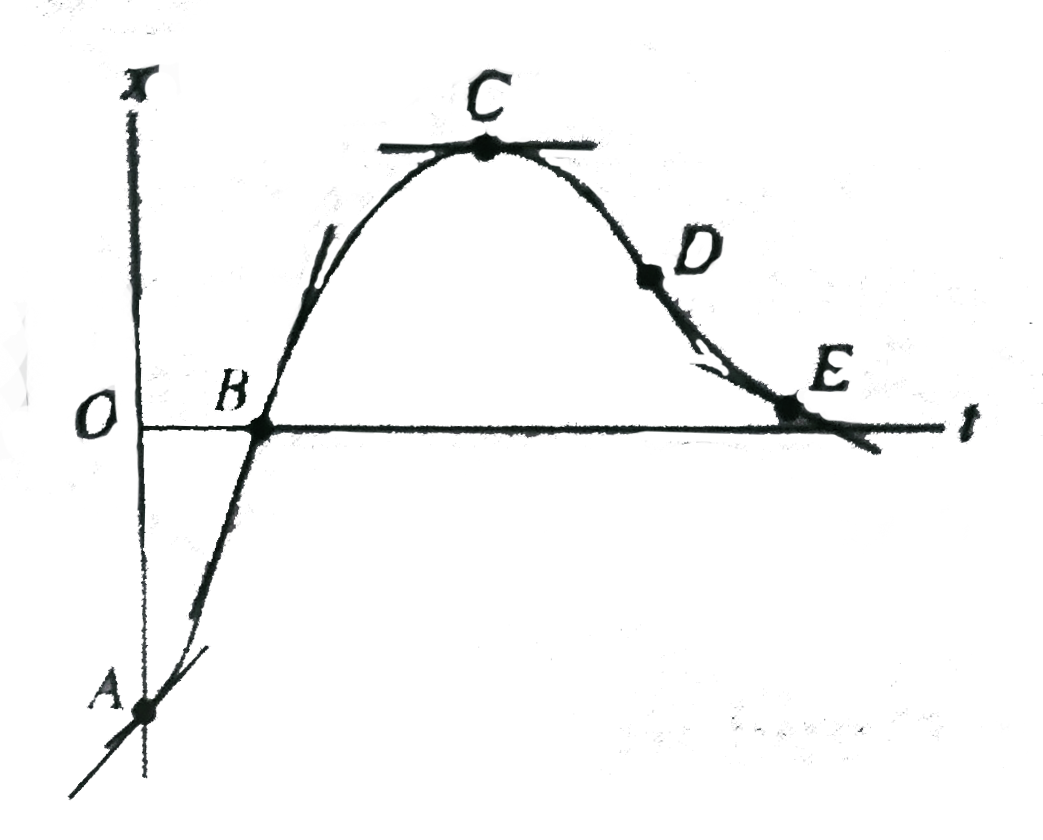
Consider the following st graph. What conclutions can be drawn regarding the velocity of the particle.
Video Solution
Text Solution
O to A: Slope is +ve and increasing, i.e. velocity is +ve and increasing.
A to B: Slope is +ve and constant, i.e. velocity is +ve and constant.
B to C: Slope is +ve and decreasing, i.e. velocity is +ve and decreasing.
|
Topper's Solved these Questions
Similar Questions
Knowledge Check
From the p-T graph want conclusion can be drawn?
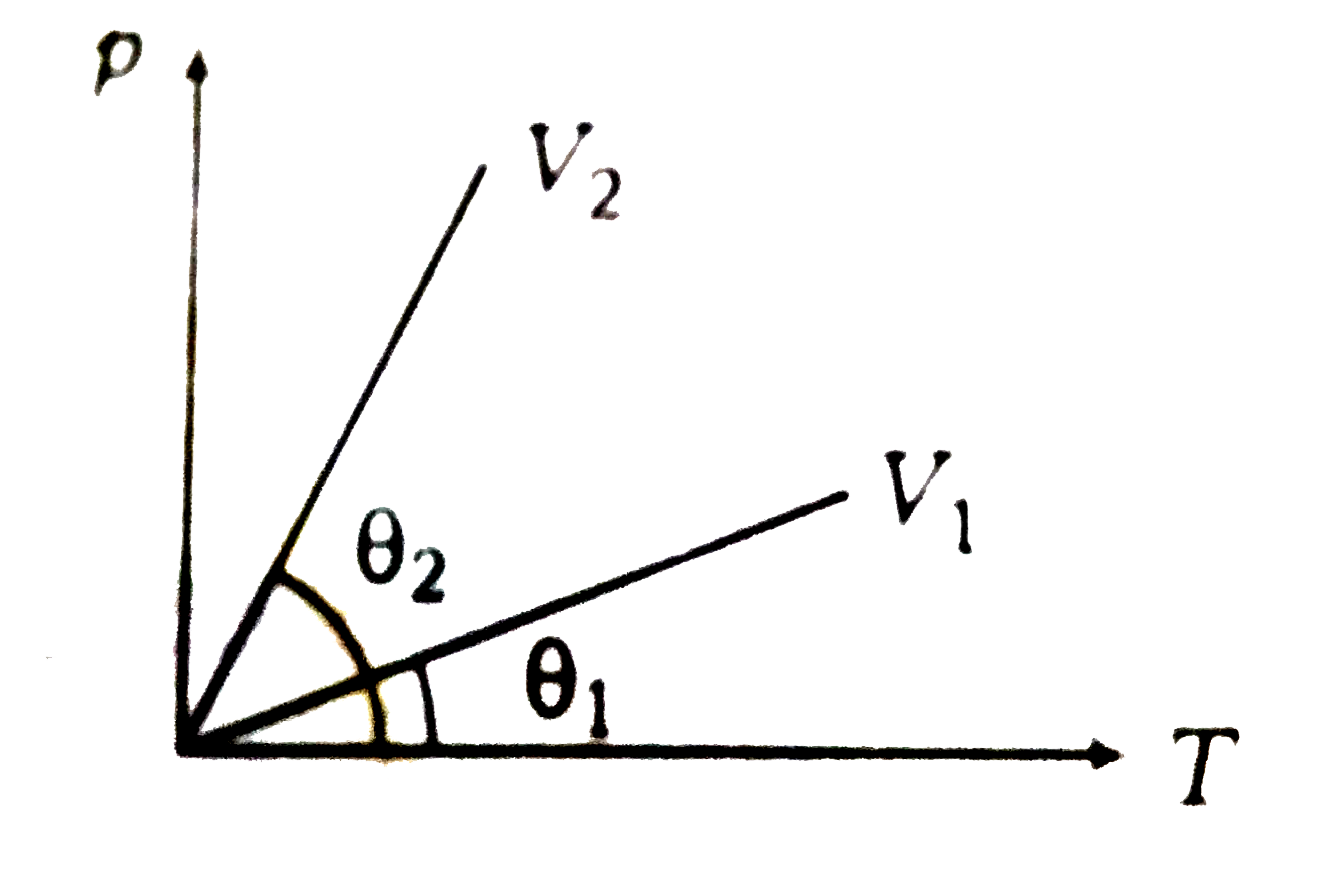 AV2=V1BV2<V1CV2>V1DNone of these
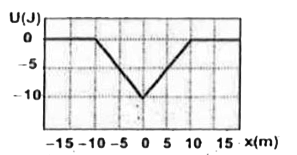
Figure shows a graph of potential energy.
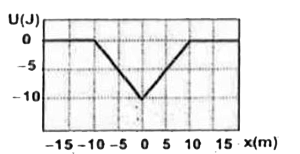
Consider the following graph of position and time , which represents the motion of the certain particle in the given potential. What is the total energy of the particle?
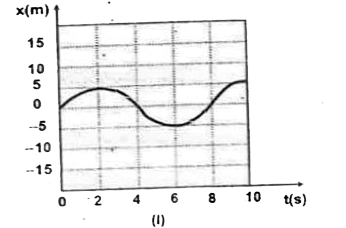 A−5JB0JC5JD10 J
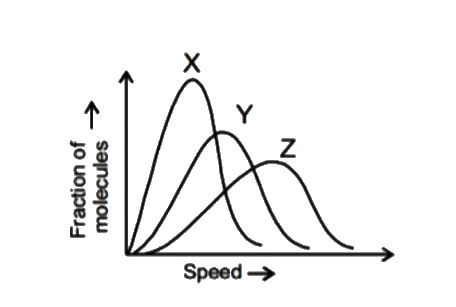
Consider the following graph:
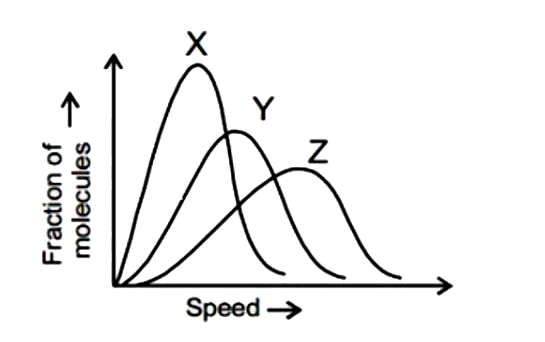
X, Y and Z can be respectively.ANe, Ar and XeBAr, Xe and HeCKr, Ar and NeDAr, He and Ne
Consiedr the following x−t garaph to be parabolic. Draw the velocity-time graph and acceleration-time graph analyze the motion of the particle regarding its velocity and acceleration.
 .
.
View SolutionWhat are the different types of graphs that can be drawn to represent the motion of a particle?
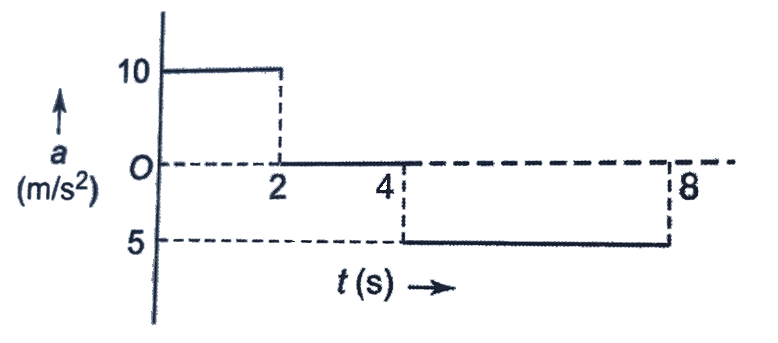
View SolutionConsider the following a-t graph for a particle moving along the x-axis. If the initial velocity is zero, sketch the v-t graph.
View SolutionFigure shows a graph of potential energy.
Consider the following graphs of position and time.
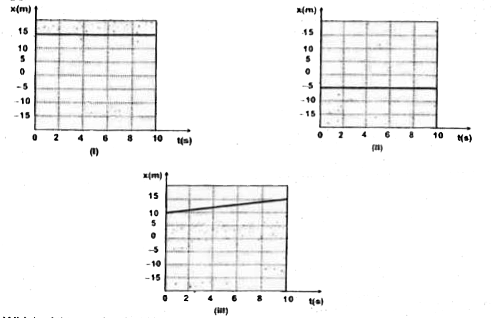
Which of the graphs could be the motion of a particle in the given potential?
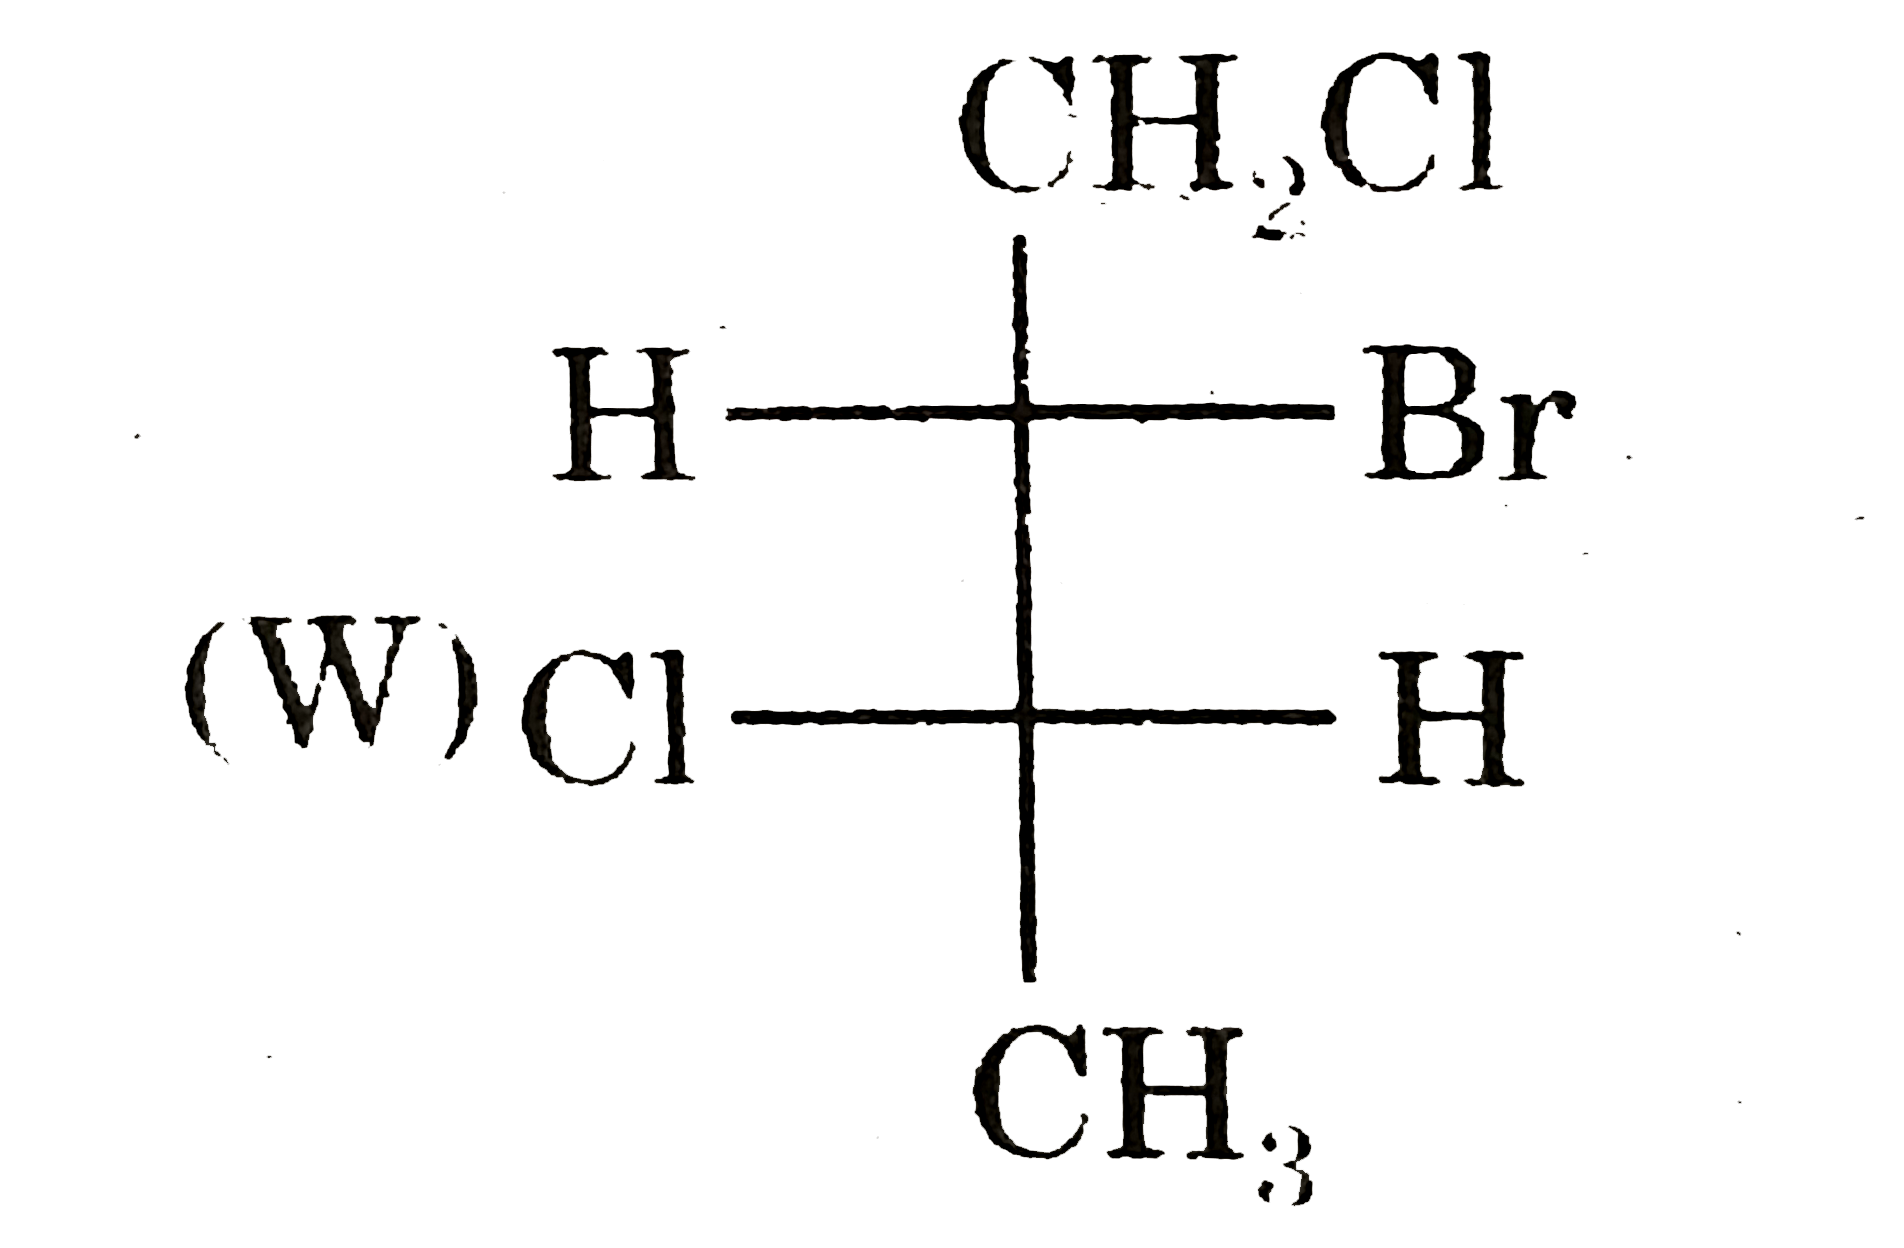
View SolutionConsider the following statements regarding the given projection.


View Solution


