Explain square root function with graph
Square Root Function with Graph
A square root function is a function that has the radical (square root sign) and the independent quantity x is the radicand (value under the square root sign). The square root function in its basic form has the following equation:
f(x)=√x
However, to truly understand the behaviour of a square root function, let's look at the basic linear function:
f(x) = x
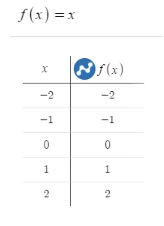
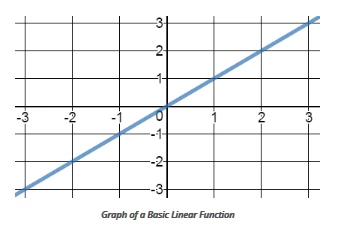
Based on the equation, every y value (the dependent quantity) will be exactly the same as the independent quantity, the x value. In other words, what you choose for x will output the same value for y.
Now, if we changed the equation by taking the square root of the right side, the function would become the basic square root function. You might ask, however, what is taking the square root? When we square a number, we really just multiply it by itself.
22= 2 x 2 = 4
Square root happens to be the inverse operation of squaring a number. In other words, we are trying to find a factor that was multiplied by itself to result in your original value.
Let's look at the square root function now that we have all the basics down!
√4= √2.2 = 2
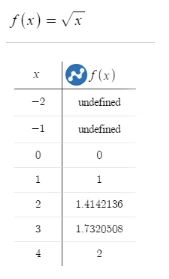
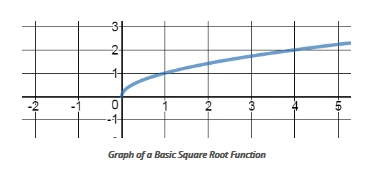
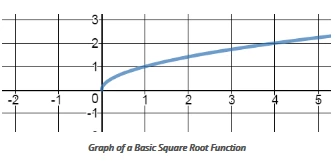
As we expected, the change in the equation resulted in the change of the values in the table and the behaviour of the graph. What we should notice first is the undefined message in the table of values. Depending on the calculator you are using to graph it, you might see an error instead. The undefined value comes from the operation of square rooting a negative number. There is no negative number that can be multiplied by itself and result in a negative number! Only a positive number can be a result of two negatives. Here are a few examples of this operation:
(-2)2 = (-2) x (-2) = 4
(-3)2 = (-3) x (-3) = 9
That is why in the table of values we only see the square root of positive x values which results in the positive y values. When we look at the graph again, we see that distinct beginning point, where it is possible to square root a number, in this case, zero.
Domain and Range of Square Root Function
Domain
Is the set of all x independent values for which the function f(x) exists or is defined.
Range
Is the set of all y dependent values that will result from substituting all x values (domain) into the function.
In a square root function, both domain and range are restricted based on the concept that we can only square root positive numbers.
Let's look at a different example of domain and range using the square root function.
The graph has been shifted and so did the values. Notice how zero is no longer a valid x value for this function.
Graphing Basic Transformations of Square Root Function
Horizontal Translation
The horizontal translation is a shift of the graph and all its values either to the left or right. The change will occur if we add or subtract a number from x under the radical sign.
Horizontal Translation of Square Root Function to the Right
The g(x) has shifted 2 units to the right, not left! Instead of points (0, 0), (1, 1), and (2, 1.41) on the f(x) graph, we have (2, 0), (3, 1) and (4, 1.41) on the g(x) graph. Notice how all the x values were increased by 2, while the Y stayed the same. So essentially, if the number is subtracted from X in the equation, the graph and all the x values, move to the right.
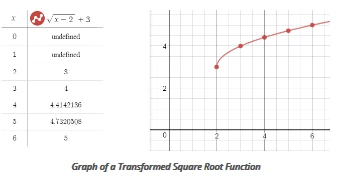
Let's see it in another example:
What can you predict about the behaviour of this square root function? Do you think h(x) will translate 4 units to the left or right?
f(x) = √x-2 + 3
f(0) = √0-2 + 3
f (0) = √-2 + 3
√-2 is undefined
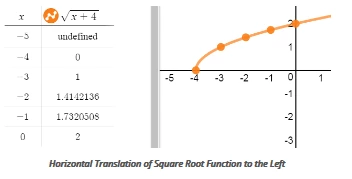
If you said the graph of h(x) will shift 4 units to the left you were correct! This is because the negative number added to the x in the equation caused the graph and all of the x values to shift to the left.
Vertical Translation
Vertical Translation is shifting a graph up or down on the plane of coordinates. The vertical translation occurs when we add or subtract a number outside of the function, in our case, outside of the square root sign.
f (x) = √x
g (x) = √x-2
Let's look at this following change in the equation.
f (x) = √x
c (x) = √x + 4
We did add 4, just like in the g(x) example, but there is a major difference to where we performed that addition. It's no longer under the square root sign, it is outside. In this case, the y values will be affected by this transformation. If using a calculator to compute the vertical translation of 'x', determine the square root, then add the number 4. For example, the square root of 1 is 1, and 1 + 4=5.
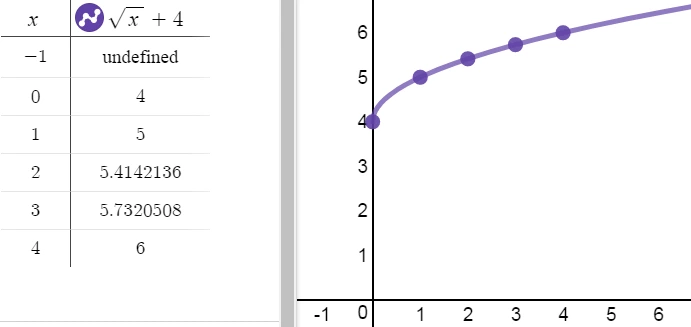
Adding or subtracting a number outside of the square root sign will translate the graph vertically, move all the y values according to the algebraic operation indicated by its value. If we add 4, the graph shifts up, if we subtract 4 from the equation, the graph will translate 4 units down. Logical, right?
f (x) = √x
h (x) = √x+4


Similar Questions
Explain cube root function with graph
View SolutionExplain quadratic expression with graph
View SolutionExplain Reciprocal functions with graph
View SolutionExplain Constant function with graph
View SolutionExplain Exponential function with graph (a^x)
View SolutionExplain Identity function with graph
View SolutionExplain signum function with graph
View SolutionFunction and Graph
View SolutionExplain cubic expression with graph
View SolutionExplain Modulus Function with graph
View Solution
