Ellngham diagram are plotwe of ……… as a function of temprecture
A
ΔrUӨ
B
ΔrHӨ
C
ΔrGӨ
D
ΔrSӨ
Video Solution
Text Solution
The correct Answer is:c
Ellimgham diagram consists of graph which represent the vartion of standerd.Gibts energy change (with temperature) of the formation of oxides of vartion electrons i.e. plots of ΔTGvsT similar point can also be ploted for sulphides and balides how useful point of H.G.T Elligham who first recorgnized how useful point of Gibble energy as a function of temperature were for invesigating the condition under which reads were feasible
|
Topper's Solved these Questions
- GENERAL PRINCIPALS AND ISOLATION OF ELEMENTSBOOK - R SHARMACHAPTER - GENERAL PRINCIPALS AND ISOLATION OF ELEMENTSEXERCISE - Flow up (Test - 5)
6 Videos
- GENERAL PRINCIPALS AND ISOLATION OF ELEMENTSBOOK - R SHARMACHAPTER - GENERAL PRINCIPALS AND ISOLATION OF ELEMENTSEXERCISE - Question bank
33 Videos
- GENERAL PRINCIPALS AND ISOLATION OF ELEMENTSBOOK - R SHARMACHAPTER - GENERAL PRINCIPALS AND ISOLATION OF ELEMENTSEXERCISE - Flow up (Test - 3)
7 Videos
- ELECTROCHEMISTRYBOOK - R SHARMACHAPTER - ELECTROCHEMISTRYEXERCISE - Follow-up Test 11
7 Videos
- NEET PREVIOUS PAPERBOOK - R SHARMACHAPTER - NEET PREVIOUS PAPEREXERCISE - Solved Question
51 Videos
Similar Questions
Knowledge Check

Following diagram performs the logic function of-AAND gateBNAND gateCOR gateDXOR gateFollowing diagram performs the logic function of
 AOR gateBAND gateCXOR gateDNAND gate
Following diagram perfoms the logic function of
 AXOR gateBAND gateCNAND gateDORgate
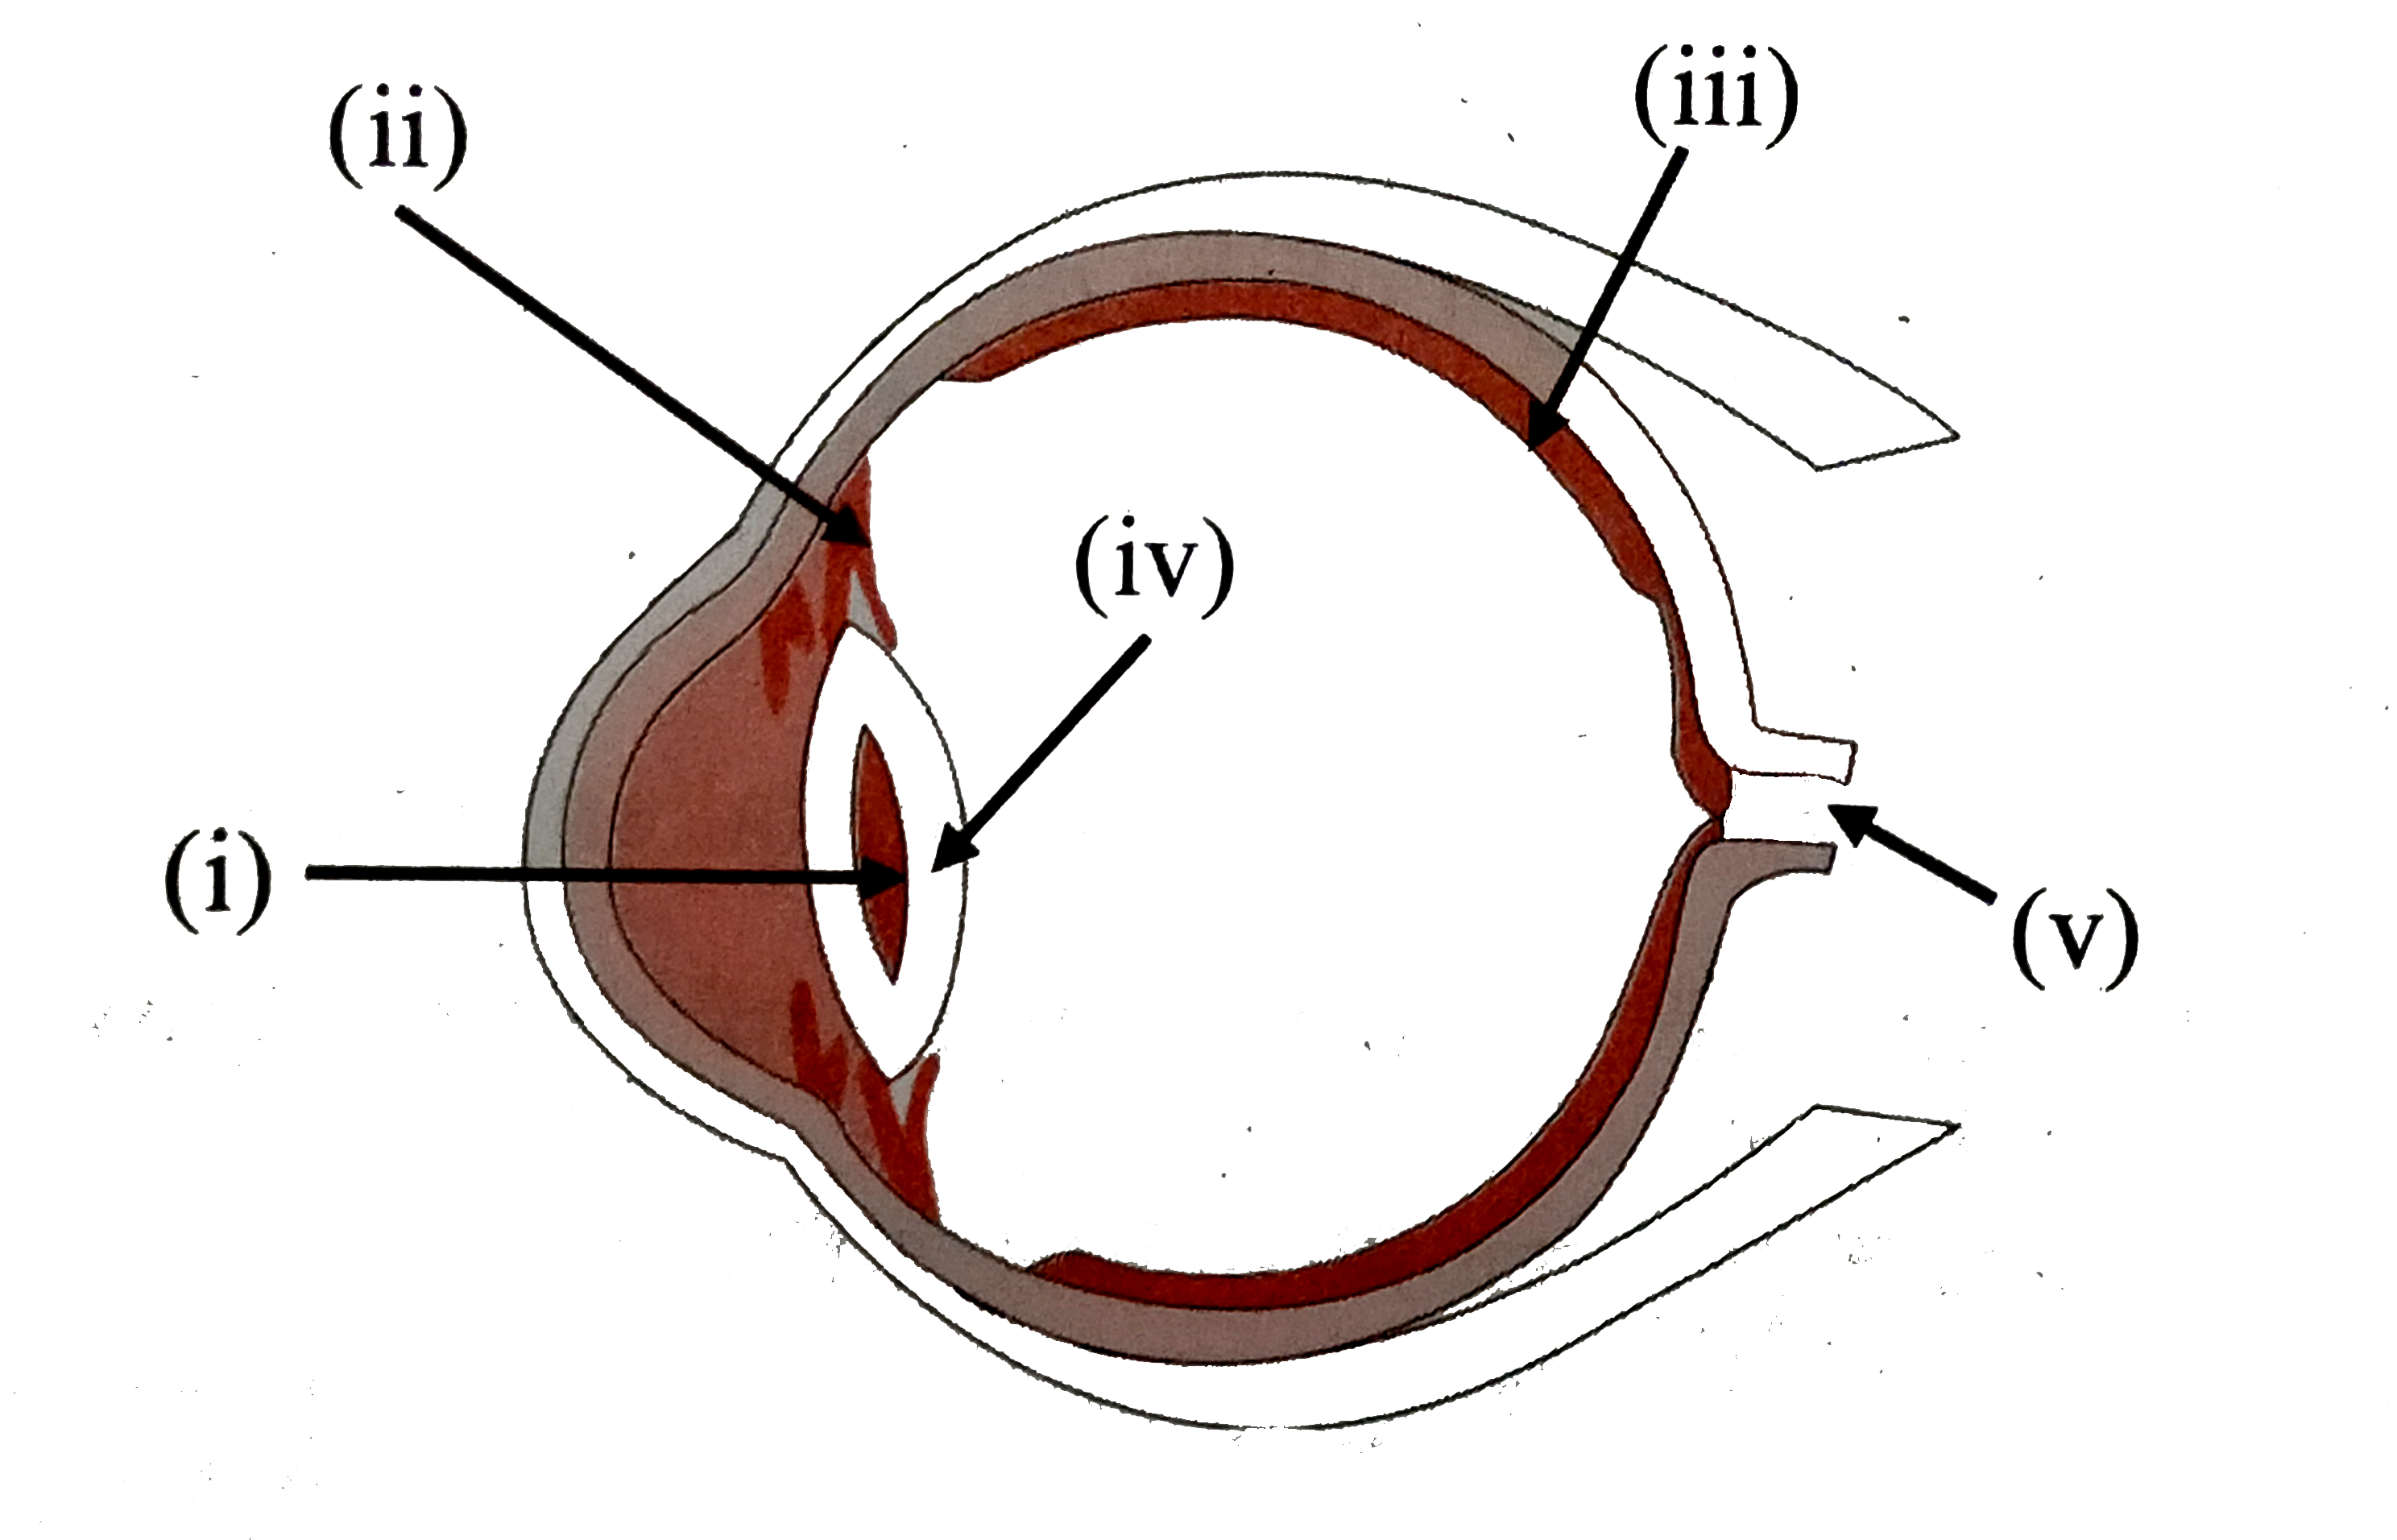
Label the parts of the following diagram of the human eye and state the functions of those parts.
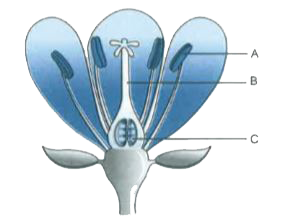
View SolutionName the parts A, B and C shown in the following diagram and state one function of each.
View SolutionWhat is a galvanic cell ? Draw its labelled diagram and explain the function of the salt bridge ?
View SolutionIdentify the diagram and related function
View SolutionThese diagrams represent the potential energy U of a diatomic molecule as a function of the inter-atomic distance r. The diagram corresponds to stable molecule found in nature is.
View Solution

