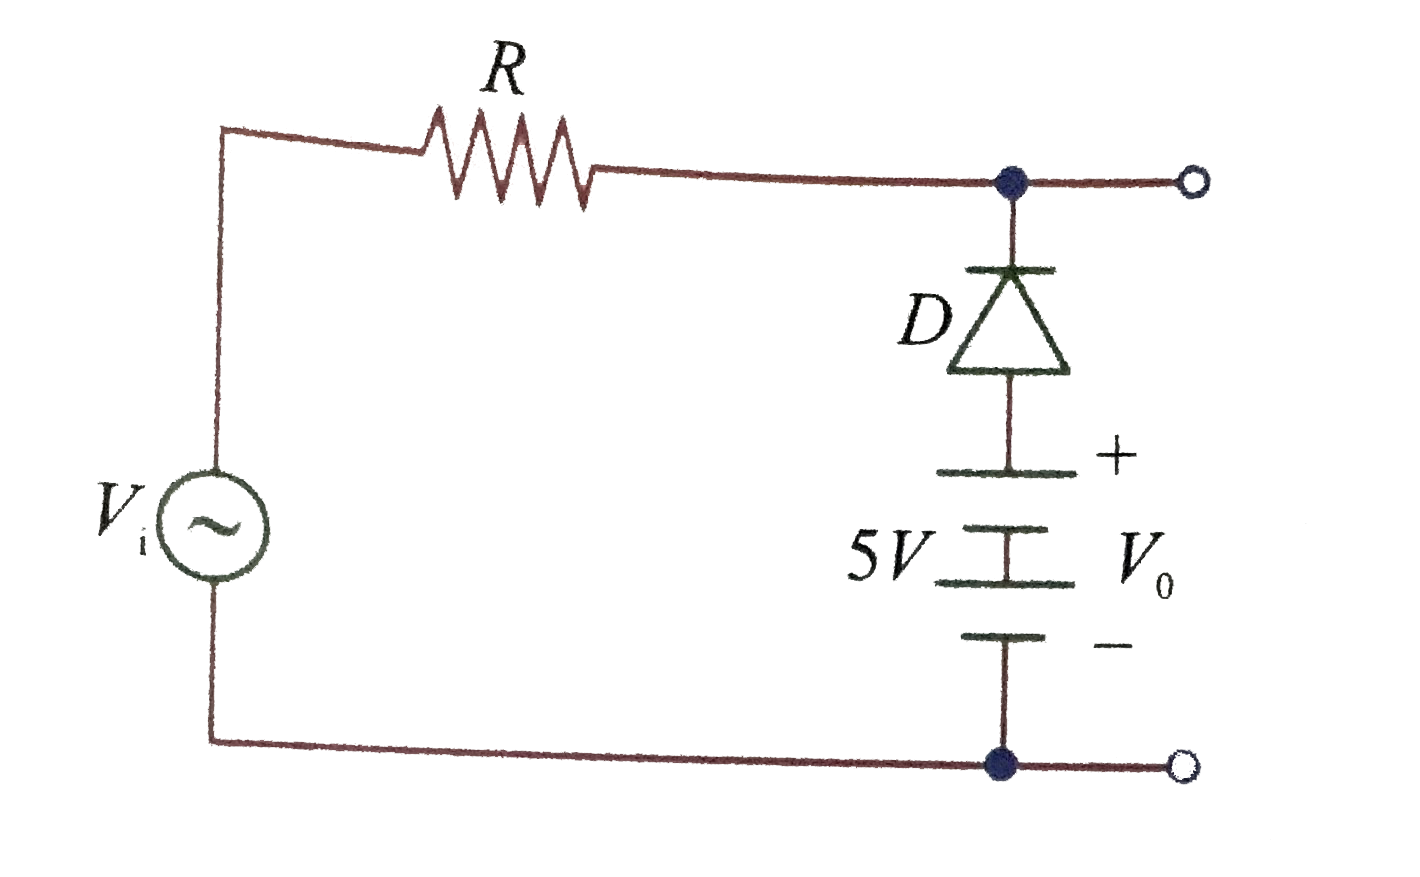
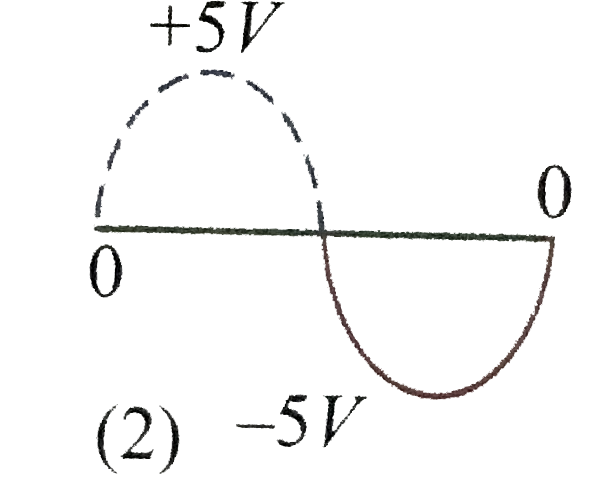
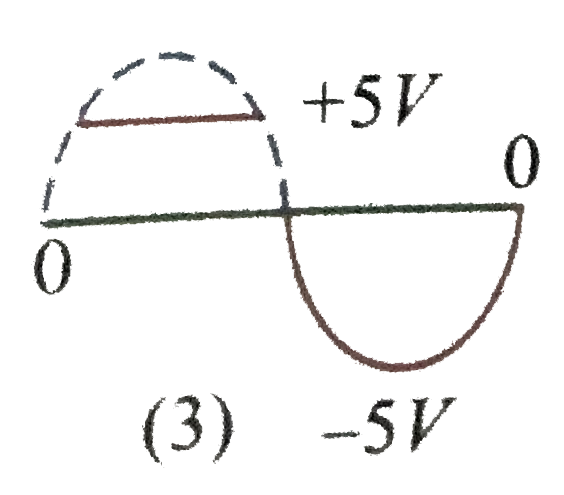
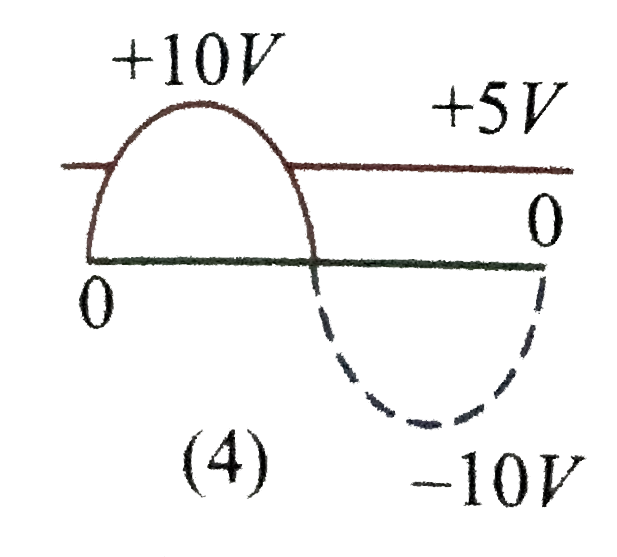
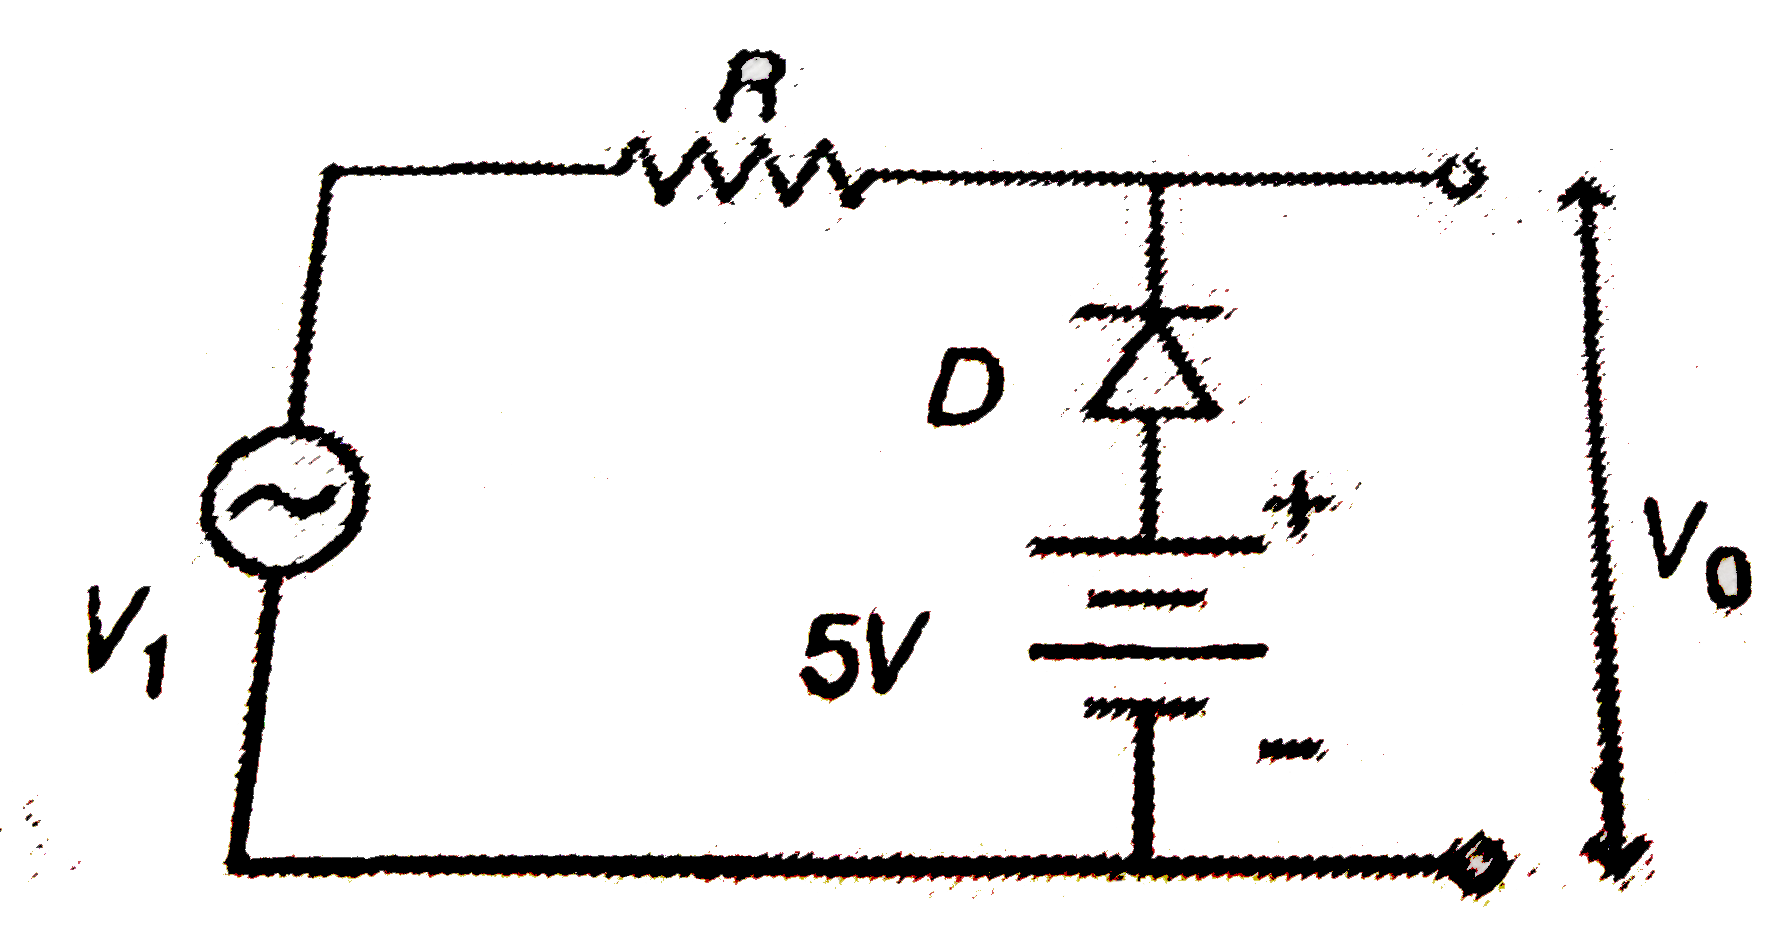
In the diagram D an ideal diode and an alternating voltage of peak value 10V is connected as input V1. Which of the following diagram represents the correct wavelength of output voltage Vθ ?
 .
.
A
B
C
D
Video Solution
Text Solution
The correct Answer is:D
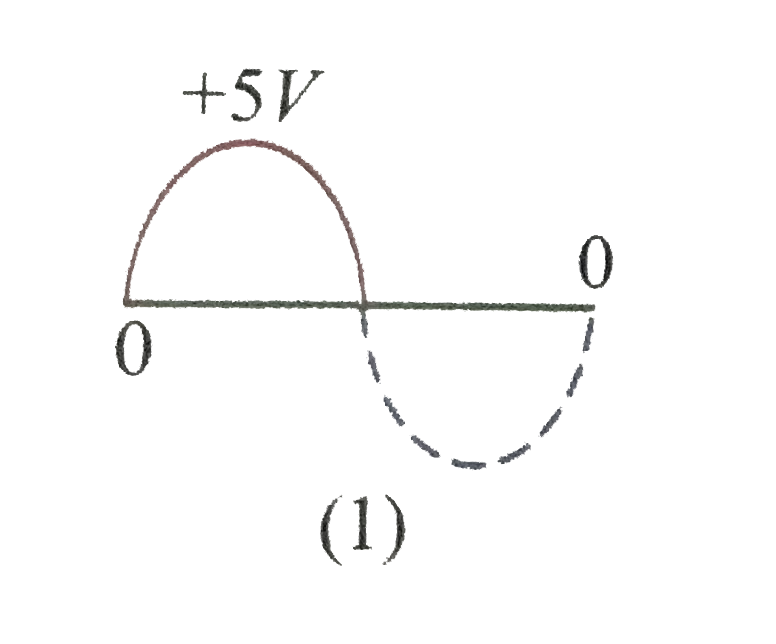
For V1<5V, the diode is forward-biased, output will be fixed at 5V. For V1<5V, the diode is reverse biased. The output will follow V.
|
Topper's Solved these Questions
- SEMI CONDUCTOR DEVICESBook:NARAYNAChapter:SEMI CONDUCTOR DEVICESExercise:NCERT (Comprehension)
Explore 13 Videos
- SEMI CONDUCTOR DEVICESBook:NARAYNAChapter:SEMI CONDUCTOR DEVICESExercise:Level-I (H.W)
Explore 26 Videos
- SEMI CONDUCTOR DEVICESBook:NARAYNAChapter:SEMI CONDUCTOR DEVICESExercise:Level-II (C.W)
Explore 33 Videos
- RAY OPTICS AND OPTICAL INSTRAUMENTS Book:NARAYNAChapter:RAY OPTICS AND OPTICAL INSTRAUMENTS Exercise:EXERCISE- 4 One or more than one correct answer type
Explore 13 Videos
- SEMICONDUCTOR ELECTRONICSBook:NARAYNAChapter:SEMICONDUCTOR ELECTRONICSExercise:ADDITIONAL EXERCISE (ASSERTION AND REASON TYPE QUESTIONS :)
Explore 19 Videos
Similar Questions
Knowledge Check
In the figure, D is an ideal diode and an alternating voltage of peak value 10 volts si connected as input V1. Which of the following figures represents the correct waveform of output voltage V0 ?
 A
A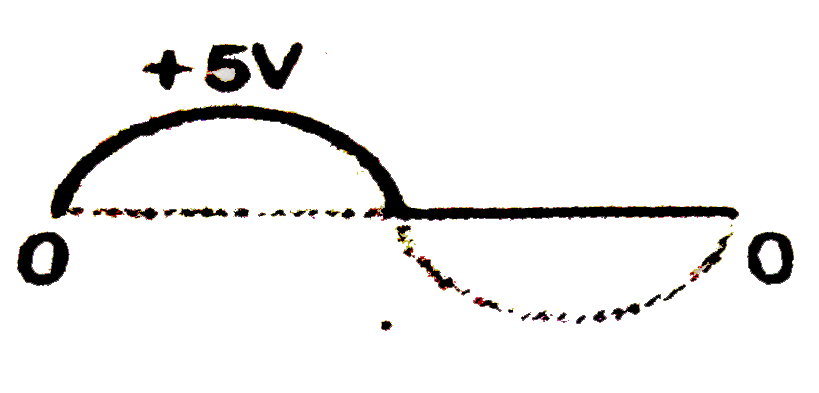 B
B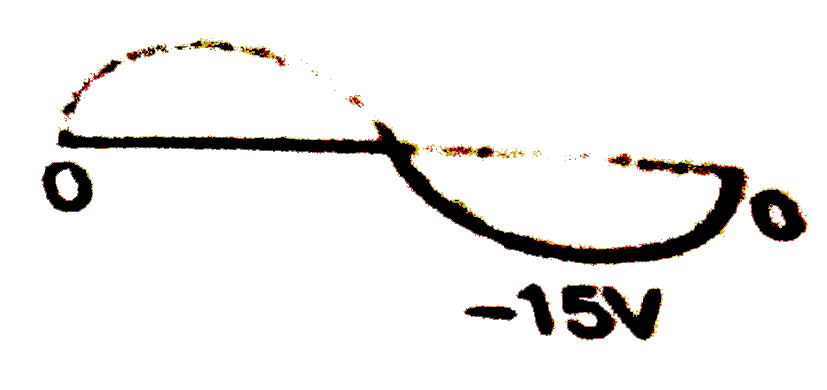 C
C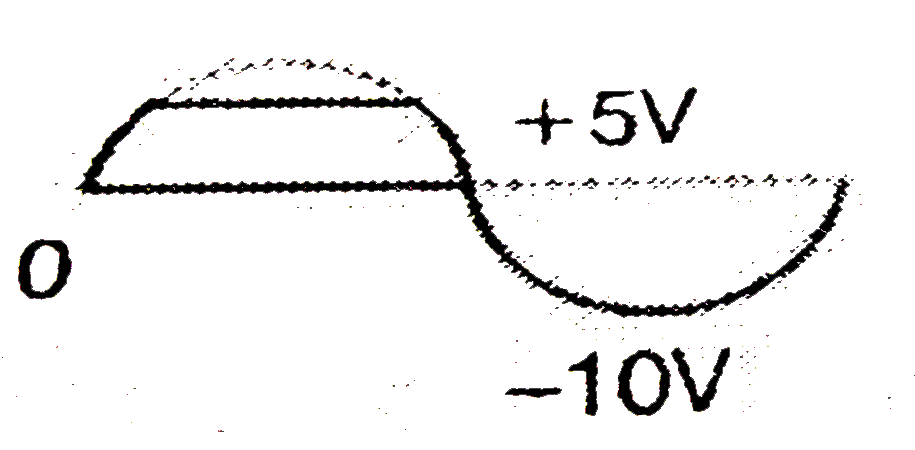 D
D
Rms value of the saw-tooth voltage of peak value V0 as shown in-
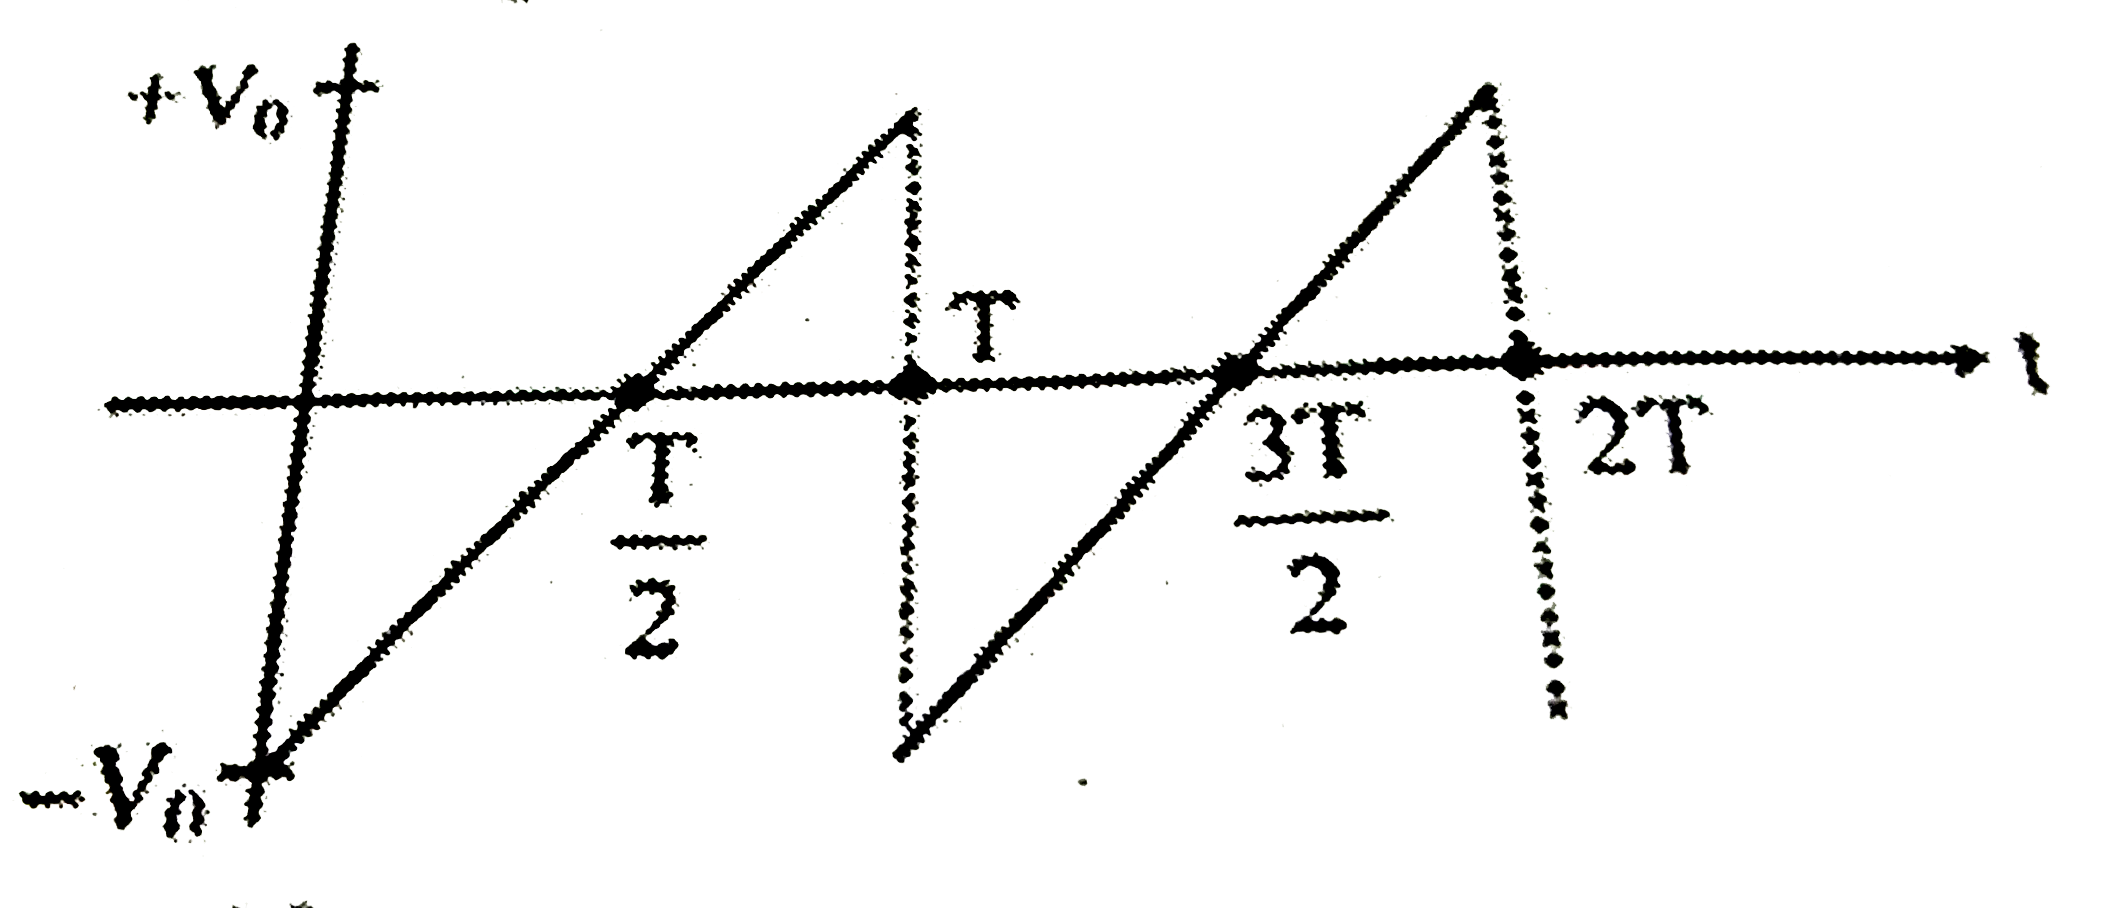 AV02BV0√2CV03DV0√3
The P-V diagram for an ideal gas is shown in figure.
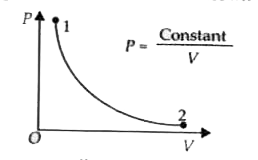
Out of the following diagrams which one represents the T-P diagram ?A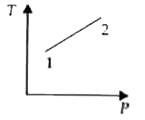 B
B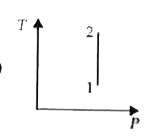 C
C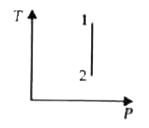 D
D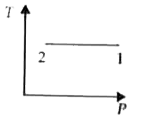
If an alternating voltage is represented as v = 300 sin 600 t then the arms value of the voltage and the frequency are respectively :
View SolutionThe peak value of alternating voltage is 423 V. its root mean square value is
View SolutionAlternating voltage (V) is represented by the equation
whrere Vm is the peak voltage
View Solutionwhat is the output signal voltage (peak value) if dc supply voltage is 5 V?
View SolutionA coil of inductance 5.0mH and negligible resistance is connected to an oscillator giving an output voltage E=(10V)sinωt.Which of the following is correct
View Solution


