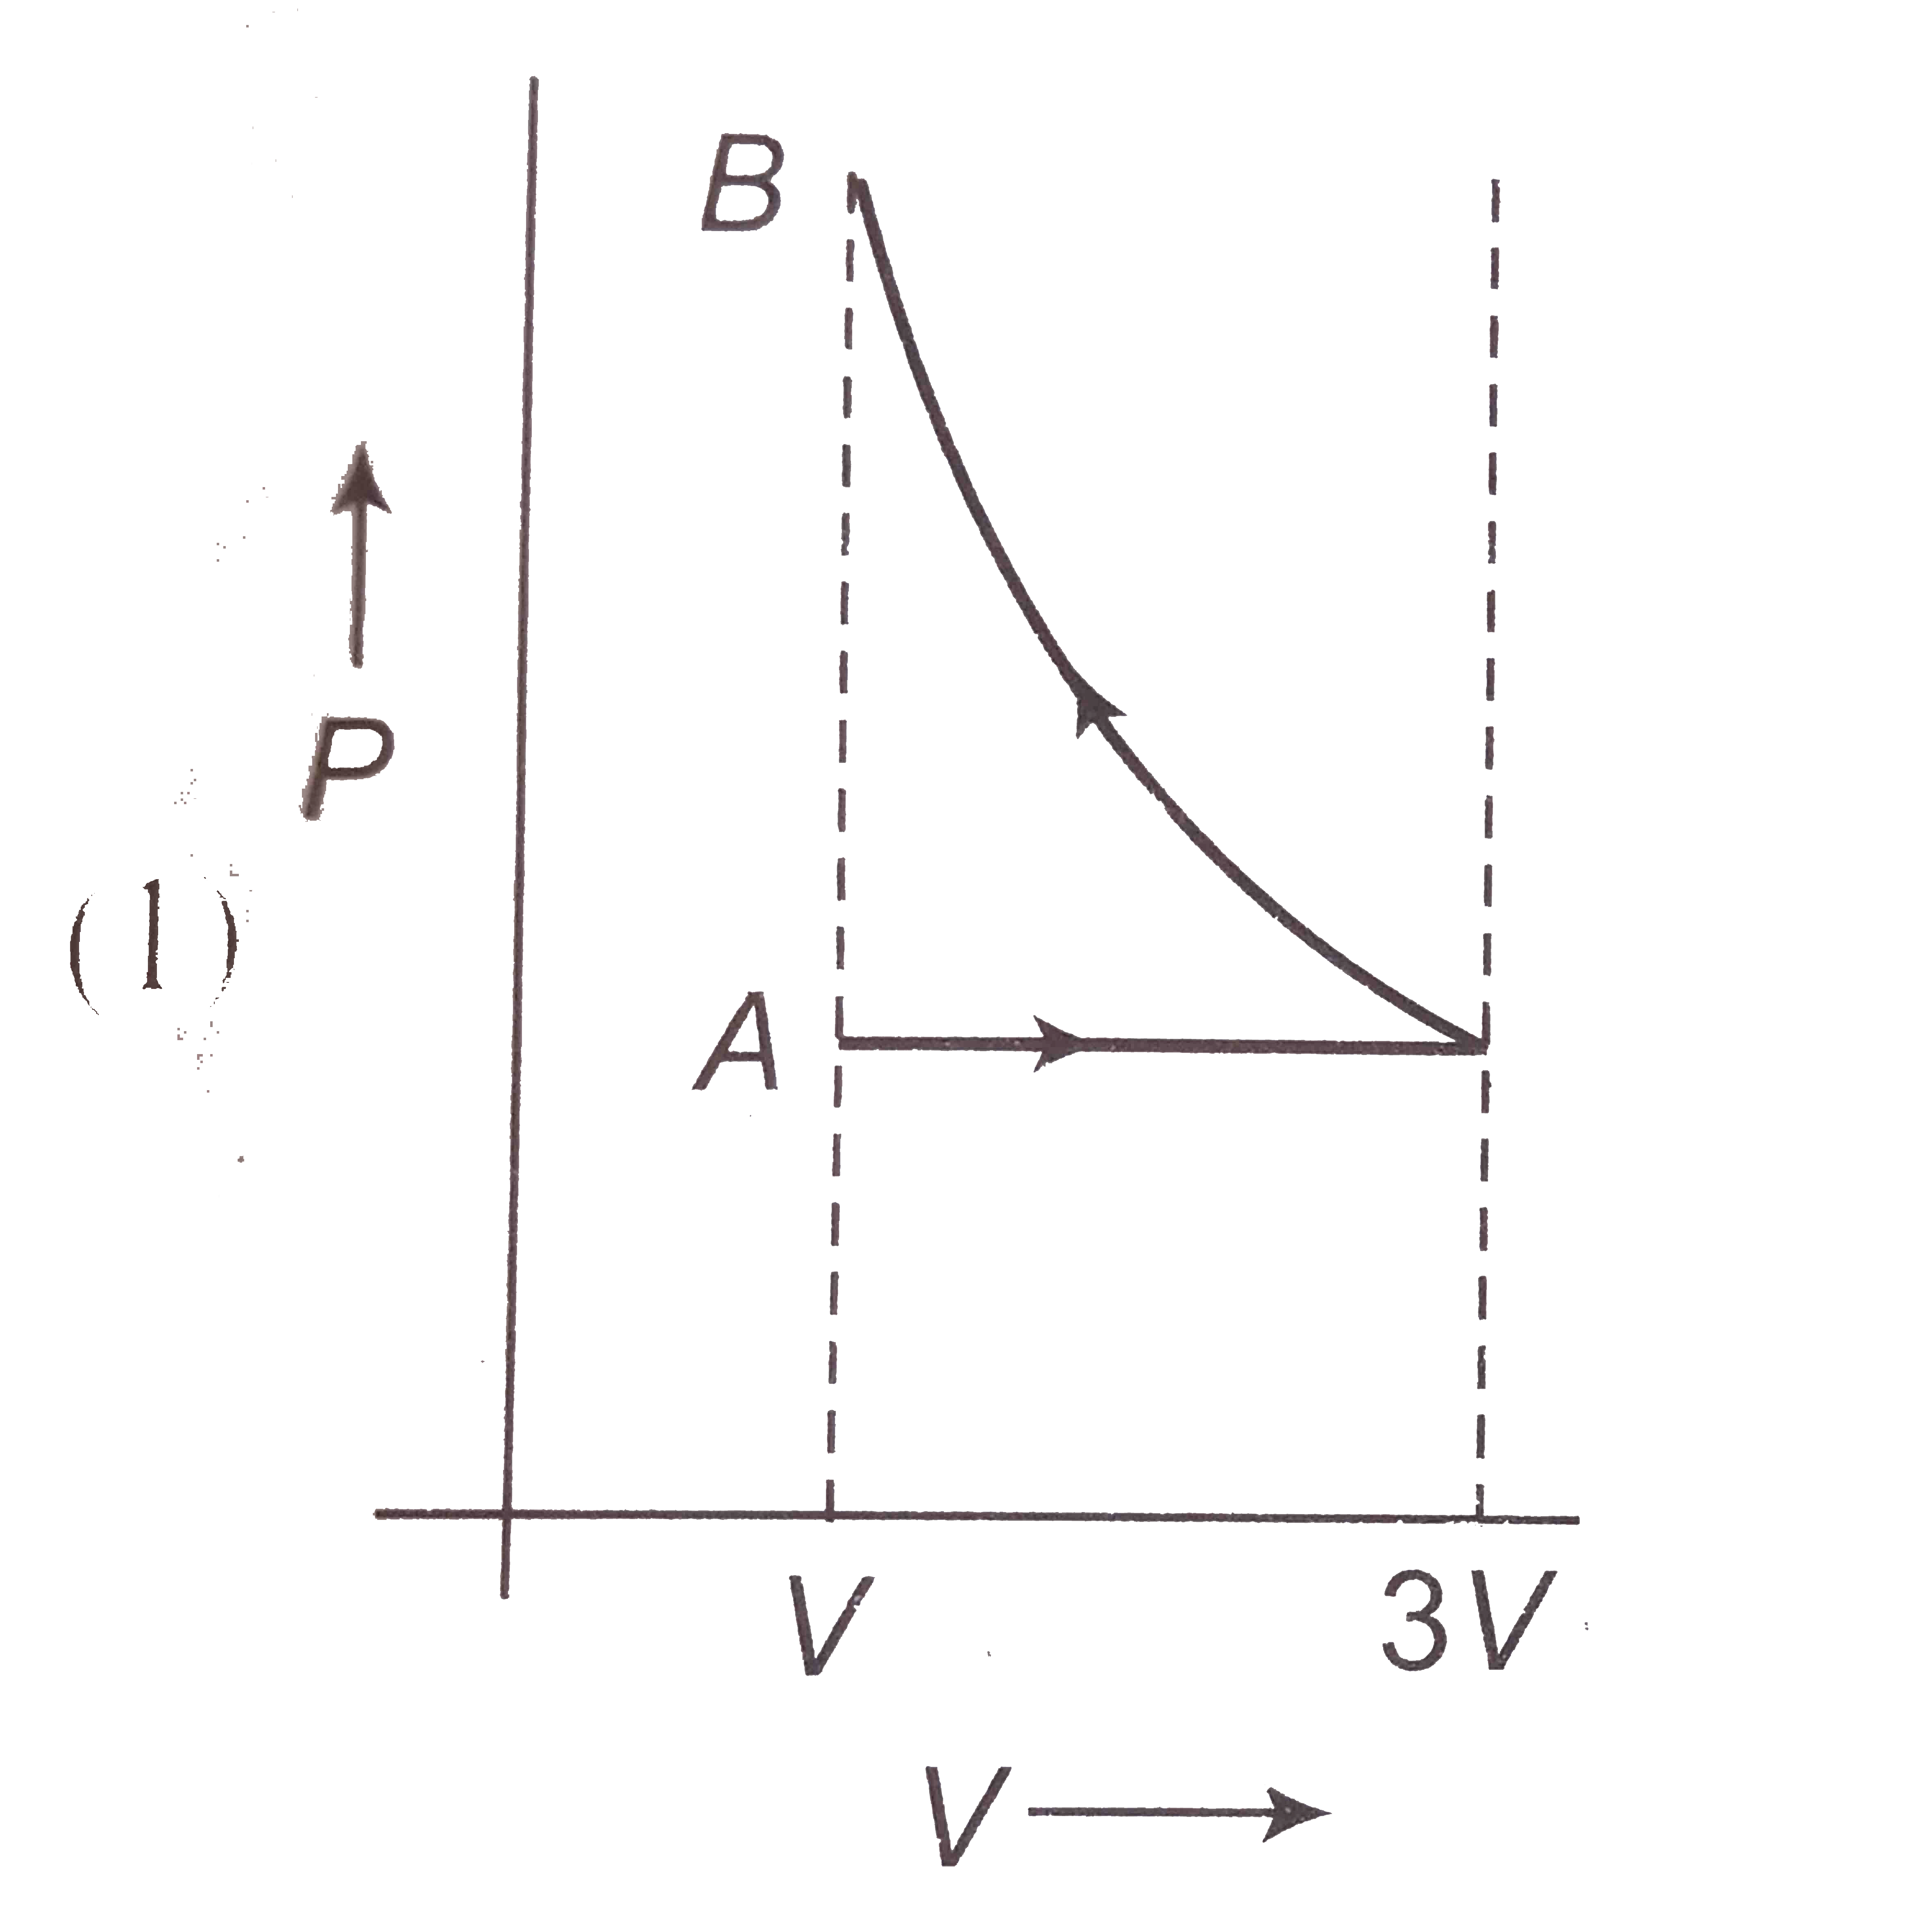
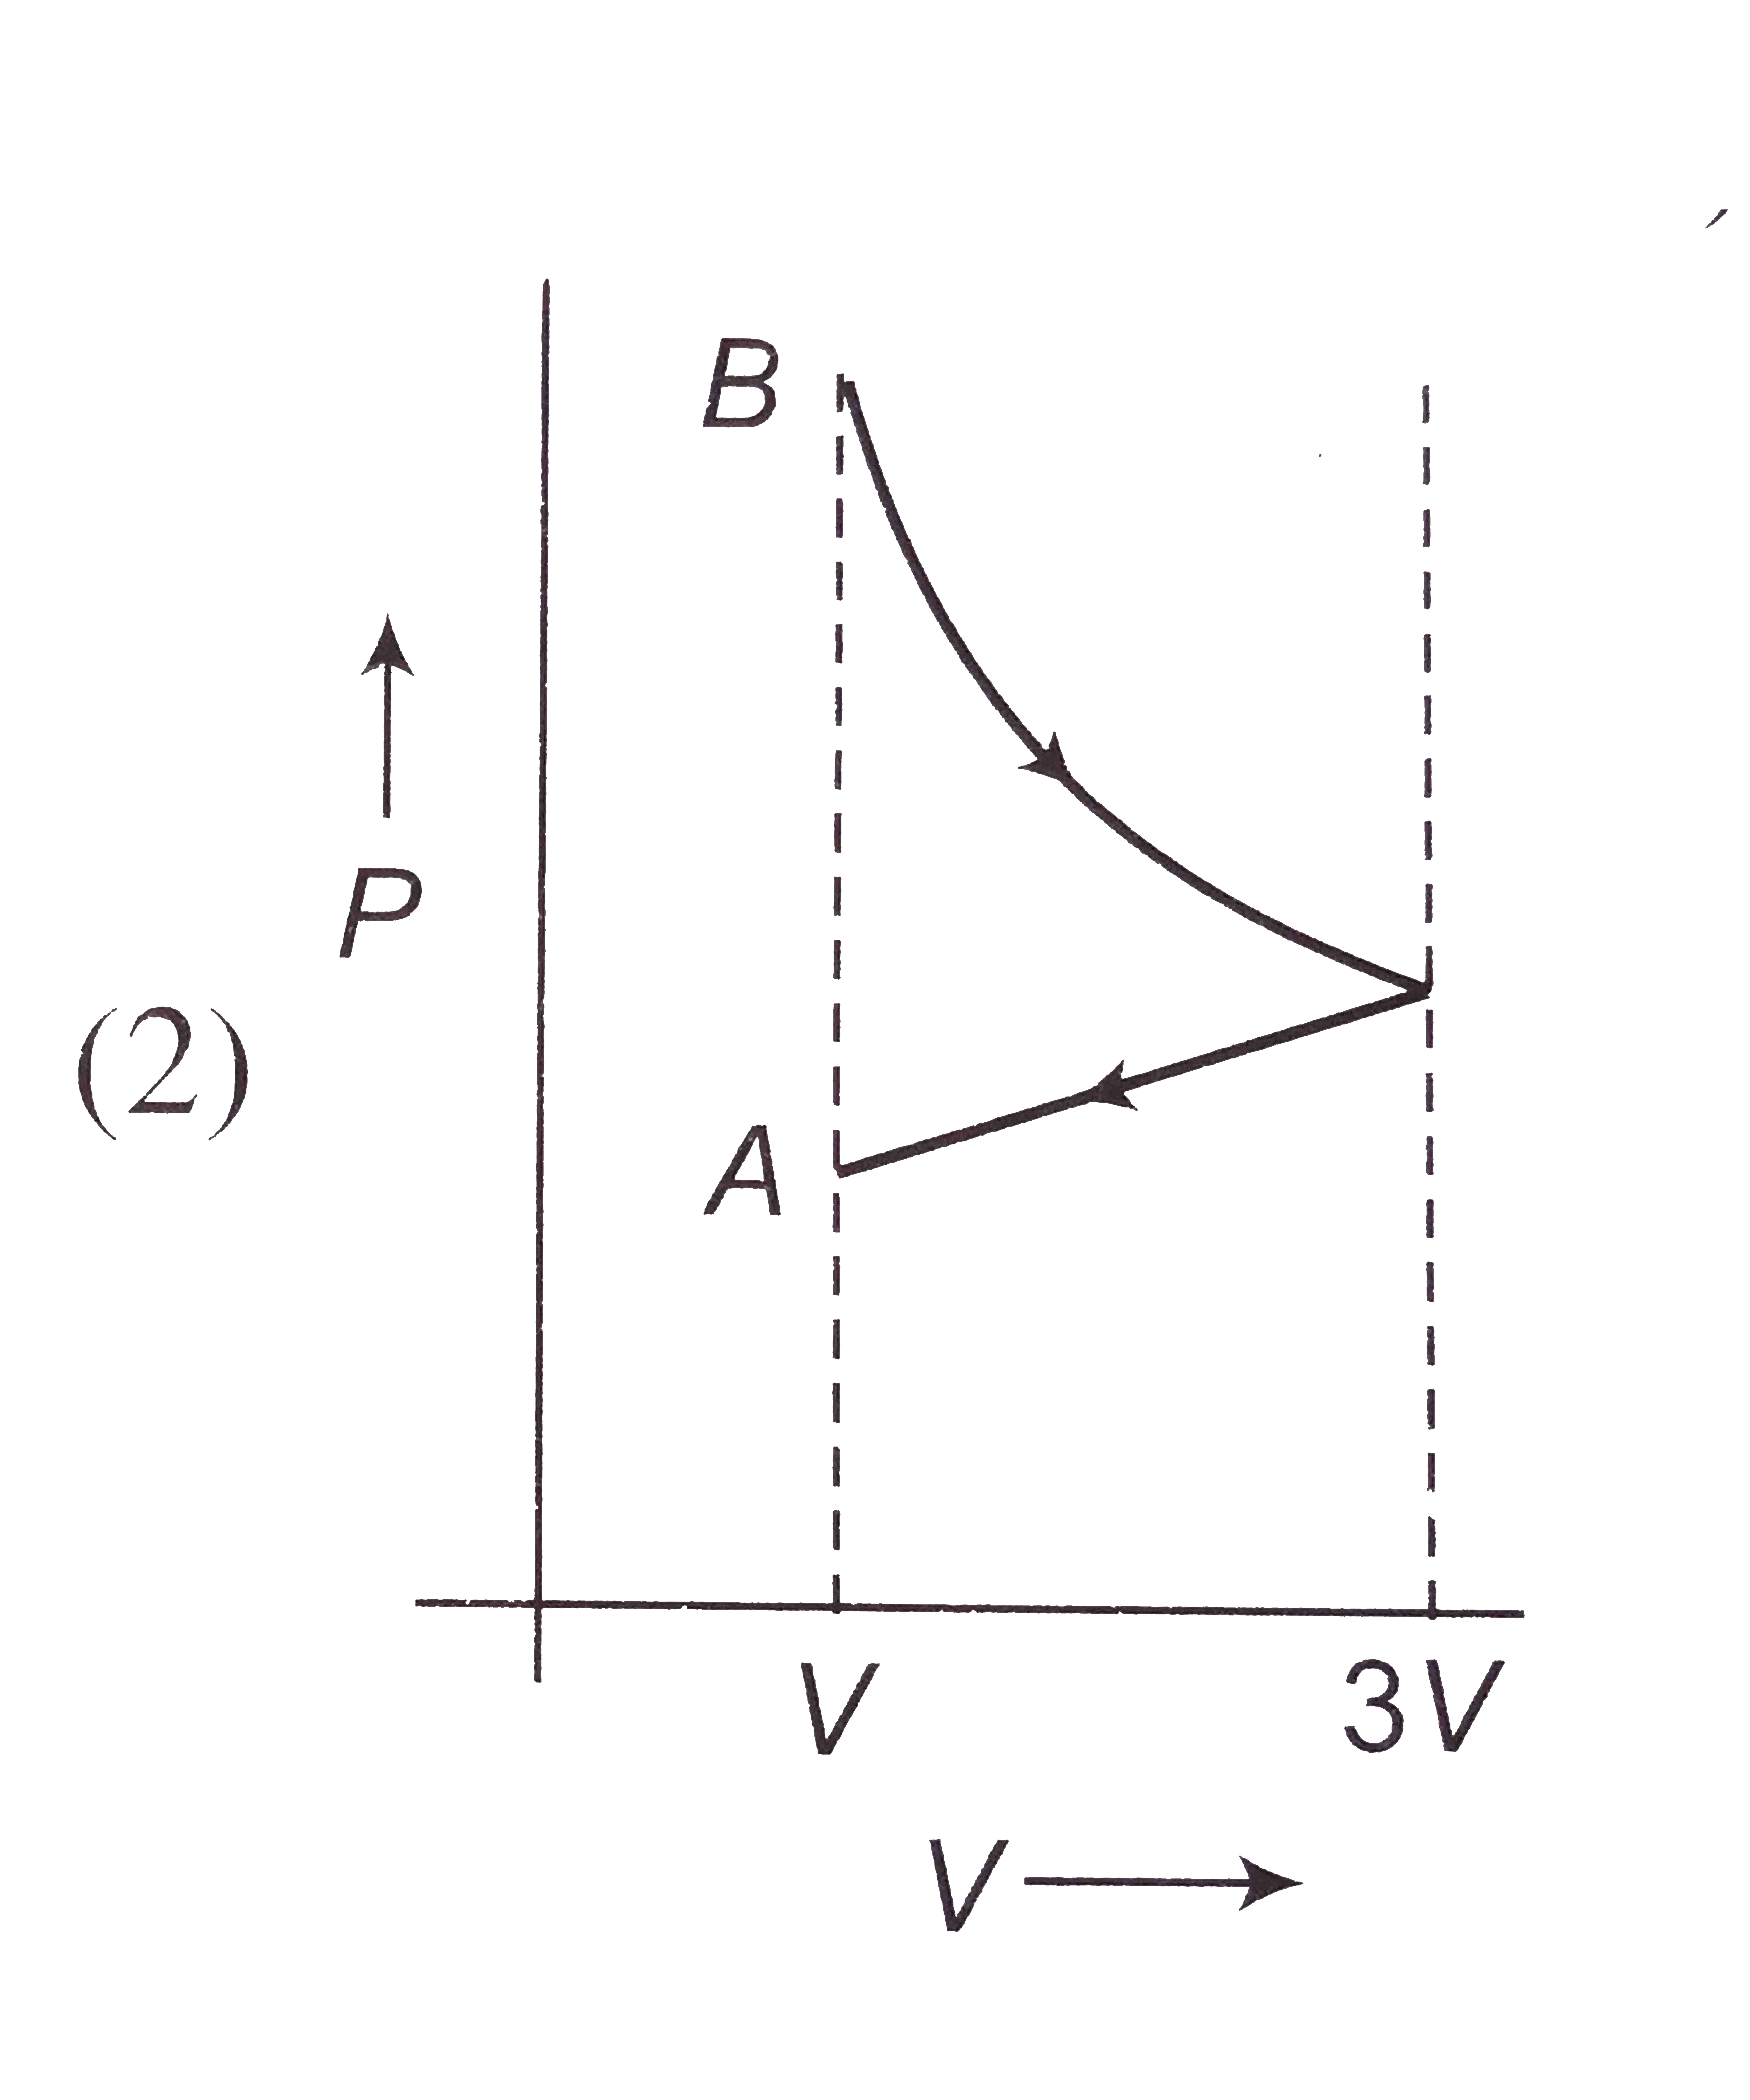
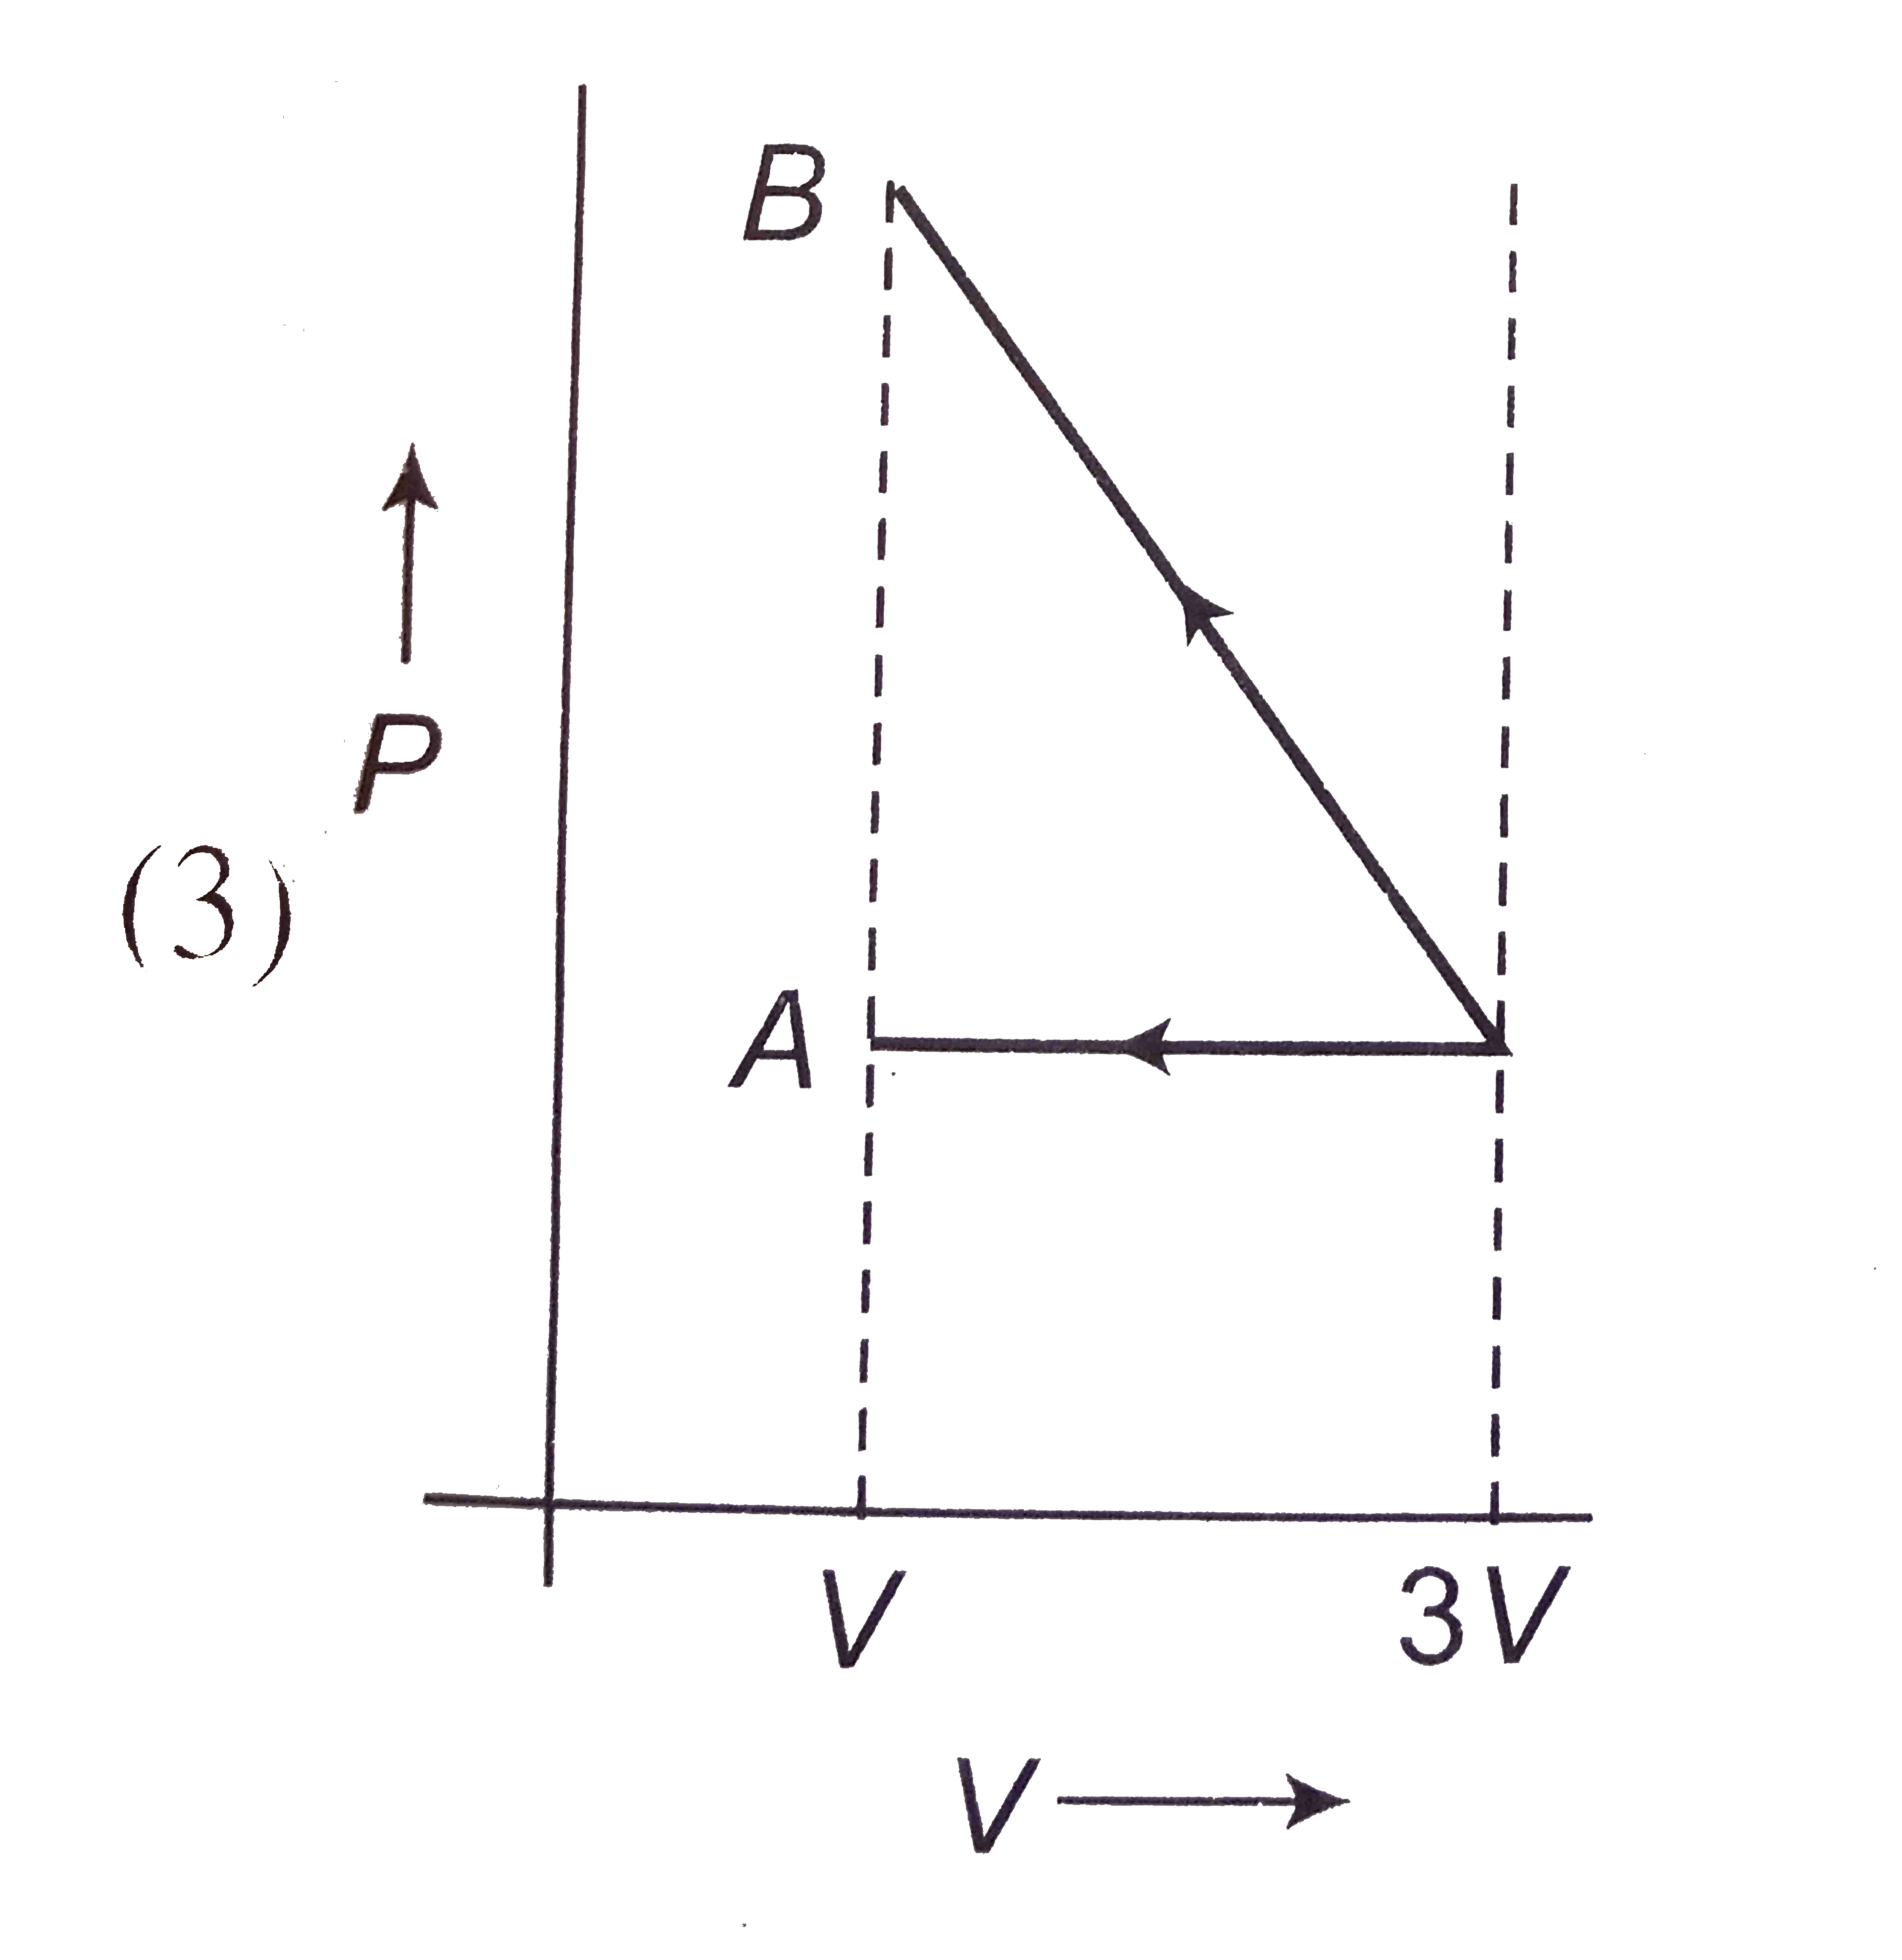
One mole of an ideal gas goes from an initial state A to final state B via two processs : It first undergoes isothermal expansion from volume V to 3V and then its volume is reduced from 3V to V at constant pressure. The correct P−V diagram representing the two process in (figure)
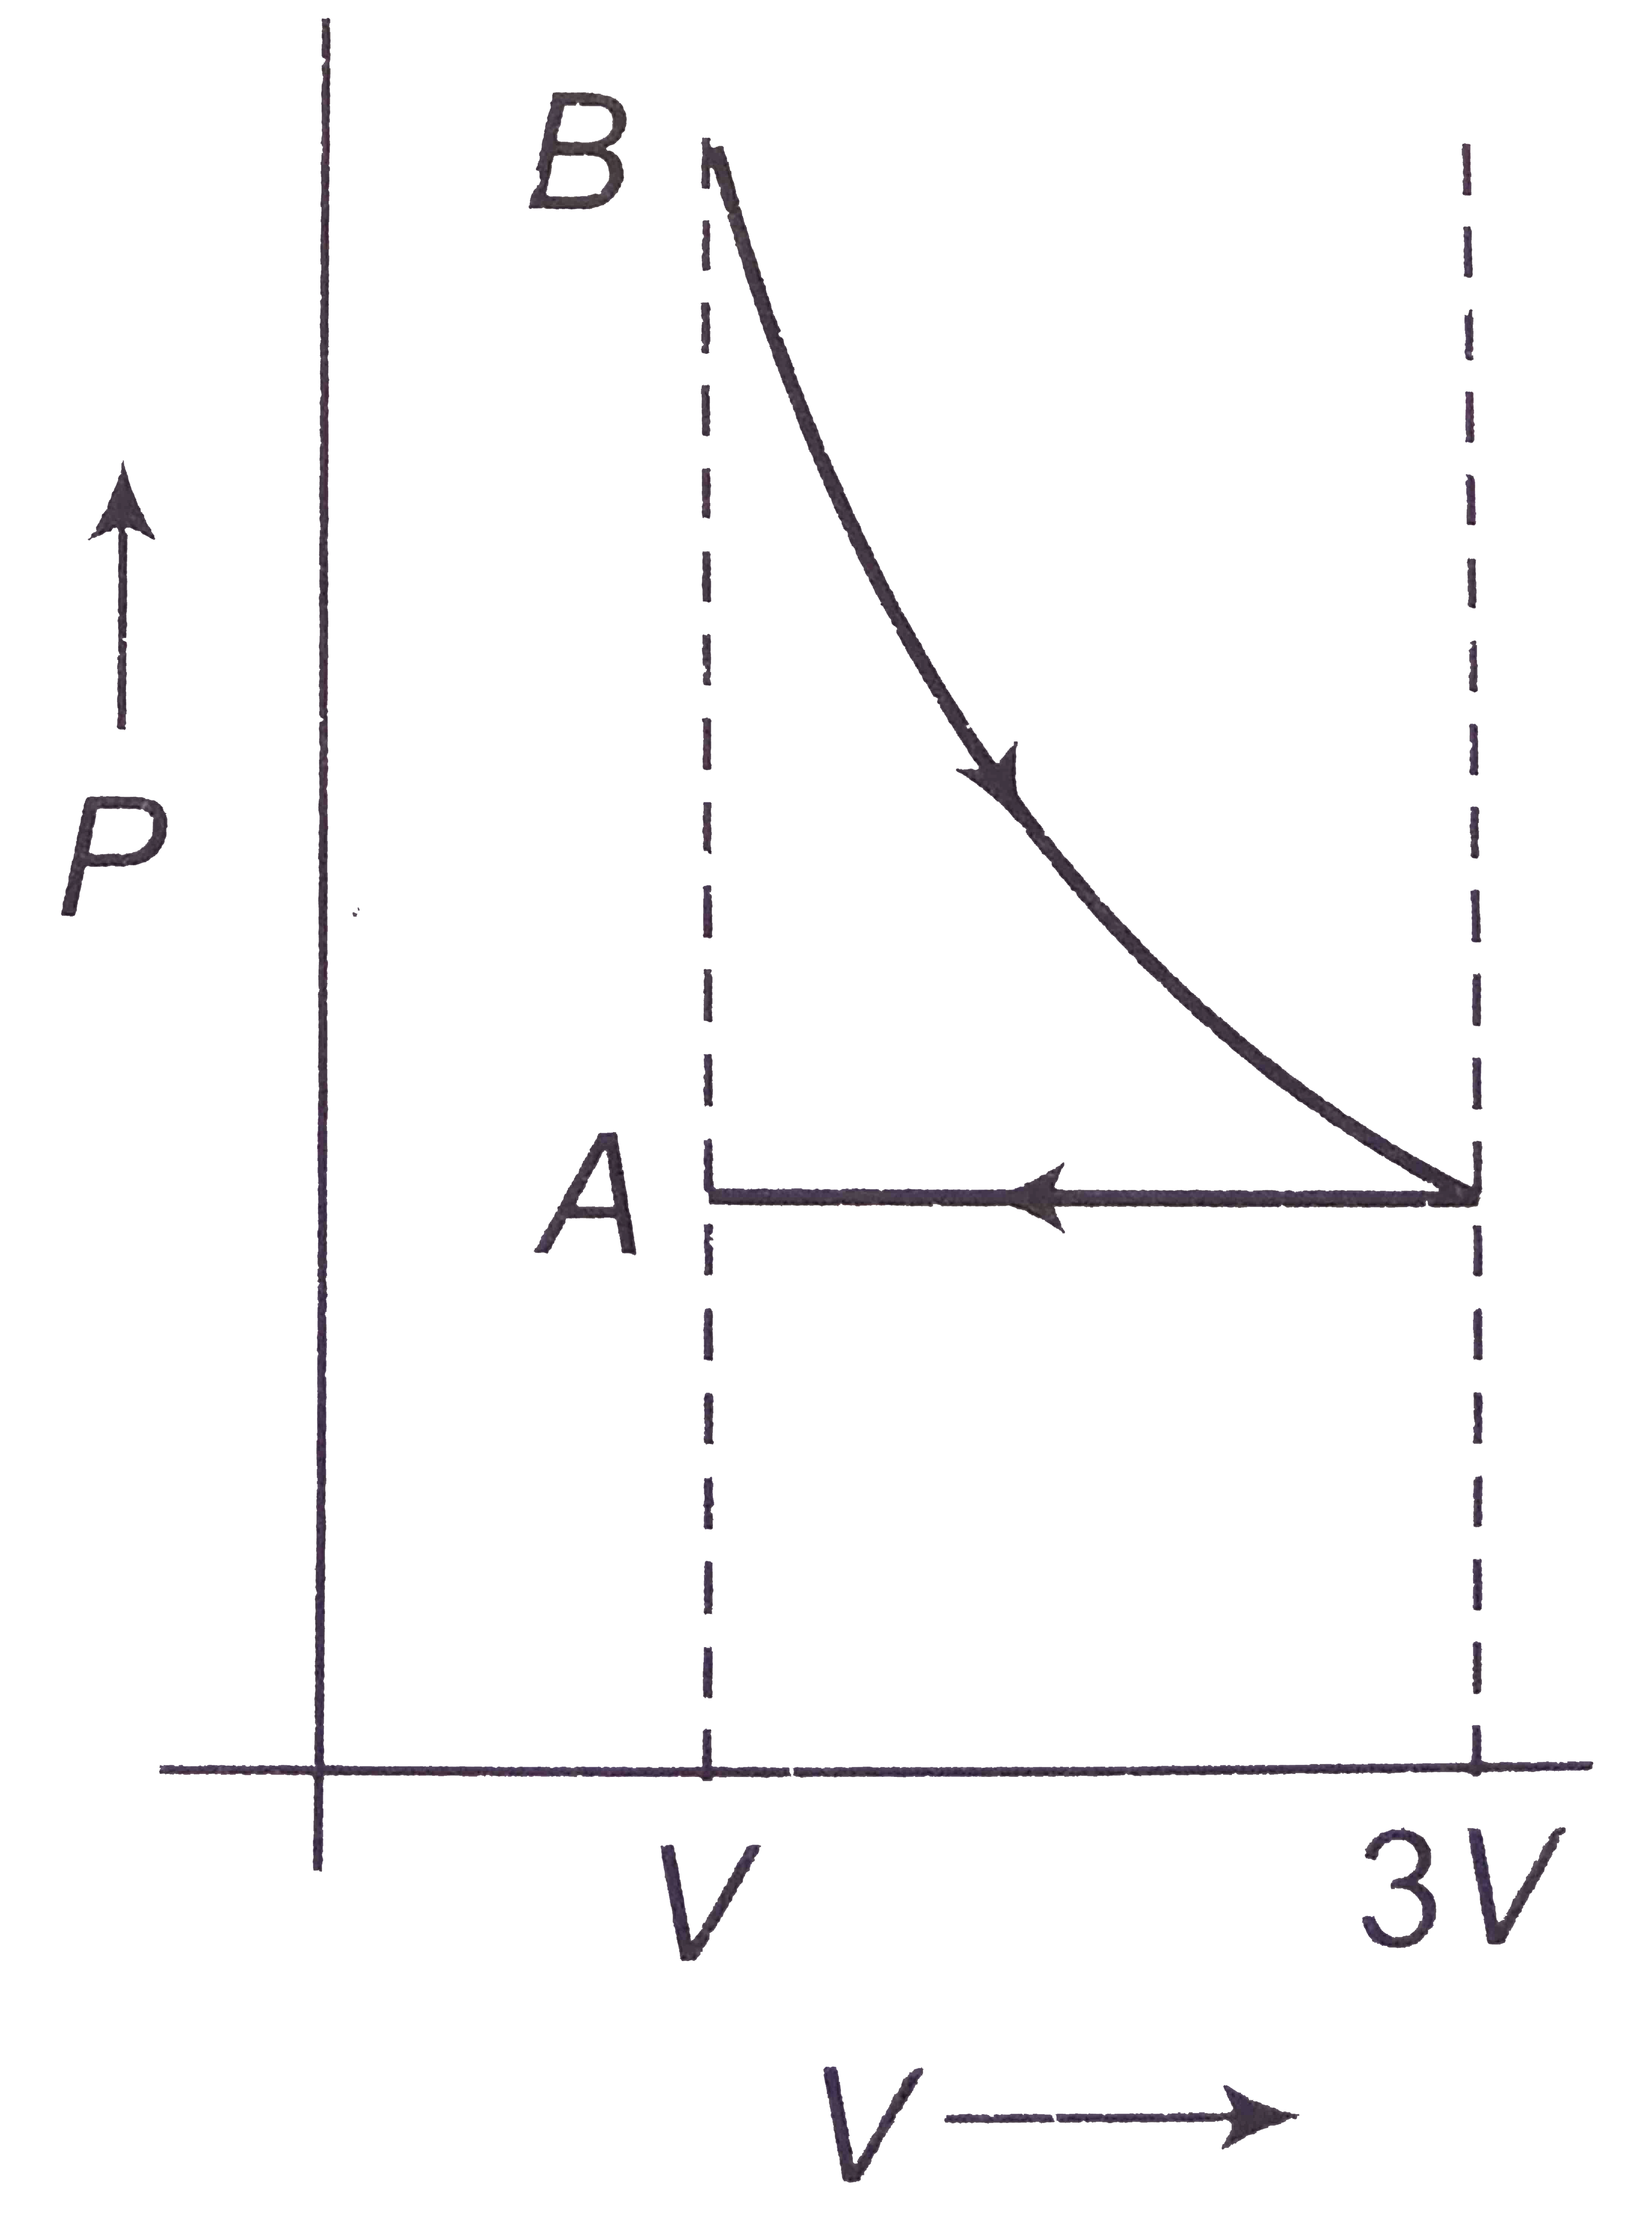
The correct Answer is:D
On P−V diagram, isothermal process is represented by rectangular hyperbola. Isobaric process is straight line parallel to volume axis.
Topper's Solved these Questions
Similar Questions
Knowledge Check
One mole of an ideal gas goes from an initial state A to final state B via two processs : It first undergoes isothermal expansion from volume V to 3V and then its volume is reduced from 3V to V at constant pressure. The correct P−V diagram representing the two process in (figure)
A B
B C
C D
D
One mole of an ideal gas goes from an initial state A to final state B via two processes : It first undergoes isothermal expansion from volume V to 3V then its volume is reduced from 3V to V at constant pressure. The correct P-V diagram representing the two processes is
A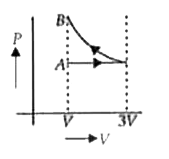 B
B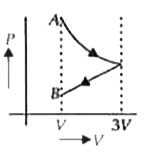 C
C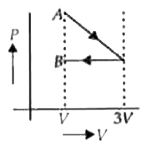 D
D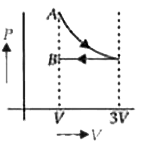
A gas at initial temperature T undergoes sudden expansion from volume V to 2V. Then -
AThe process is adiabaticBThe process is isothermalCThe work done in this process is nRT lne(2) where n is the number of moles of the gas.DThe entropy in the process does not change
Two moles of an ideal gas have an initial kelvin temperature Ti and absolute pressure Pi the gas undergoes a reversible isothermal compression from an initial volume Vi to a final volume 0.5 Vi
which one of the following expressions represents the final pressure of the gas ?
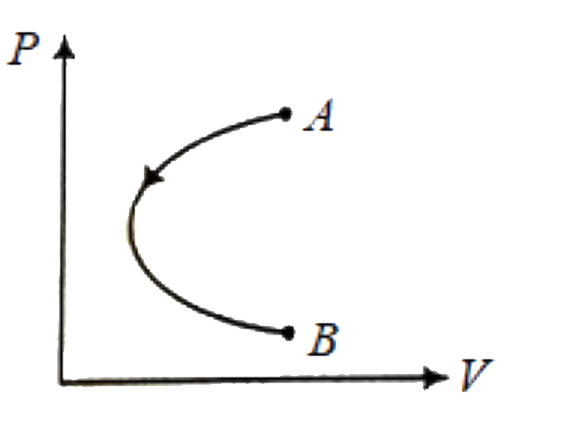
View SolutionP - V diagram of an ideal gas is shown. The gas undergoes from initial state A to final state B such that initial and final volumes are same. Select the correct alternative for given process AB.
View SolutionThe initial state of certain gas (PiViTi).It undergoes expansion till its volume becomes Vf at constant temperature T. The correct plot of P-V diagram for it is
View SolutionTwo moles of an ideal gas have an initial kelvin temperature Ti and absolute pressure Pi the gas undergoes a reversible isothermal compression from an initial volume Vi to a final volume 0.5 Vi
How much heat is exchanged with the environment? If heat is exchanged, is it absorbed or released?
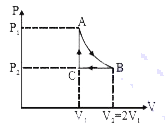
View Solutionn mole a perfect gas undergoes a cyclic process ABCA (see figure) consisting of the following processes.
A→B: Isothermal expansion at temperature T so that the volume is doubled from V1 to V2=2V1 and pressure changes from P1 to P2
B→C : Isobaric compression at pressure P2 to initial volume V1
C→A : Isochoric change leading to change of pressure from P2 toP1 .
Total work done in the complete cycle ABCA is :
View Solution

