The plot og logk vs 1/T helps to calculate
energy of activation
rate constant of the reaction
order of the reaction
Pnergy of activation as well as the frequency ctor.
Plot of log k vs 1/T helps to calculete Ea and A.
Topper's Solved these Questions
Similar Questions
For the reaction aA+bB→cC+dD, the plot of log k vs 1T is given below,
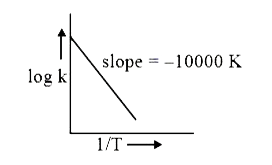
The temperature at which the rate constant of the reaction is 10−4s−1 is _____K.
(Rouded -off the nerest integer)
[Given : The rate constant of the reaction is 10−5s−1 at 500 K.]
View SolutionDraw the plot log V vs log T.
View Solution
Knowledge Check
According to the collision theory, only the effective collisions among the reacting species result in the products. In order that the collisions may be effective, the reacting species must have energy equal to or more than a certain minimum energy called threshold energy (E∘). Extra energy which has be supplied to the reactants to make collisions effective is known as activation energy (Ea). This is related to reaction rate with the help of Arrhenius equation, k=Ae−Ea/RT
The equation also helps in calculating the activation energy for a reaction at a specific temperature. In general, the rate of reaction is inversely proportional to the activation energy required.
The plot of log k Vs 1/T helps to calculateAEnergy of activationBRate constant of the reactionCOrder of reactionDEnergy of activation as well as the frequency factor,The plot of log k vs 1/T helps to calculate
Aenergy of activationBrate constant of the reactionCorder of the reactionDenergy of activation as well as the frequency factor.A graph plotted between logk versus 1/T for calculating activation energy is shown by
A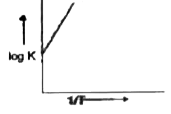 B
B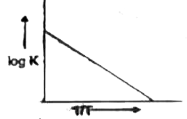 C
C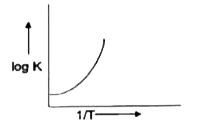 D
D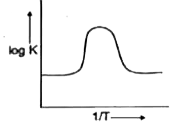
The plots of log10Kvs.1/T leads toa straight line having intercept equal to:
View SolutionA graph plotted between logk versus 1/T for calculating activation energy is shown by
View SolutionA graph plotted between logk versus 1/T for calculating activation energy is shown by
View SolutionWhen a plot of log k versus 1/T of chemical reaction is made, the energy of activation is given by the slope of straight line
View SolutionFor a first order reaction, the plot of log k against 1/T is a straight line. The slope of the line is equal to
View Solution
