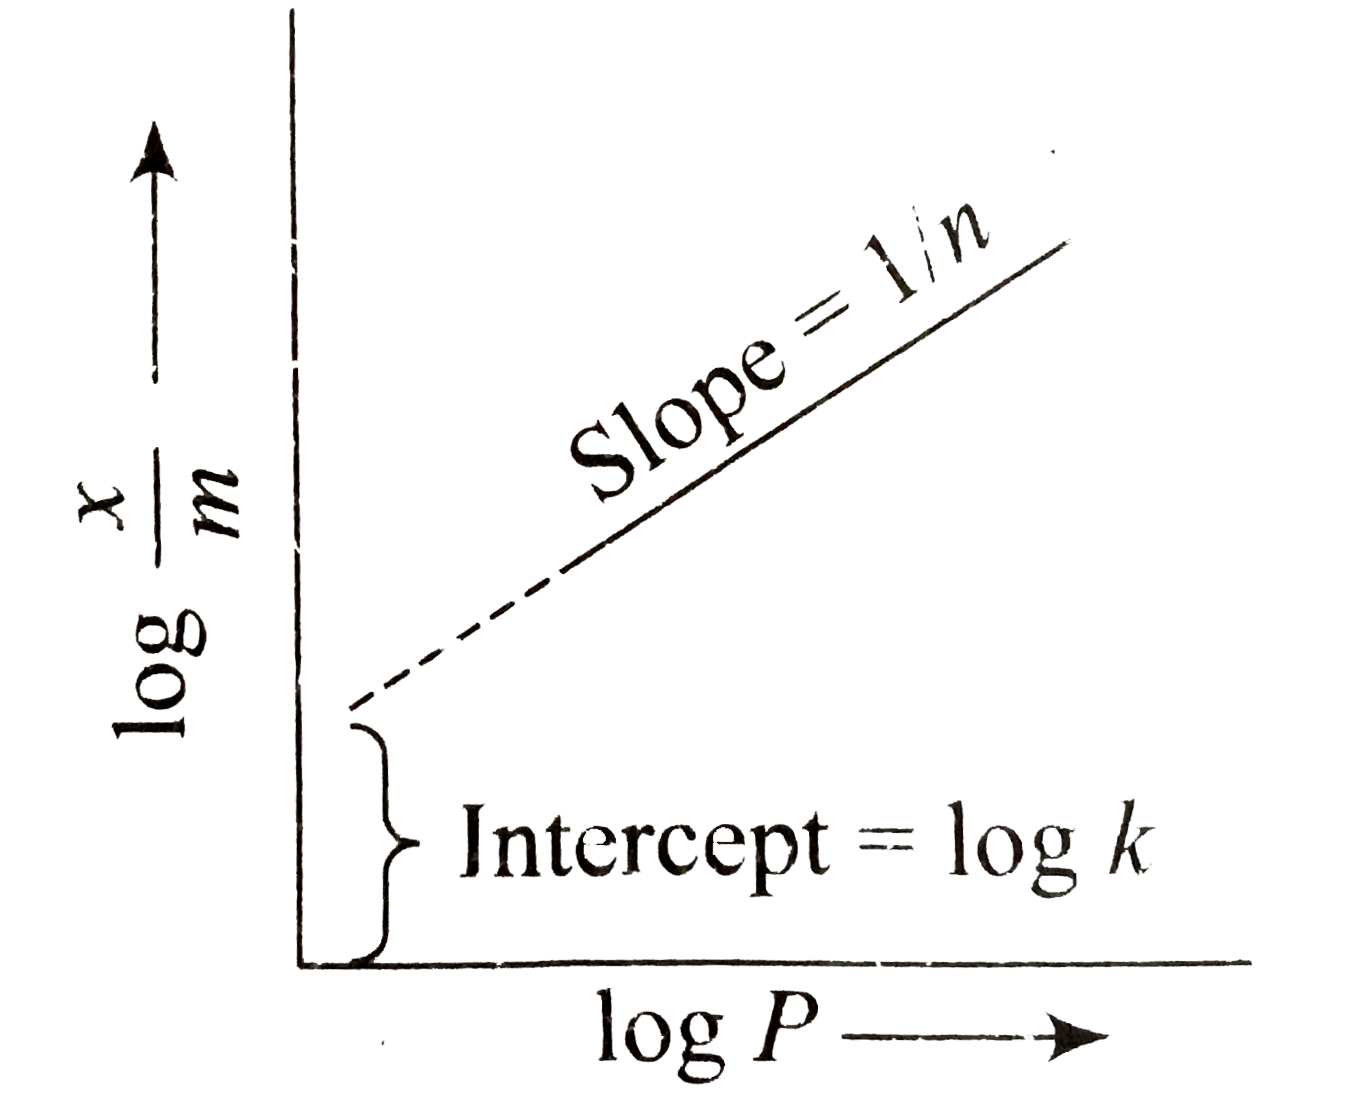
A plt of log Xm vs. log P for the adsorption of a gasd on a solid gives a straight line with slope equal to :
A
log K
B
−logK
C
n
D
1/n
Video Solution
Text Solution
The correct Answer is:D
In the case of adsorption of gass on solids, the relation between x/m and the pressure P of the gas at constant temperature is given by Freundlich adsorption Isotherm:
xm=kP1/n
Taking logarithm on both siddes, we get
logxm=logK+1nlog,P⏐↓⏐↓⏐↓⏐↓ycmx
Thus if we plot a graph between log (x/m) and log P,a straigh line is obtained.
The slope of the line is equal to 1/n and the intercept on log (x/m) axis will correespond to log K .

|
Topper's Solved these Questions
Similar Questions
Knowledge Check
A plot of log x/m versus log p for the adsorption of a gas on a solid gives a straight line with slope equal to:
A– log KBnC1nDLog KA plot of x/m versus log p for the adsorption of a gas on a solid gives a straight line with slope equal to
A1/nBlog kC−logkDn.A plot of log (xm) against log P for the adsorption of a gas on a sloid gives a straight a straight line with slope equal to :
A1nBnClogKDK
For the adsorption of a gas on a solid, the plot of log(x/m) versus log p is linear with slope equal to
View SolutionFor a first order reaction the plot of ‘t’ against log c gives a straight line with a slope equal to :
View SolutionFor a first order reaction the plot of ‘t’ against log c gives a straight line with a slope equal to :
View SolutionFor a first order reaction the plot of ‘t’ against log c gives a straight line with a slope equal to :
View SolutionFor a first order reaction, the reaction, the plot of logC against 't' (log C vs 't') gives a straight line with slope equal to:
View Solution

