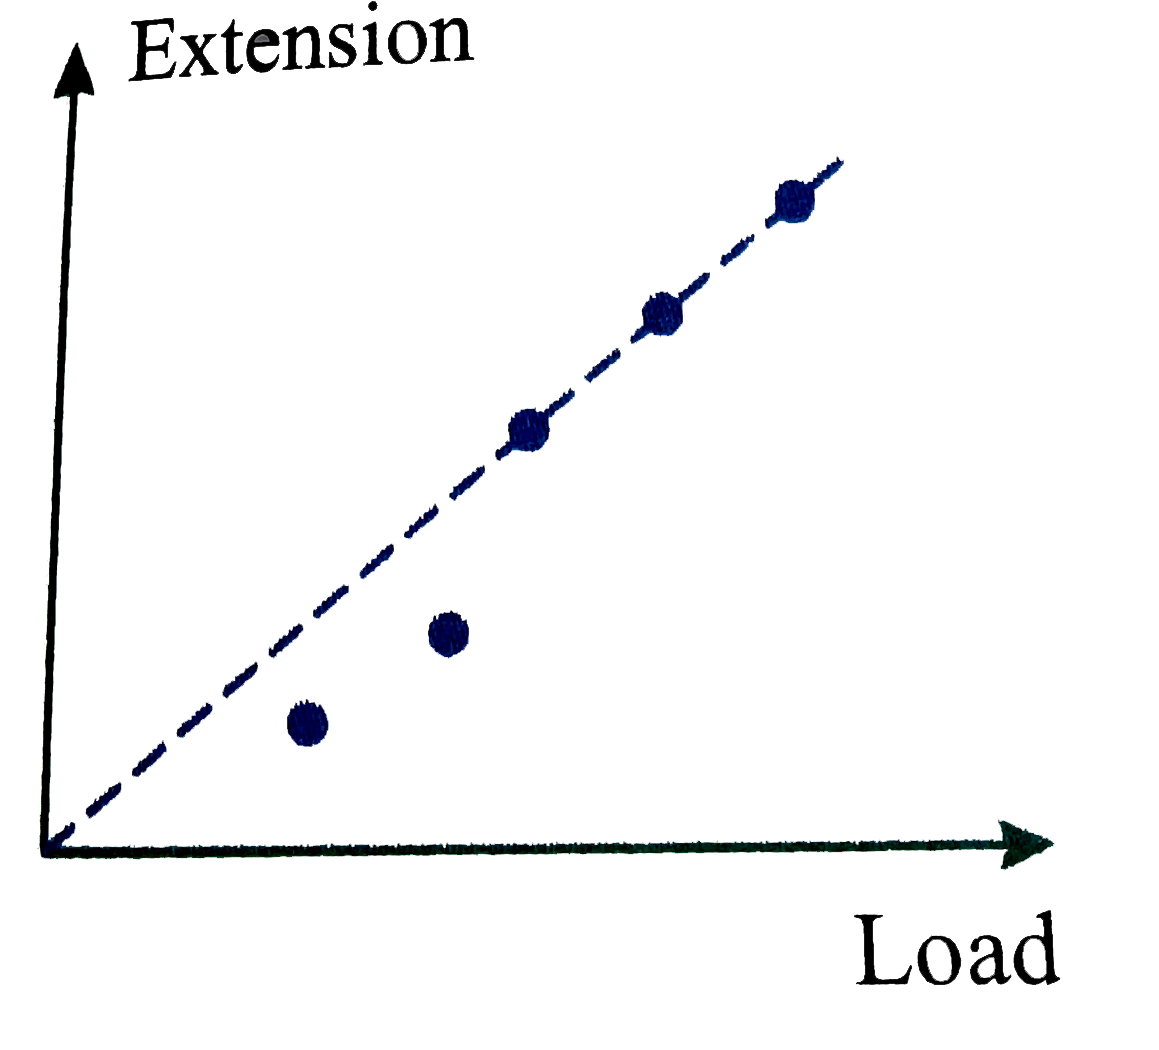
Statement-I: In Searle's experiment, extension versus load curve is drawn as shown. In the plot the first two readings are not lying on the straight line.

Statement-II : Experiment is performed incorrectly
Statement-I is true, Statement-II is true, Statement-II is a correct explanation for Statement-I
Statement-I is false, Statement-II is true, Statement-II is not a correct explanation for Statement-I
Statement-I is true, Statement-II is flase
Statement-I is false, Statement-II is true
The correct Answer is:C
Step by step video, text & image solution for Statement-I: In Searle's experiment, extension versus load curve is drawn as shown. In the plot the first two readings are not lying on the straight line. Statement-II : Experiment is performed incorrectly by Physics experts to help you in doubts & scoring excellent marks in Class 12 exams.
Updated on:21/07/2023Topper's Solved these Questions
- EXPERIMENTAL PHYSICSBook:NARAYNAChapter:EXPERIMENTAL PHYSICSExercise:Level-v(Single answer)
Explore 23 Videos
- EXPERIMENTAL PHYSICSBook:NARAYNAChapter:EXPERIMENTAL PHYSICSExercise:Multiple answer
Explore 6 Videos
- ELECTROSTATICS AND GAUSS LAWBook:NARAYNAChapter:ELECTROSTATICS AND GAUSS LAWExercise:Intergers type question
Explore 11 Videos
- MAGNETISMBook:NARAYNAChapter:MAGNETISMExercise:LEVEL-II (H.W)
Explore 24 Videos
Similar Questions
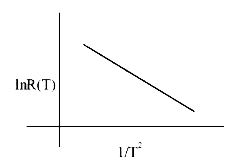
In an experiment, the resistance of a material is plotted as a function of temperature (in some range). As shown in the figure, it is a straight line. One may conclude that:

View SolutionStatement I: A thread is enough to measure a curved line.
Statement II: A scale is enough to measure a curved line.
View Solution
Knowledge Check
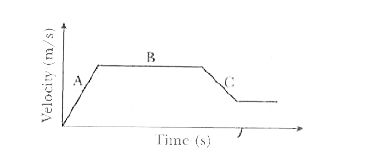
The given figure shows the velocity versus time curve for a car traveling along a straight line. Which of the following statements is false ?
 ANet forces act on the car during intervals A and C.BOpposing forces may be acting on the car during interval B.COpposing forces may be acting on the car during interval C.DThe magnitude of the net force acting duriing interval A is less then that during C.
In the searle's experiment, after every step of loading, why should we wait for two minutes before taking the reading?( More than one options may be correct).
ASo that the wire can have its desired change in length.BSo that the wire can attain room temperature.CSo that vertical oscillations can get subsided.DSo that the wire has no change in its radius.In Boyles experiment for a given gas at different temperature the graph drawn between pressure and density are straight lines as shown then
_E01_060_Q01.png) AT1>T2BT2>T1CT1=T2DT31=T2
AT1>T2BT2>T1CT1=T2DT31=T2
Statement I: A thread is enough to measure a curved line:
Statement II: A scale is enough to measure a curved line.
View SolutionStatement-1: Graph between potential energy of spring versus the extension or comparision of the spring is a straight line.
Statement-2: Potential energy of a stretched or compressed spring is proportional to square of extension or comparission.
View SolutionStatement - I : Electric lines are always straight and continuous.
Statement - II : Electric lines represents velocity field.
View SolutionStatement-I : In Young's double slit experiment interference pattern dissapears when one of the slits is closed
Statement-II : Interference is observed due to superposition of light waves from two coherent source
View SolutionStatement I: In Young's experiment, the fringe width for dark fringes is different from that of white fringes.
Statement II: In Young's doulbe-slit experiment, when the fringes are observed with a source of white light then only black and bright fringes are observed.
View Solution

