A railway engine whistling at a constant frequency moves with a constant speed. It goes past a stationary observer standing beside the railway track. The frequency (n) of the sound heard by the observer is plotted agains time (t). Which of the following best represents the resulting curve?
(##TRG_PHY_MCQ_XII_C07_E03_058_O01.png" width="30%">


The correct Answer is:C
Step by step video, text & image solution for A railway engine whistling at a constant frequency moves with a constant speed. It goes past a stationary observer standing beside the railway track. The frequency (n) of the sound heard by the observer is plotted agains time (t). Which of the following best represents the resulting curve? by Physics experts to help you in doubts & scoring excellent marks in Class 12 exams.
Updated on:21/07/2023Topper's Solved these Questions
- WAVE MOTION BOOK - TARGET PUBLICATIONCHAPTER - WAVE MOTION EXERCISE - MCQ 7.1
61 Videos
- SURFACE TENSION BOOK - TARGET PUBLICATIONCHAPTER - SURFACE TENSION EXERCISE - EVALUATION TEST
21 Videos
- WAVE THEORY OF LIGHT BOOK - TARGET PUBLICATIONCHAPTER - WAVE THEORY OF LIGHT EXERCISE - EVALUATION TEST
20 Videos
Similar Questions
A sound source, emitting sound of constant frequency, moves with a constant speed and crosses a stationary observer. The frequency (n) of sound heard by the observer is plotted against time (t). Which of the following graphs represents the correct variation :-
View SolutionA train whistling at constant frequency is moving towards a station at a constant speed v. The train goes past a stationary observer on the station. The frequency v of the sound as heard by the observer is plotted as a function of time t. Identify the expected curve.
View Solution
Knowledge Check
The rate of decay (R) of nuclei in a radioactive sample is plotted against time (t). Which of the following best represents the resulting curve ?
A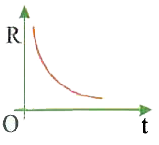 B
B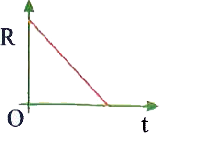 C
C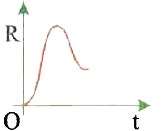 D
D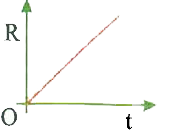
The rate of decay (R) of nuclei in a radioactive sample is plotted against time (t). Which of the following best represents the resulting curve ?
A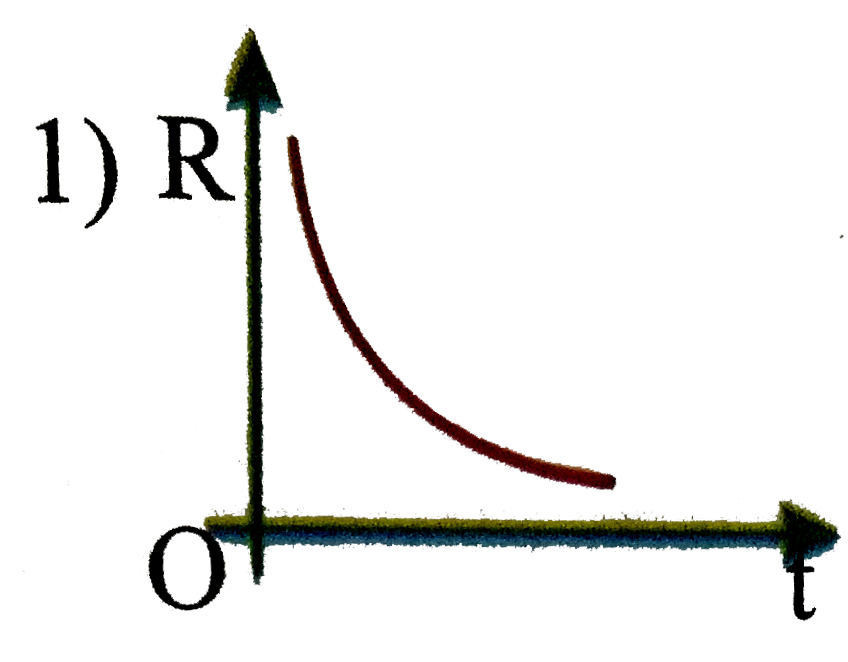 B
B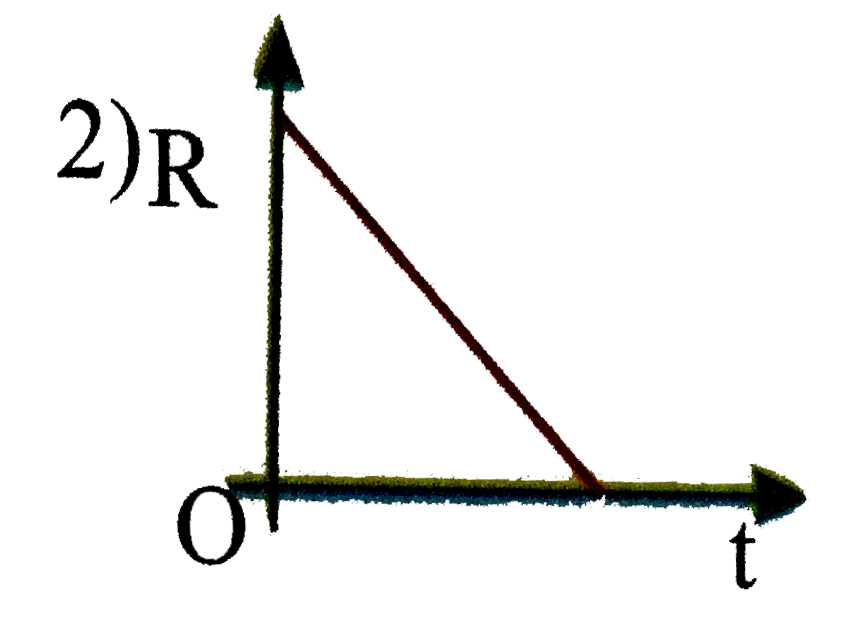 C
C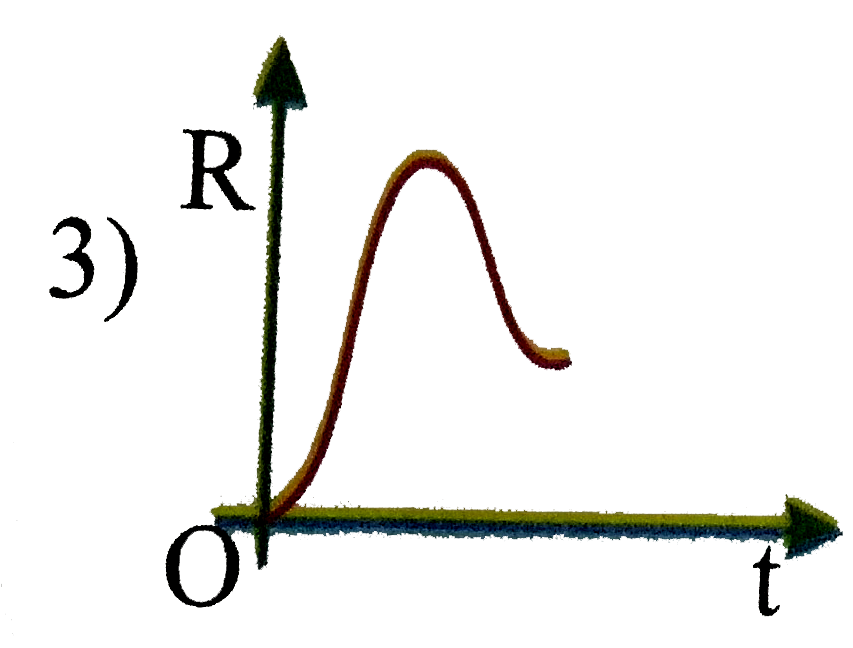 D
D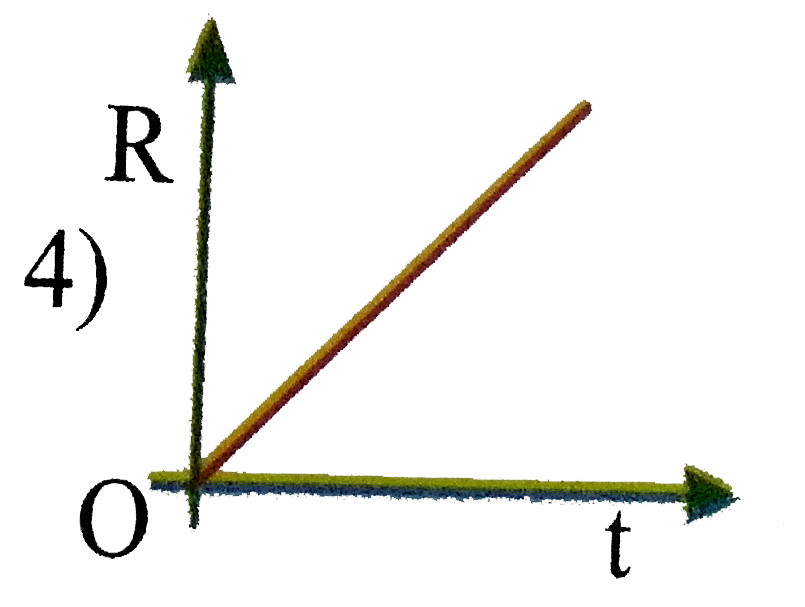
A sound source, emitting sound of constant frequency, moves with a constant speed and crosses a stationary observer. The frequency (n) of sound heard by the observer is plotted against time (t). Which of the following graphs represents the correct variation :-
A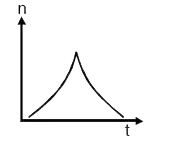 B
B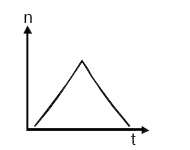 C
C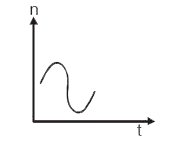 D
D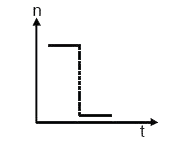
A train whistling at constant frequency is moving towards a station at a constant speed V. The train goes past a stationary observer on the station. The frequency n′ of the sound as heard by the observer is plotted as a function of time t, figure. Identify the expected curve.
View SolutionAn engine whistling at a constant frequency n0 and moving with a constant velocity goes past a stationary observer. As the engine crosses him, the frequency of the sound heard by him changes by a factor f. The actual difference in the frequencies of the sound heard by him before and after the engine crosses him is
View SolutionAn engine whistling at a constant frequency n0 and moving with a constant velocity goes past a stationery observer. As the engine crosses him, the frequency of the sound heard by him changes by a factor f. The actual difference in the frequencies of the sound heard by him before and after the engine crosses him is
View SolutionIf a source of frequency n moving with velocity v crosses a stationary observer, then the change in the frequency of sound heard by the observer will be (velocity of sound = V)
View Solutiona bus is moving towards and stationary observer with speed 20 m/s blows a horn of frequency 200 Hz. the frequency of sound heard by the observer is approximately ( take speed of sound 320 m/s)
View Solution
