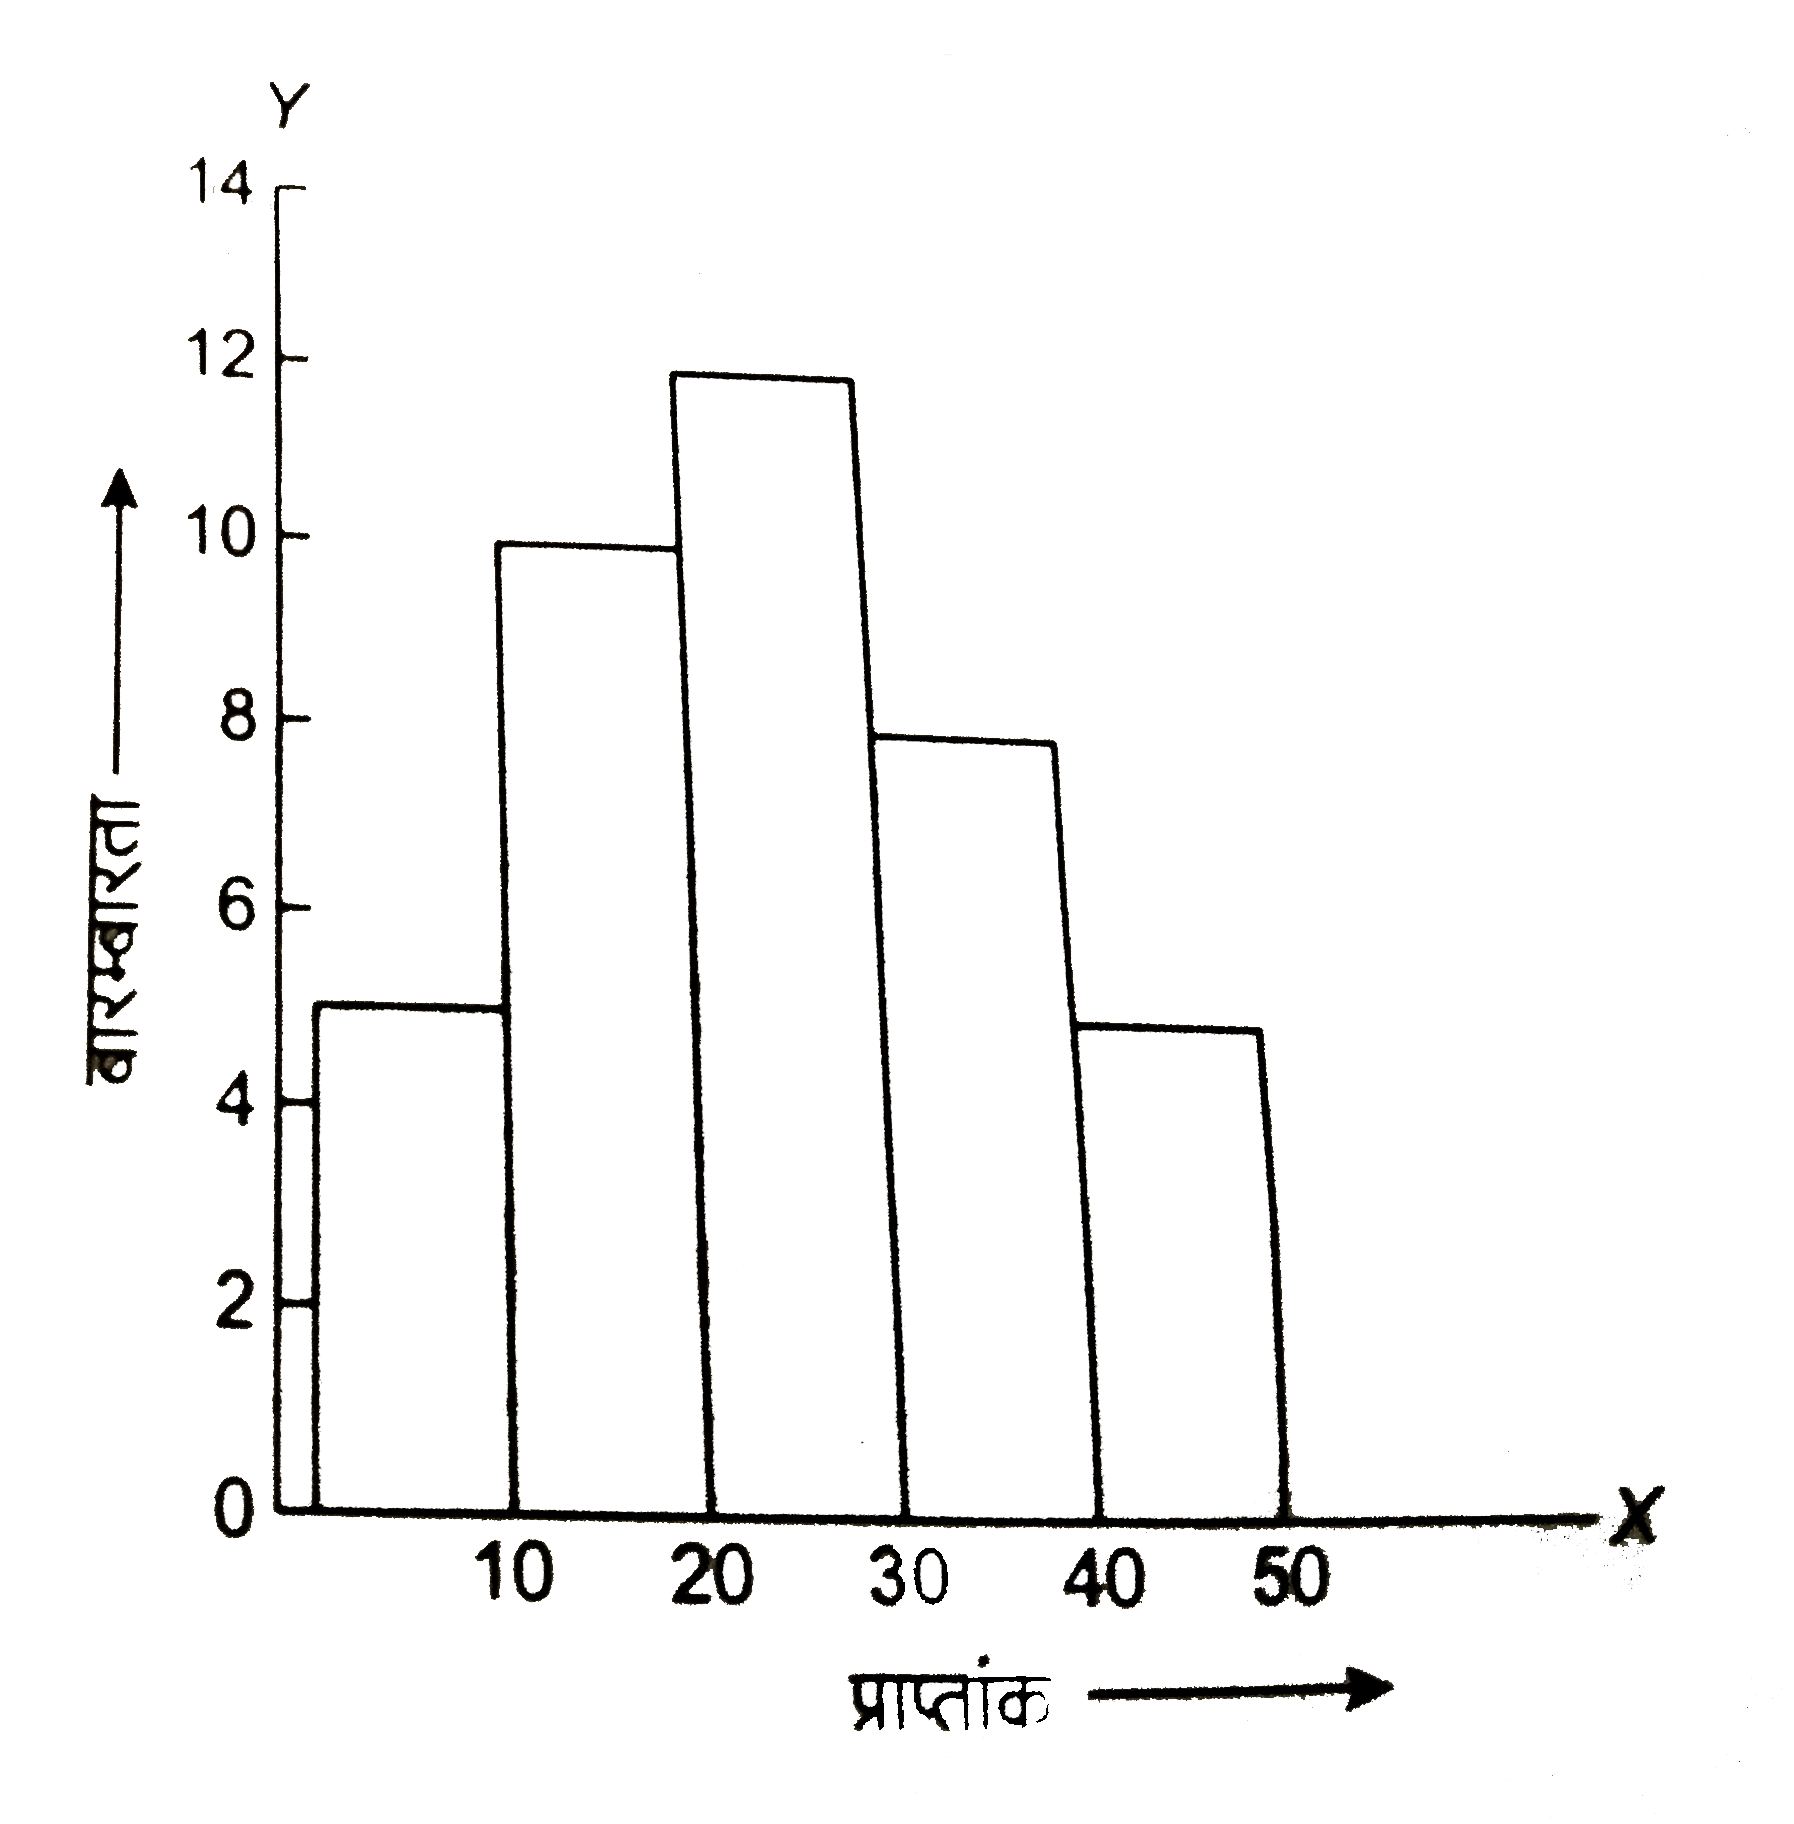
एक कक्षा के 40 छात्रों के प्राप्तांक (50 में से) नीचे दिये गये है :

इन आँकड़ों को एक आयत चित्र द्वारा प्रदर्शित कीजिए |
1. उपयुक्त पैमाने से, वर्ग अन्तरालों को X-अक्ष पर और बारम्बारता (छात्रों की संख्या) को Y- अक्ष पर अंकित करते है|
2. वर्ग अन्तरालों को आधार लेकर आयत बनाते हैं, जिनकी ऊँचाइयाँ संगत बारम्बारतायें हैं |

Topper's Solved these Questions
- सांख्यिकी BOOK - NOOTAN HINDICHAPTER - सांख्यिकी EXERCISE - प्रश्नावली 14A
9 Videos
- सांख्यिकी BOOK - NOOTAN HINDICHAPTER - सांख्यिकी EXERCISE - प्रश्नावली 14B
12 Videos
- संख्या पद्धतिBOOK - NOOTAN HINDICHAPTER - संख्या पद्धतिEXERCISE - विविध प्रश्नावली (लघु उत्तरीय प्रश्न)
10 Videos
- हीरोन का सूत्र BOOK - NOOTAN HINDICHAPTER - हीरोन का सूत्र EXERCISE - विविध प्रश्नावली
11 Videos
Similar Questions
प्राथमिक आँकड़ों और द्वितीयक आँकड़ों को परभाषित कीजिए| दोनों में से कोण ज्यादा विश्वसनीय है ?
View Solutionनिम्नलिखित आँकड़ों से एक दण्ड आलेख बनाइए :

View Solution−14 और 25 के मध्य दो परिमेय संख्याएँ ज्ञात कीजिए ।
View Solutionएक त्रिभुज की तीनों भुजाओ की लम्बाई 3 ,4 और 5 सेमी है|इसका क्षेत्रफल ज्ञात कीजिए|
View SolutionHow many lines of symmetry does the above figure have ?
View SolutionWhich of the following are correct chain isomers of butane ? (i)
View SolutionDetermine the point of symmetry of a regular hexagon.
View SolutionDtermine the images of the following figure about the given line :
View SolutionMatch the following Column A to Column B

View SolutionMatch the following Column A to Column B

View SolutionMatch the following Column A to Column B

View SolutionFind the area of the figure given below.

View SolutionThe area of the shaded part in the figure given below is ______.

View SolutionThe inequation represented by the graph given below is :
View SolutionThe inequation that best describes the graph given below is _________
View SolutionThe inequation that best describes the following graph is _________
View Solution
