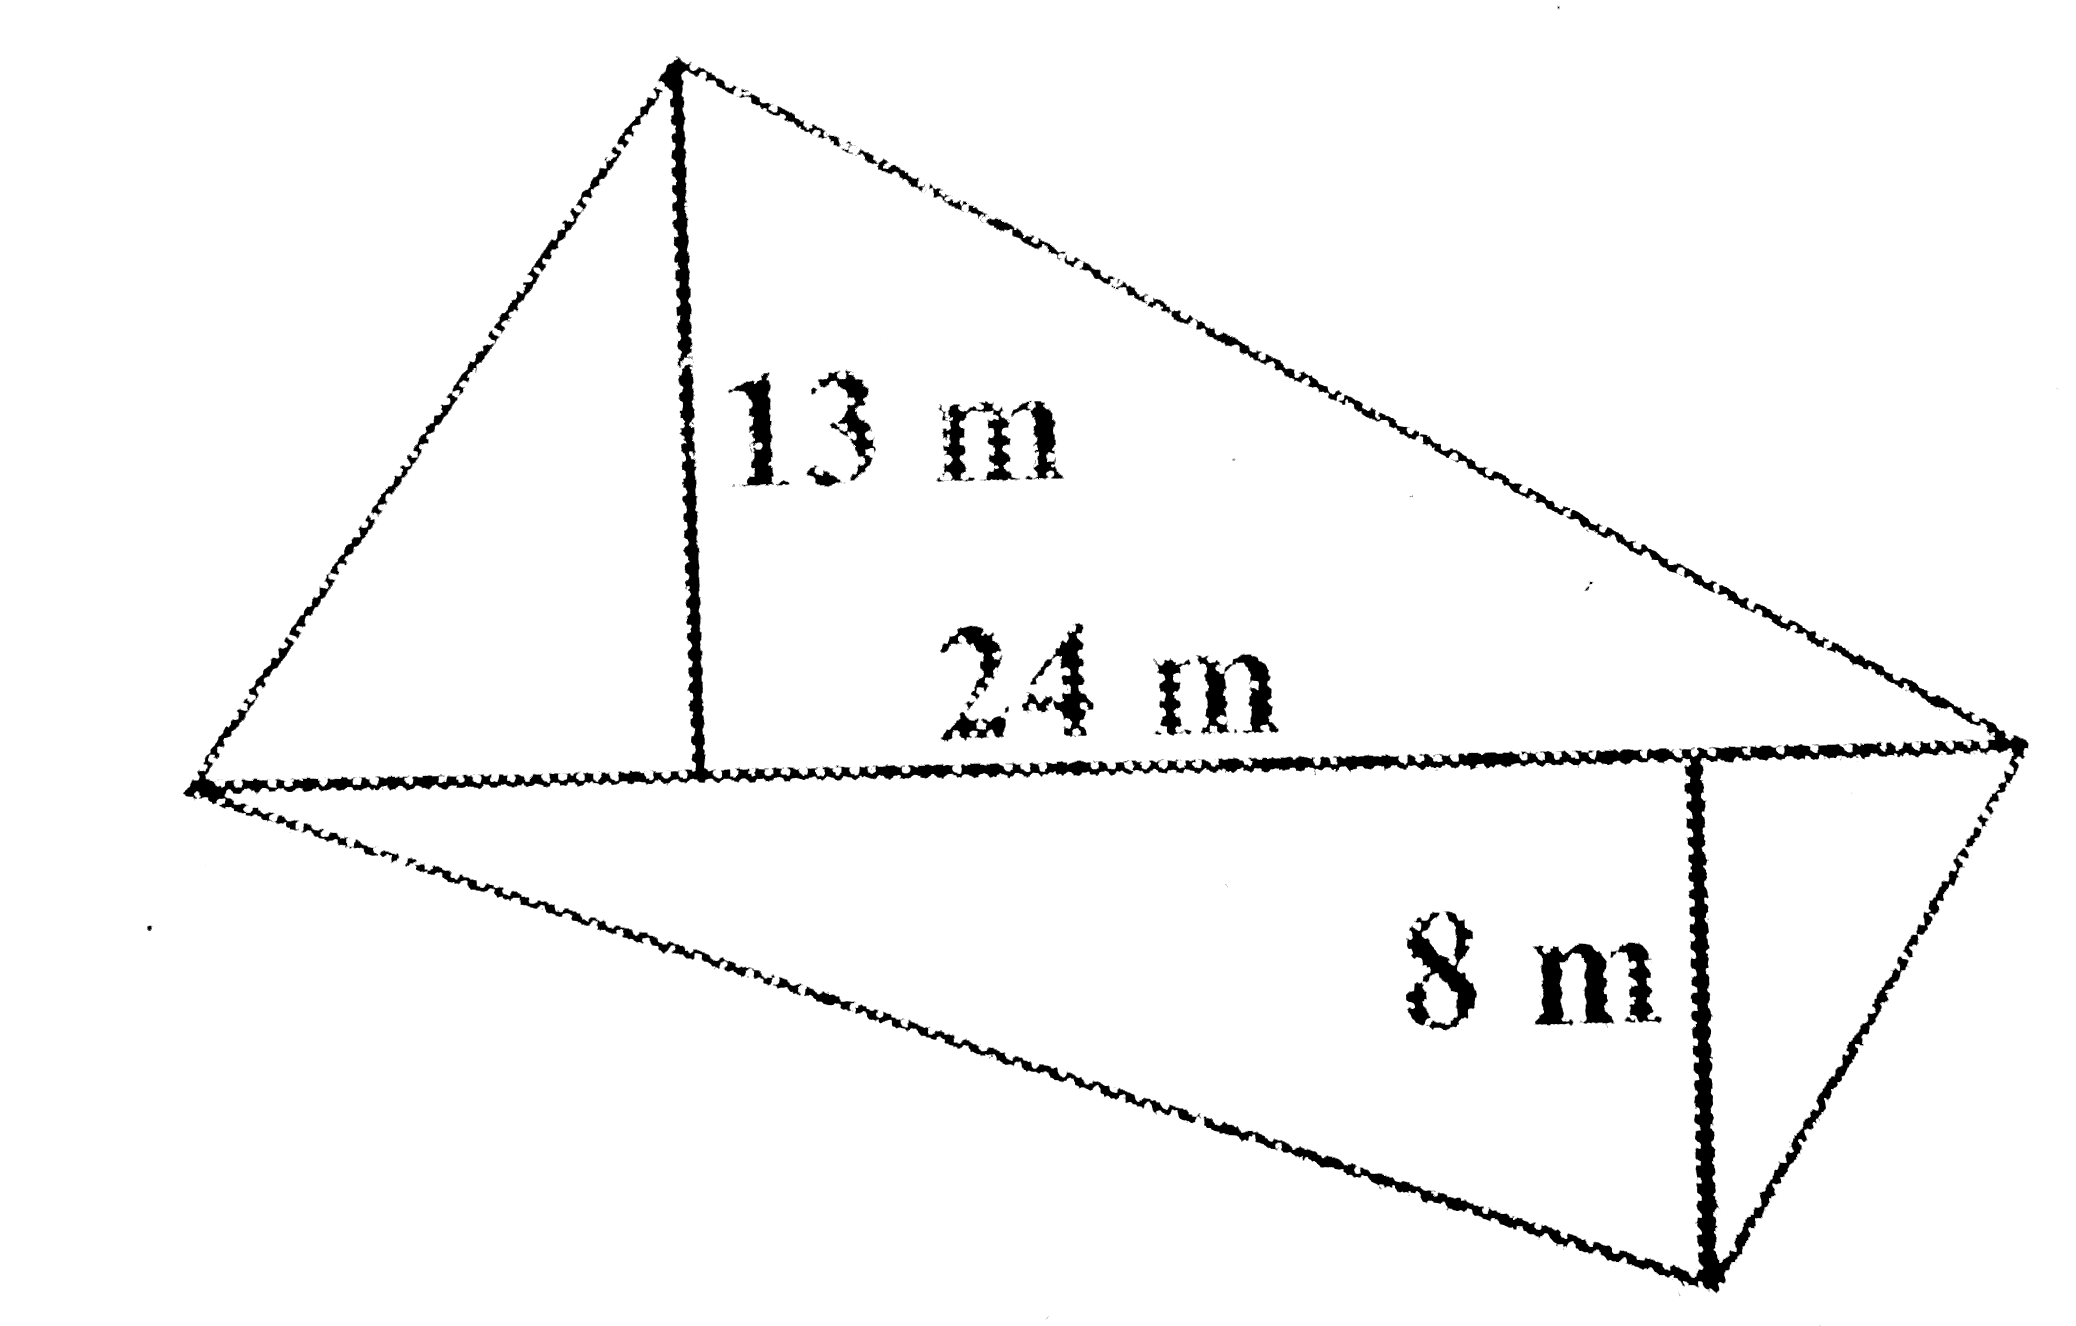
एक चतुर्भुज आकार के खेत का विकर्ण 24 m है और शेष सम्मुख शीर्षो से इसे विकर्ण पर खींचे गए लंब 8 m एवं 13 m है | खेत का क्षेत्रफल ज्ञात कीजिए |

252m2
Topper's Solved these Questions
- क्षेत्रमिति BOOK - NCERT HINDICHAPTER - क्षेत्रमिति EXERCISE - प्रश्नावली 11.3
10 Videos
- क्षेत्रमिति BOOK - NCERT HINDICHAPTER - क्षेत्रमिति EXERCISE - प्रश्नावली 11.4
8 Videos
- क्षेत्रमिति BOOK - NCERT HINDICHAPTER - क्षेत्रमिति EXERCISE - प्रश्नावली 11.1
5 Videos
- एक चर वाले रैखिक समीकरणBOOK - NCERT HINDICHAPTER - एक चर वाले रैखिक समीकरणEXERCISE - प्रश्नावली 2.6
7 Videos
- गुणनखंडBOOK - NCERT HINDICHAPTER - गुणनखंडEXERCISE - प्रयास कीजिए
2 Videos
Similar Questions
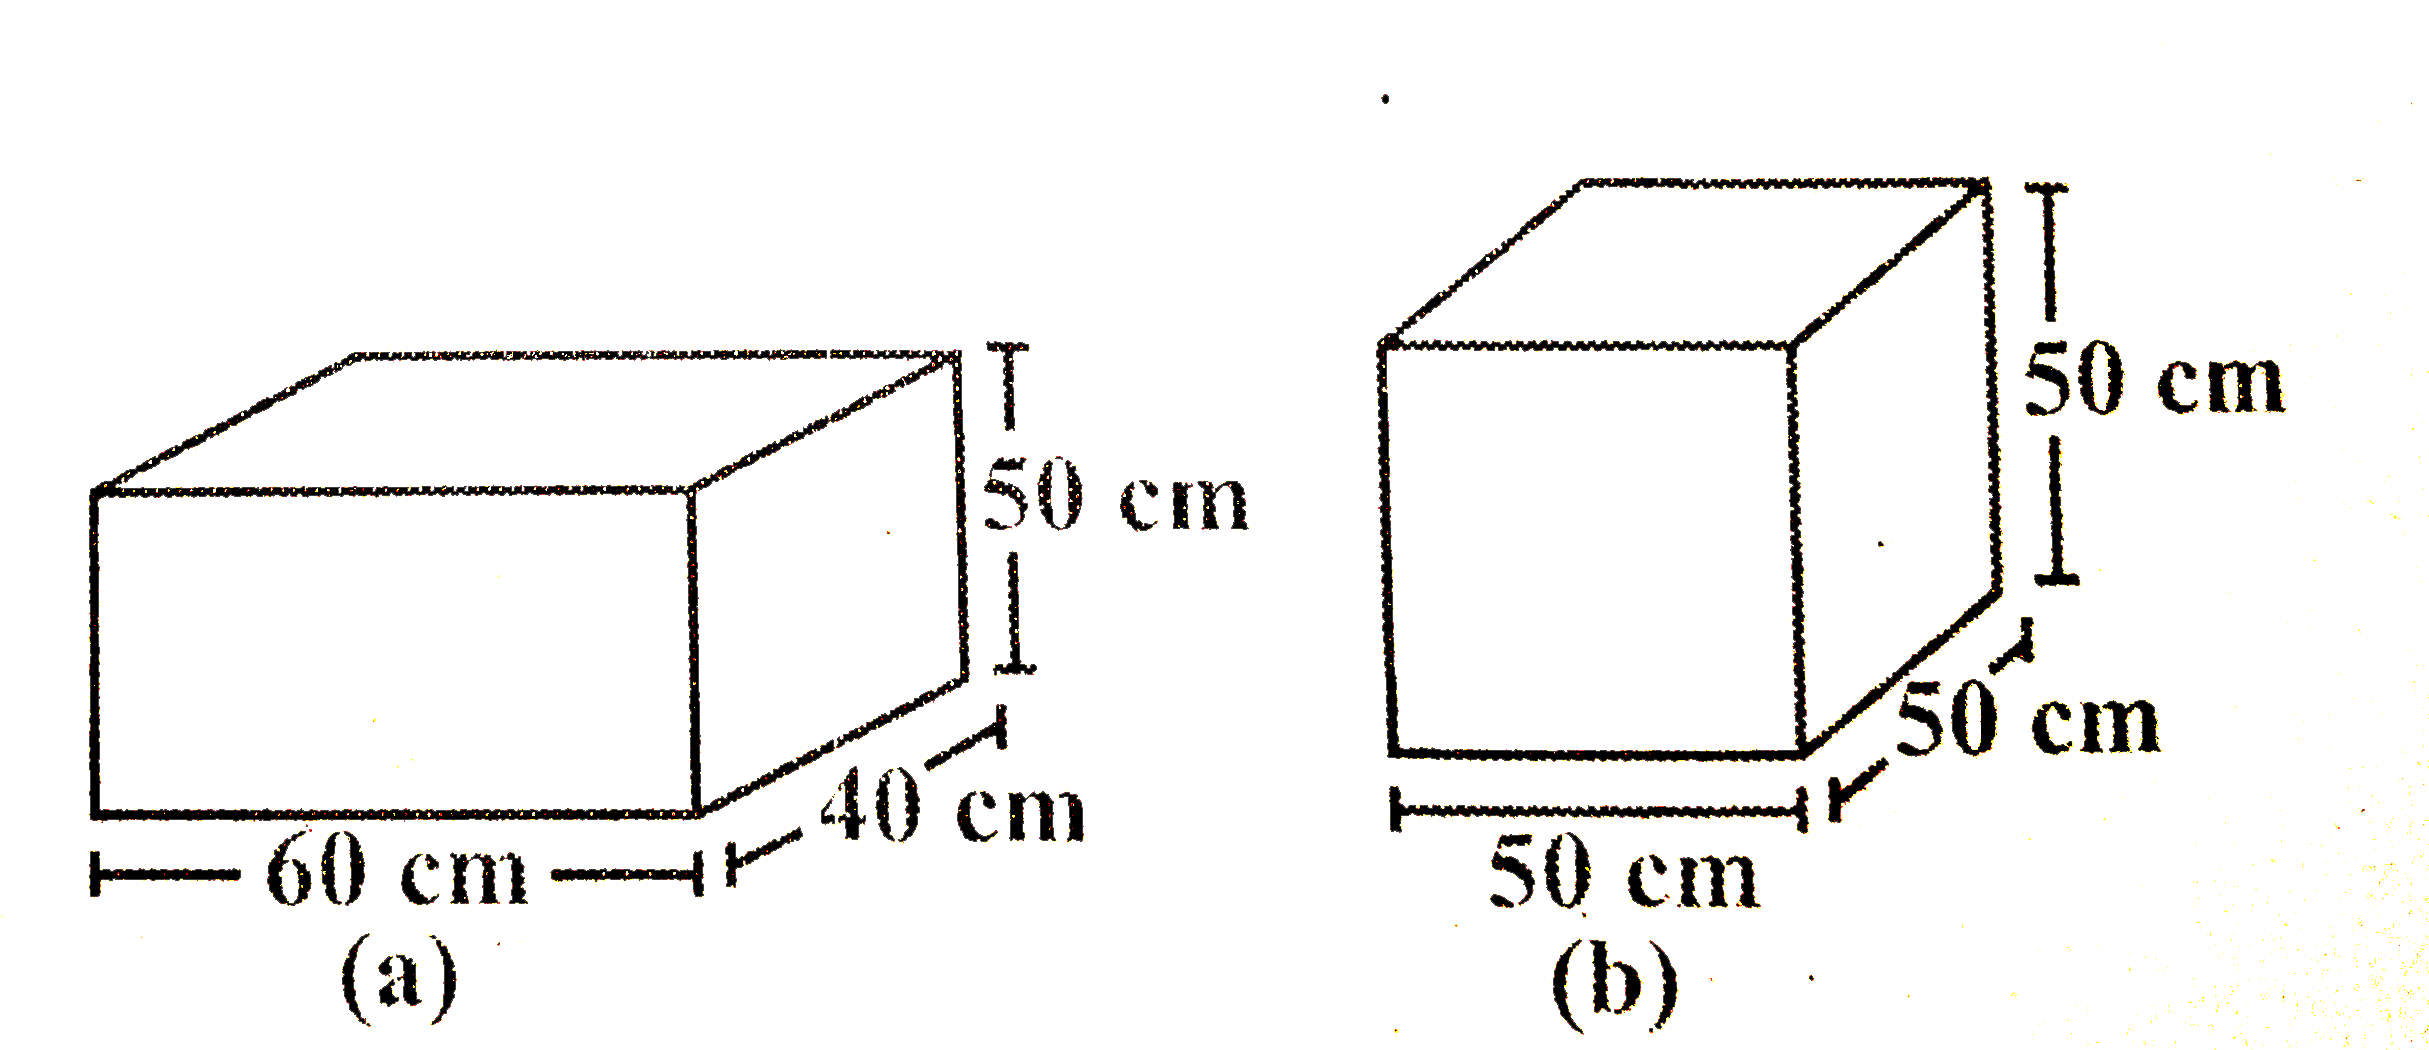
दो घनाभाकर डिब्बे हैं जैसा कि संलग्न आकृति में दर्शाया गया है | किस डिब्बे को बनाने के लिए कम सामग्री की आवयश्कता है ?

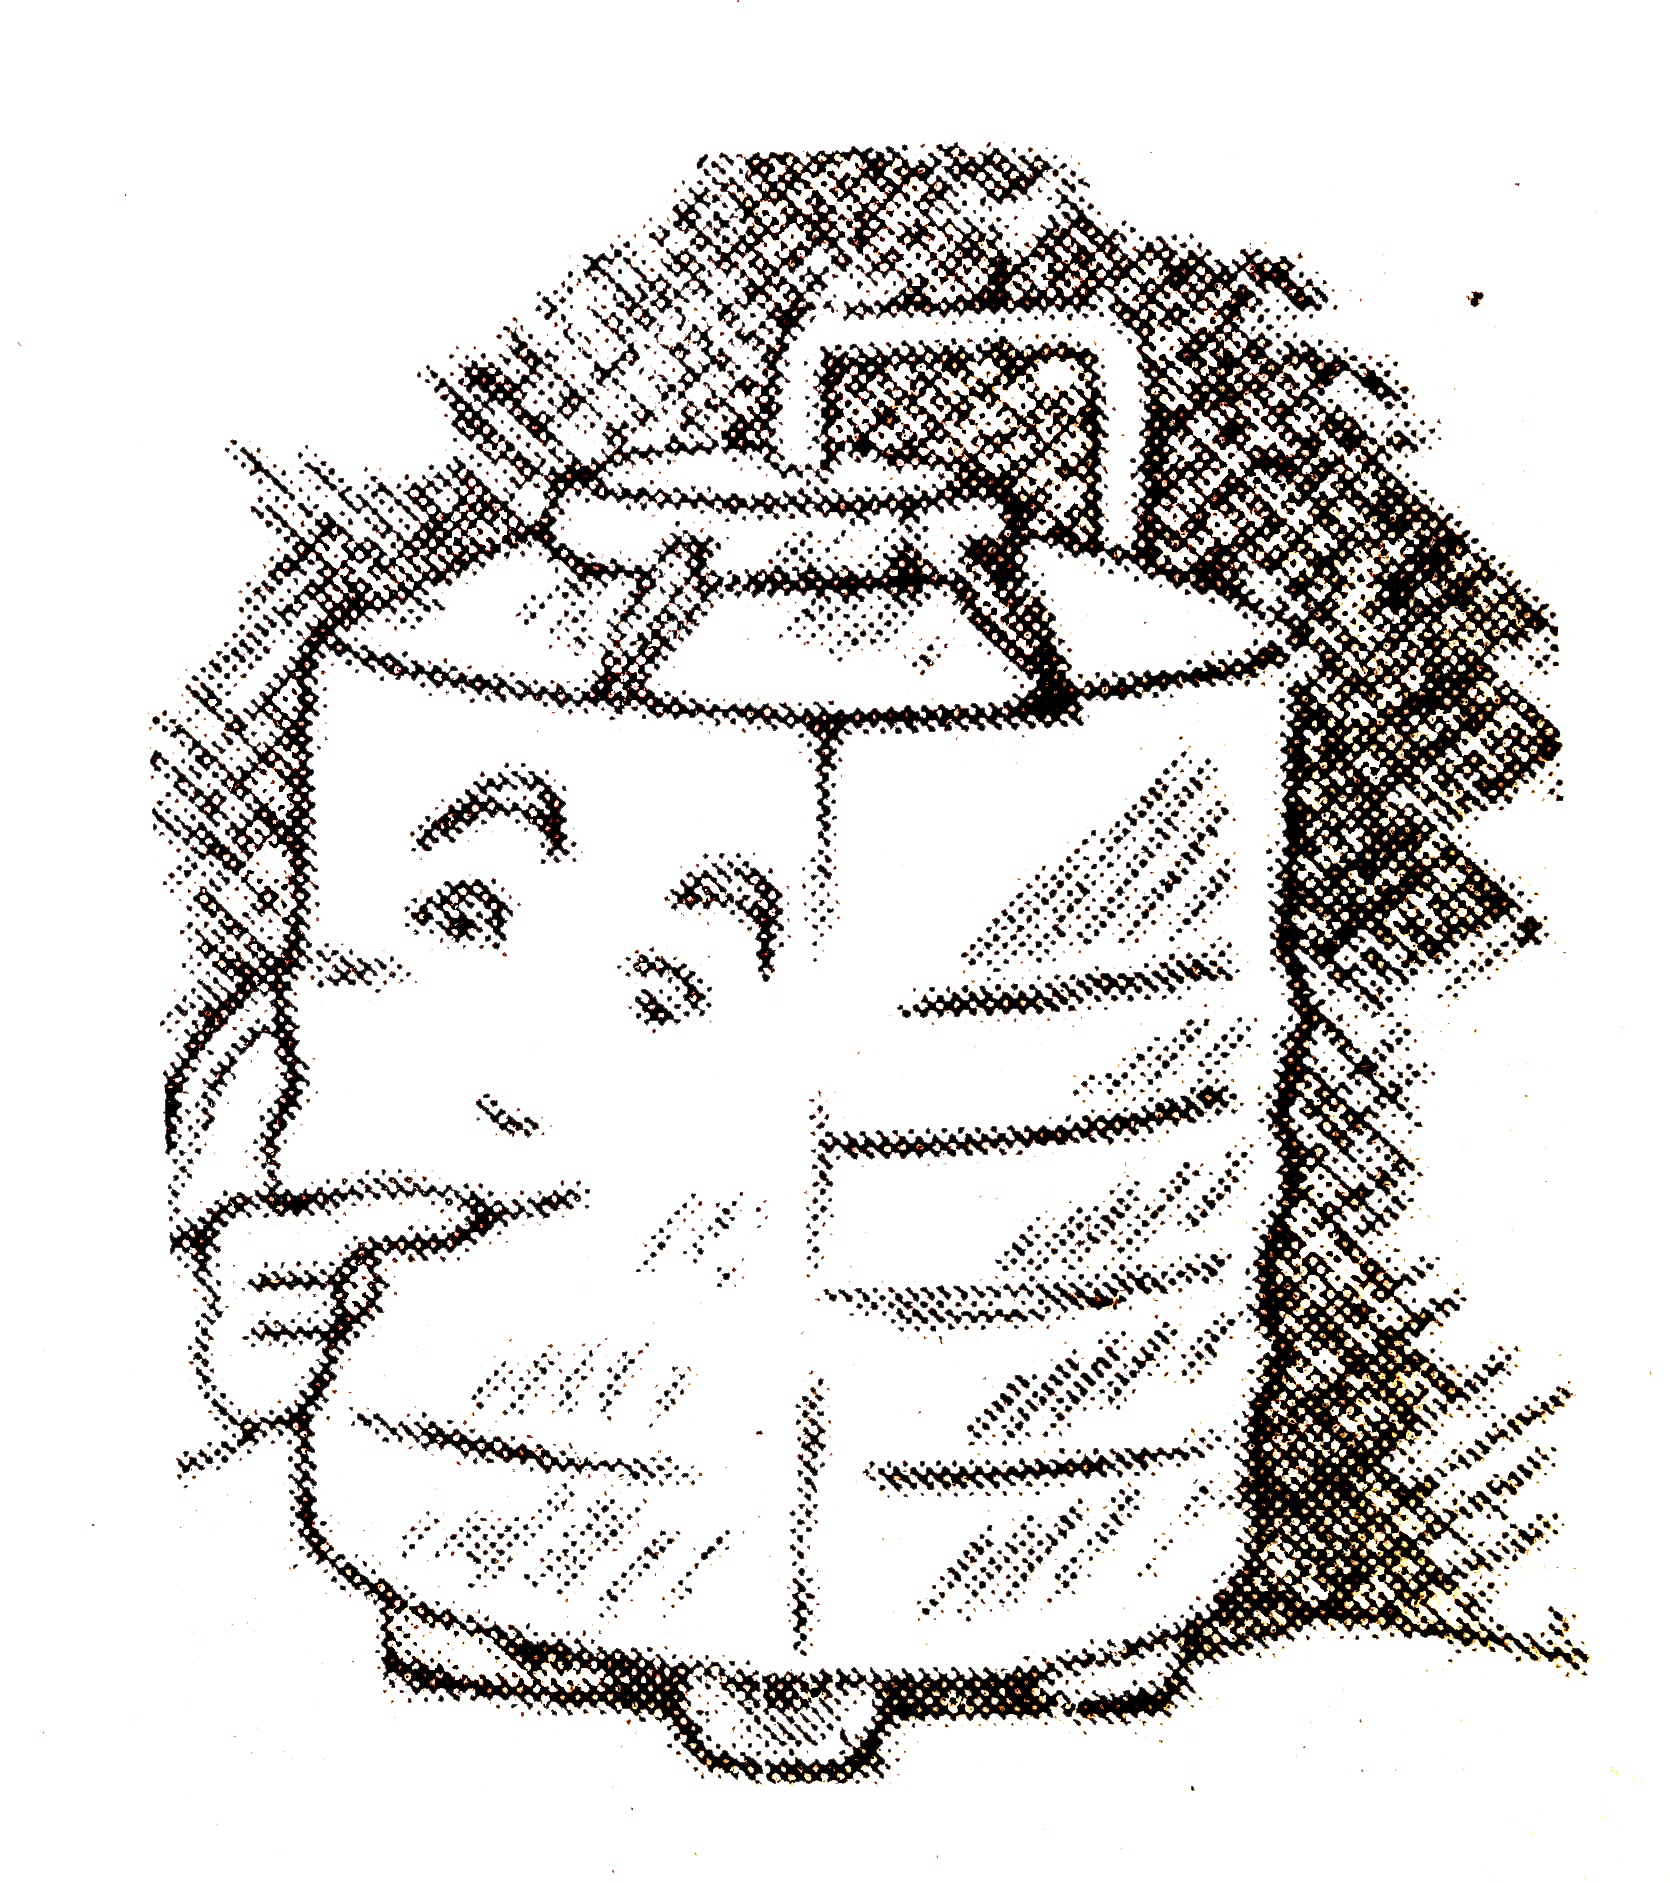
View Solutionआपको एक बेलनाकार टैंक दिया हुआ है , निम्नलिखत में से किस स्थिति में आप उसका पृष्ठीय क्षेत्रफल ज्ञात करेंगे और किस स्थिति में आयतन :
(a) यह ज्ञात करने के लिए कि इसमें कितना पानी रखा जा सकता है |
(b) इसका प्लास्टर करने के लिए वांछित सीमेंट बोरियों की संख्या |
(c) इसमें भरे पानी से भरे जाने वाली छोटे टैंको की संख्या |

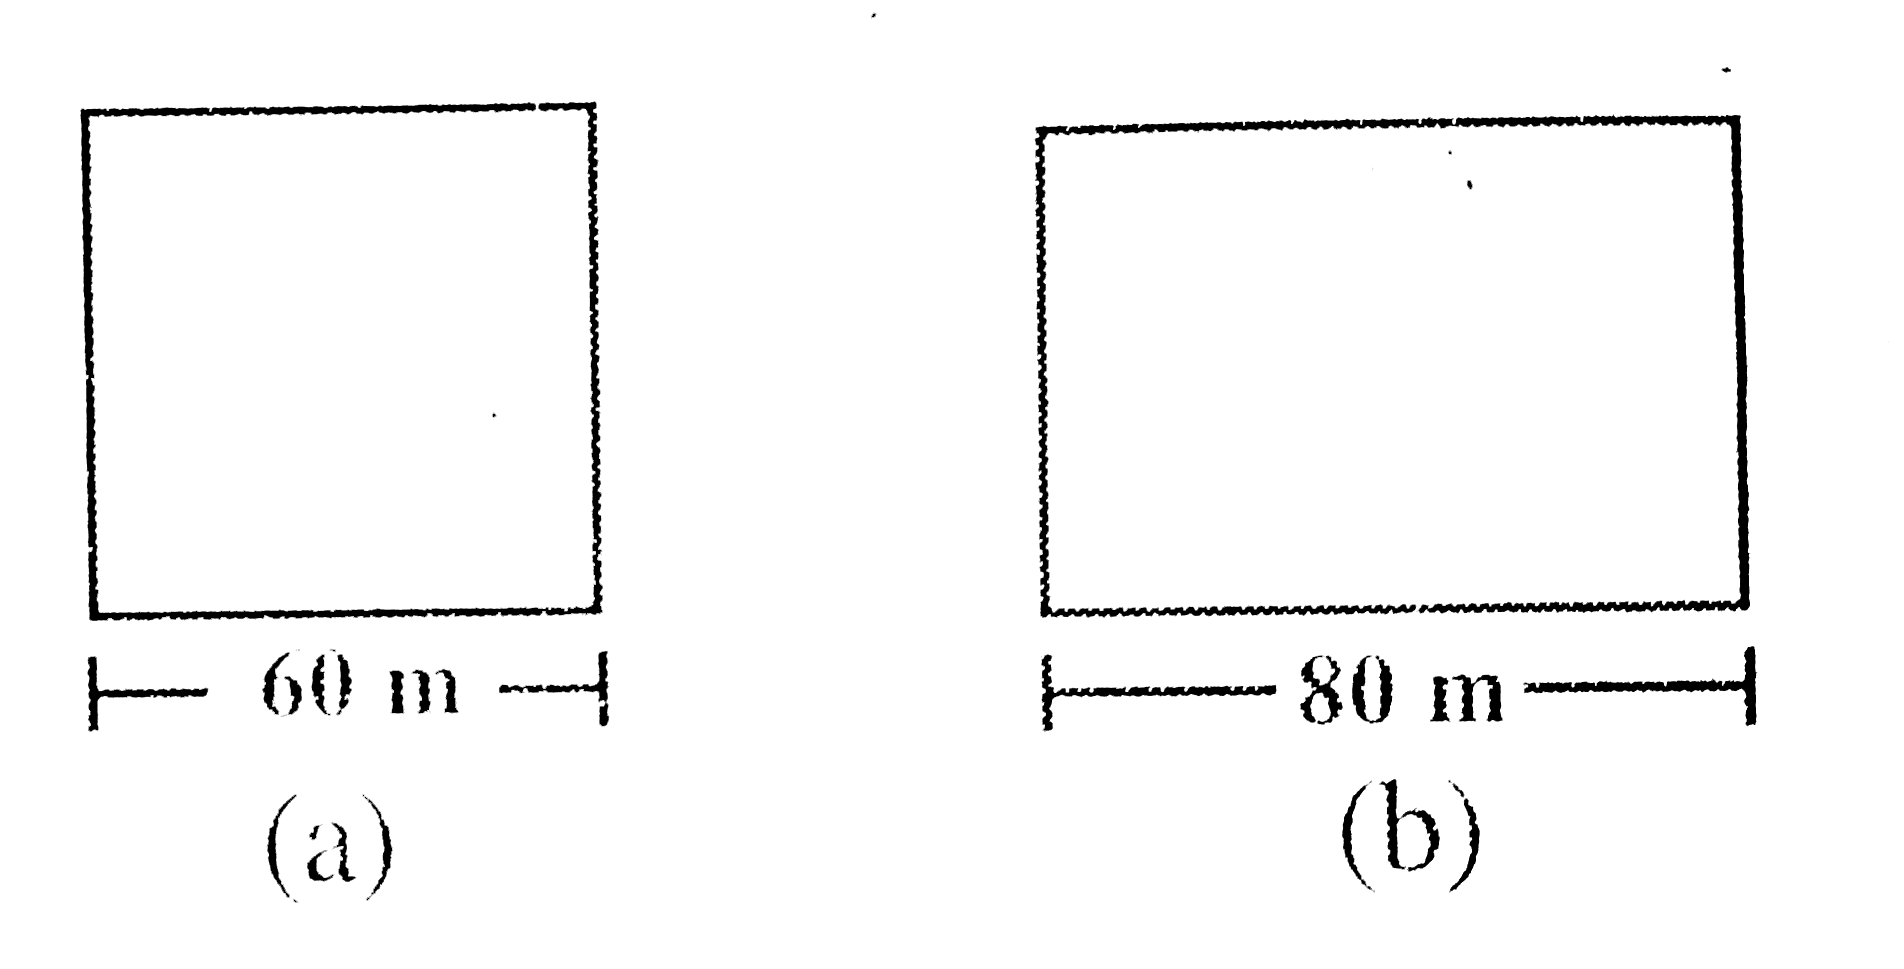
View Solutionजैसा कि संलग्न में दर्शाया गया है, एक आयातकार और एक वर्गाकार खेत के माप दिए हुए है | यदि इनके परिमाप समान है, तो किस खेत का क्षेत्रफल अधिक होगा ?

View Solution8x−33x=2
View Solutionगुणनखंड कीजिएः
(i) 12x+36 (ii) 22y−33z (iii) 14pq+35pqr
View SolutionHow many lines of symmetry does the above figure have ?
View SolutionWhich of the following are correct chain isomers of butane ? (i)
View SolutionDetermine the point of symmetry of a regular hexagon.
View SolutionDtermine the images of the following figure about the given line :
View SolutionMatch the following Column A to Column B

View SolutionMatch the following Column A to Column B

View SolutionMatch the following Column A to Column B

View SolutionFind the area of the figure given below.

View SolutionThe area of the shaded part in the figure given below is ______.

View SolutionThe inequation represented by the graph given below is :
View SolutionThe inequation that best describes the graph given below is _________
View Solution
