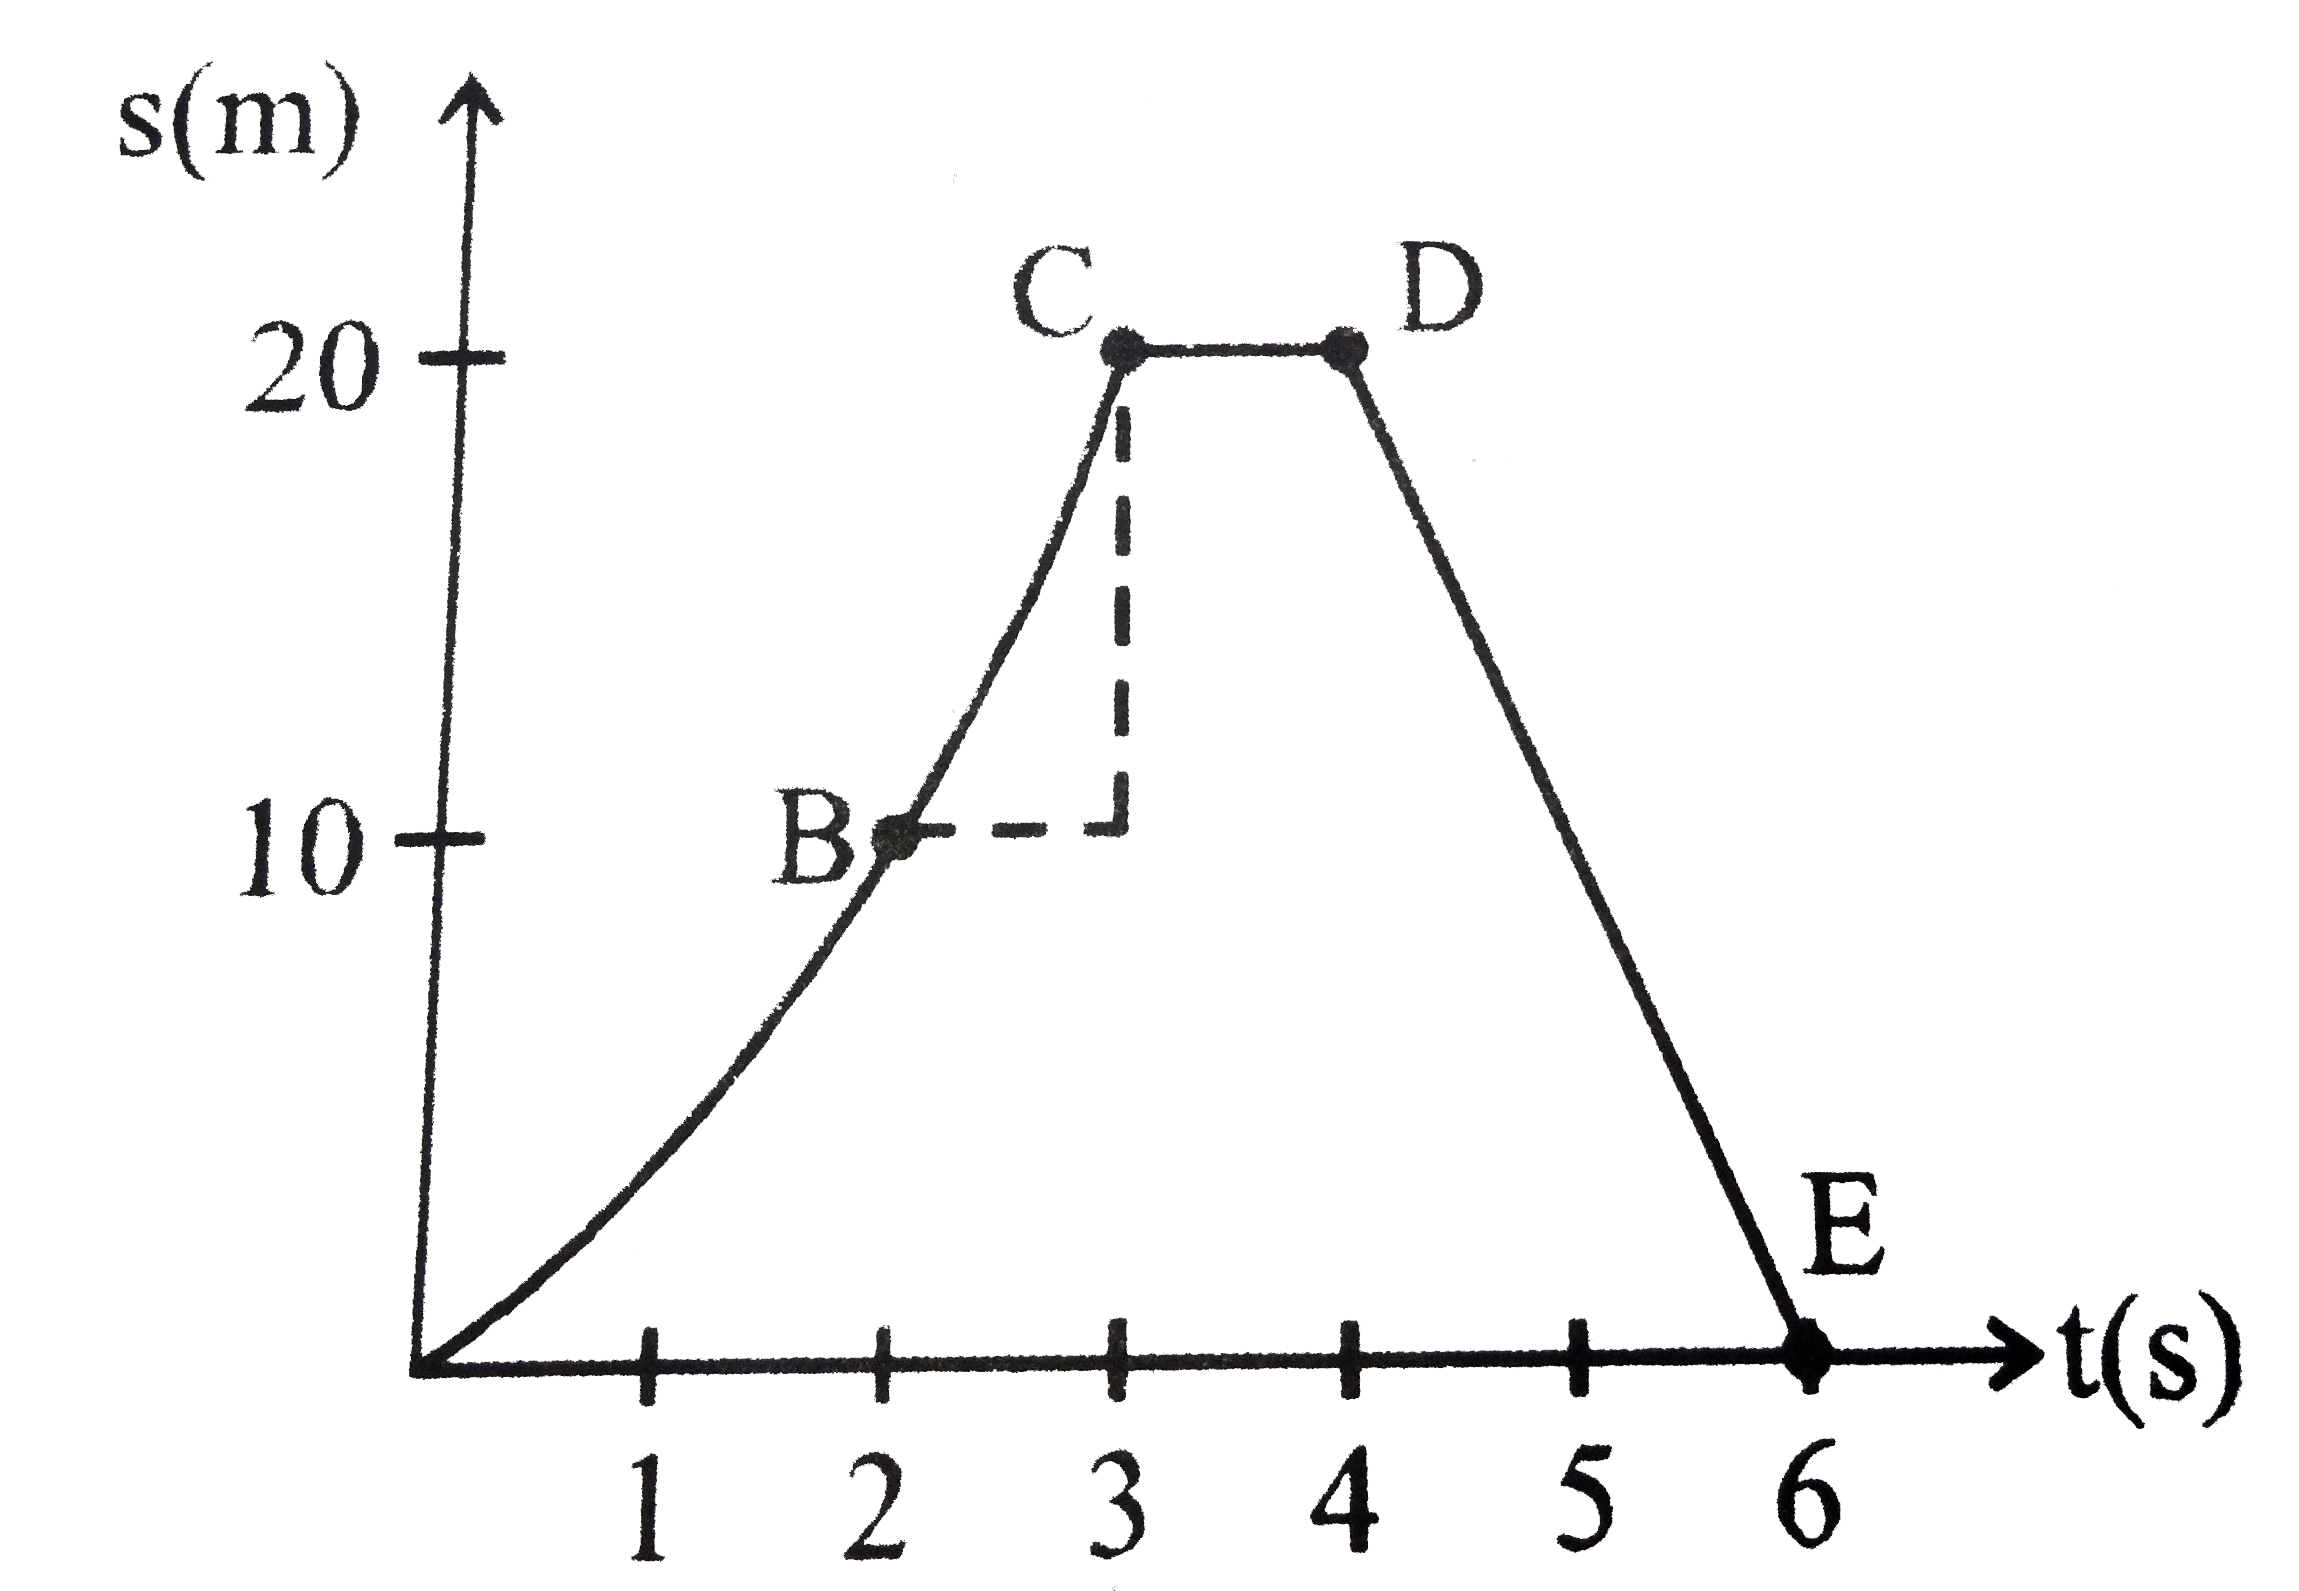
A football player catches a ball at his goal line (x=0) at t=0, and his motion is then graphed on the displacement vs. Time graph below.

(A) During which interval is the player accelerating away from his goal line?
(B) What is his velocity between points B and C?
(C ) describes his motion between points C and D.
(D) What is his velocity (magnitude and direction) during interval form 4s to 6s?
(A) The player is accelerating during the interval a to B, since the graph is parabolic. This tells us that his velocity is increasing as he runs away form the goal line.
(B) The player's velocity between point B and C is the slope of the line between these two points.
slope =
riserun=ΔxΔt=20m−10m3s−2s=10m/s
(C) During the interval from C to D, the time changes form 3s to 4s, but the player's position is not changing. He remains at rest at a distance of 20m form the goal line, and thus his velocity is zero during this time interval. We could also say that since the slope of the line is zero, his velocity is zero, and the is at rest.
(D) The players' velocity between 4s and 6s is found by the slope of the line in that interval.
slope =
riserun=ΔxΔt=0m−20m6s−4s=−10m/s
Since the slope is negative, the velocity is negative, which does not mean the player is followng down. A negative velocity means the player is runnning back toward his own, that is, the is moving backward compared to this motion in intervals AB and BC.
Similar Questions
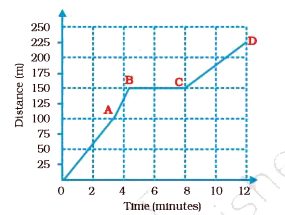
Boojho goes to the football ground to play football. The distance- time graph of his journey from his home to the ground is given as

(a) What does the graph between point B and C indicate about the motion of Boojho?
(b) Is the motion between 0 to 4 minutes uniform or non- uniform?
(c) What is his speed between 8 and 12 minutes of his journey?
View SolutionExplain why a player lowers his hands while catching a cricket ball.
View Solution
Knowledge Check
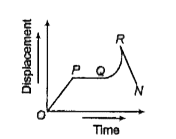
The graph between displacement and time in a motion along straight line is depicted below. Which interval indicates that no force is acting on the particle?
 ARSBQRCPQDOP
The graph between displacement and time in a motion along straight line is depicted below. Which interval indicates that no force is acting on the particle?
 ARSBQRCPQDOP
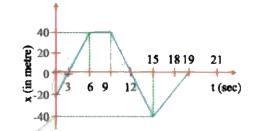
A person walks along an east-west street and a graph of his displacement from home is shown in figure. His average velocity for the whole time interval is :-
 A1.05 ms−1B23 ms−1C8.4 ms−1DNone of above
What can you say about the motion of a body if :
(a) its displacement-time graph is a straight line ?
(b) its velocity-time graph is a straight line ?
View SolutionHe is very the best player in his cricket team.
View SolutionA young boy can adjust the power of his eye lens between 50 D and 60 D. His far point is infinity. A. What is the distance of his retina from the eye-lens? b. What is the near point?
View SolutionDescuss the motion of an object under free fall and draw (a) acceleration-time , (b) velocity-time and (c ) position-time graph for this motion .
View SolutionA person walks away from his house at 8:00 am and observes his shadow to his right. Then, he turns towards his left and then again towards his right. Which direction is he facing now?
View Solution