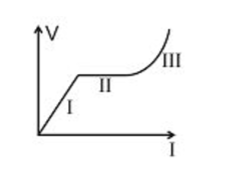
Voltage V v/s I graph is shown in the figure.
resistance in region I is ohmic, II & III are non-ohmic
resistance in region II is zero and III is ohmic
resistance in region II is zero and III is non-ohmic
in I it is ohmic, II it is non-ohmic
The correct Answer is:C
In II region : ΔV=0, Hence R = 0
In III region V is not directly proportional to I.
hence region III is non-ohmic.
Topper's Solved these Questions
Similar Questions
Knowledge Check
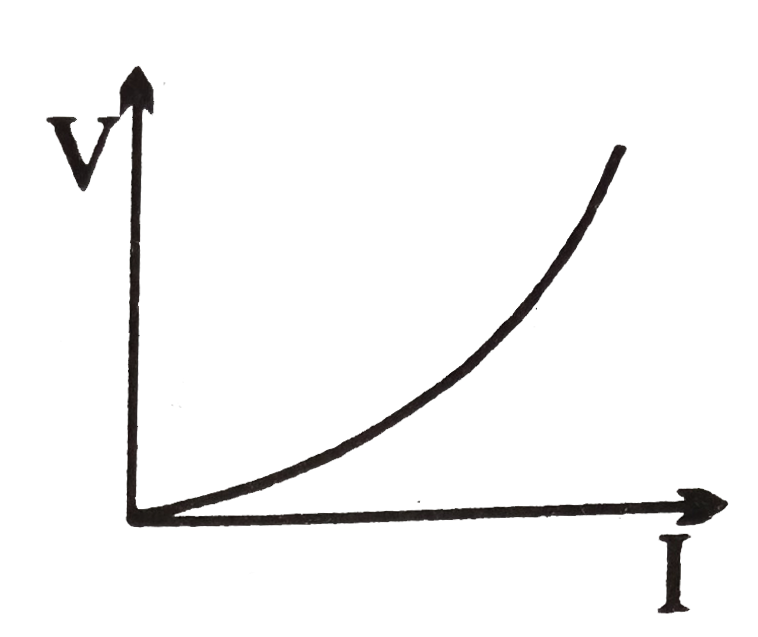
The variation of current (I) and voltage (V) is as shown in figure A. The variation of power P with current I is best shown by which of the following graph
 A
A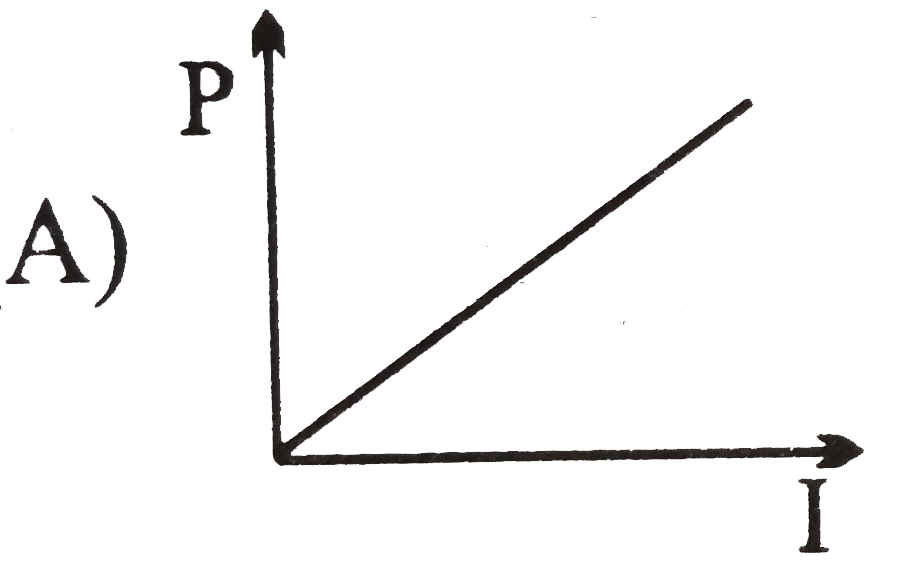 B
B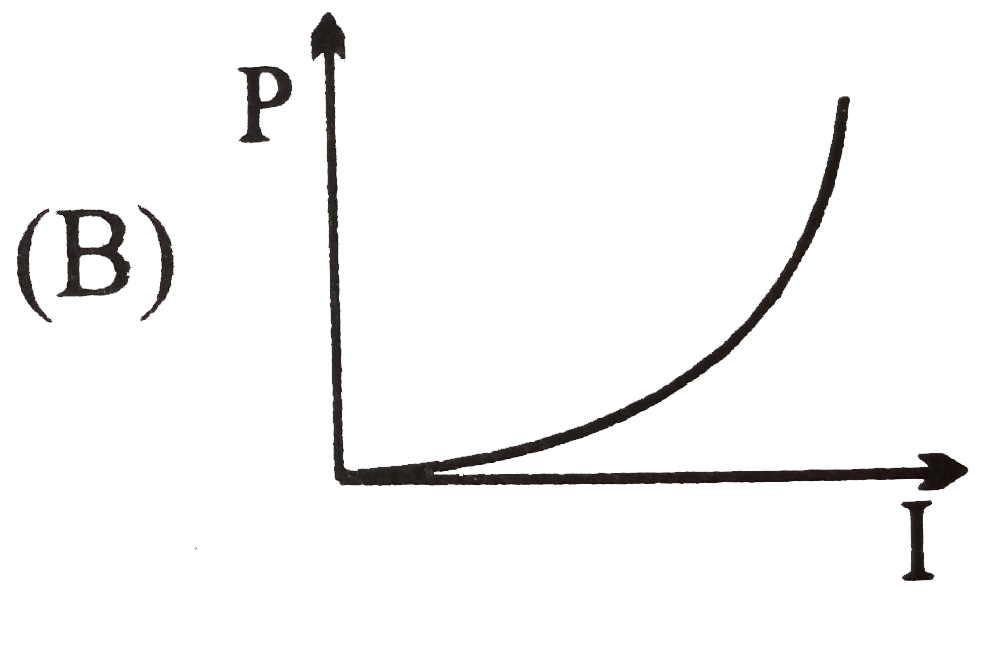 C
C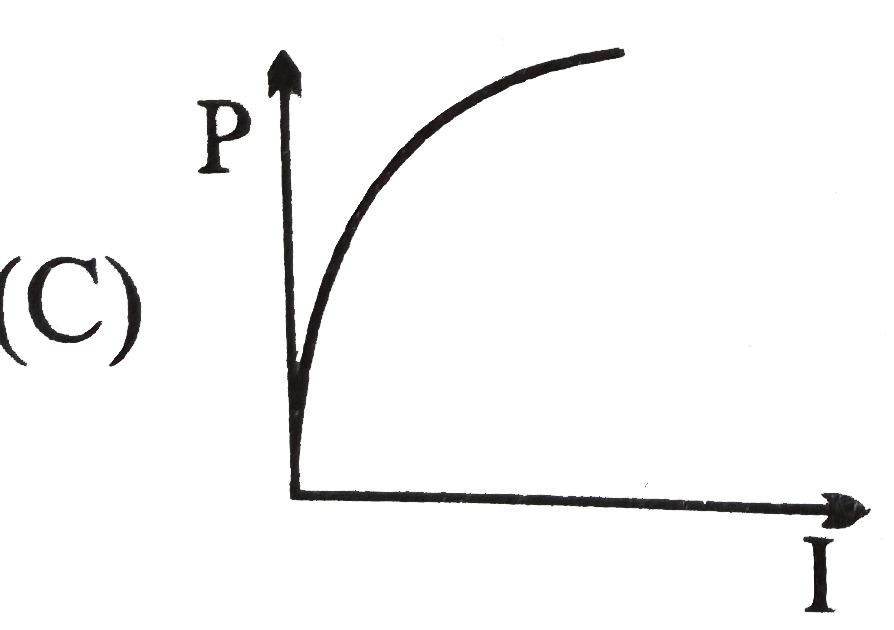 D
D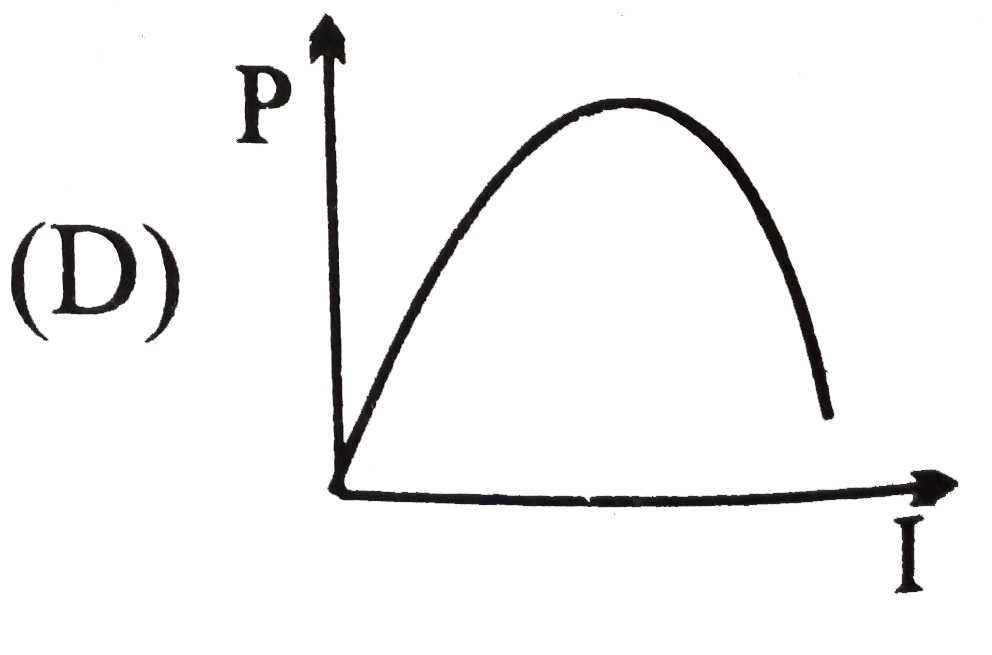
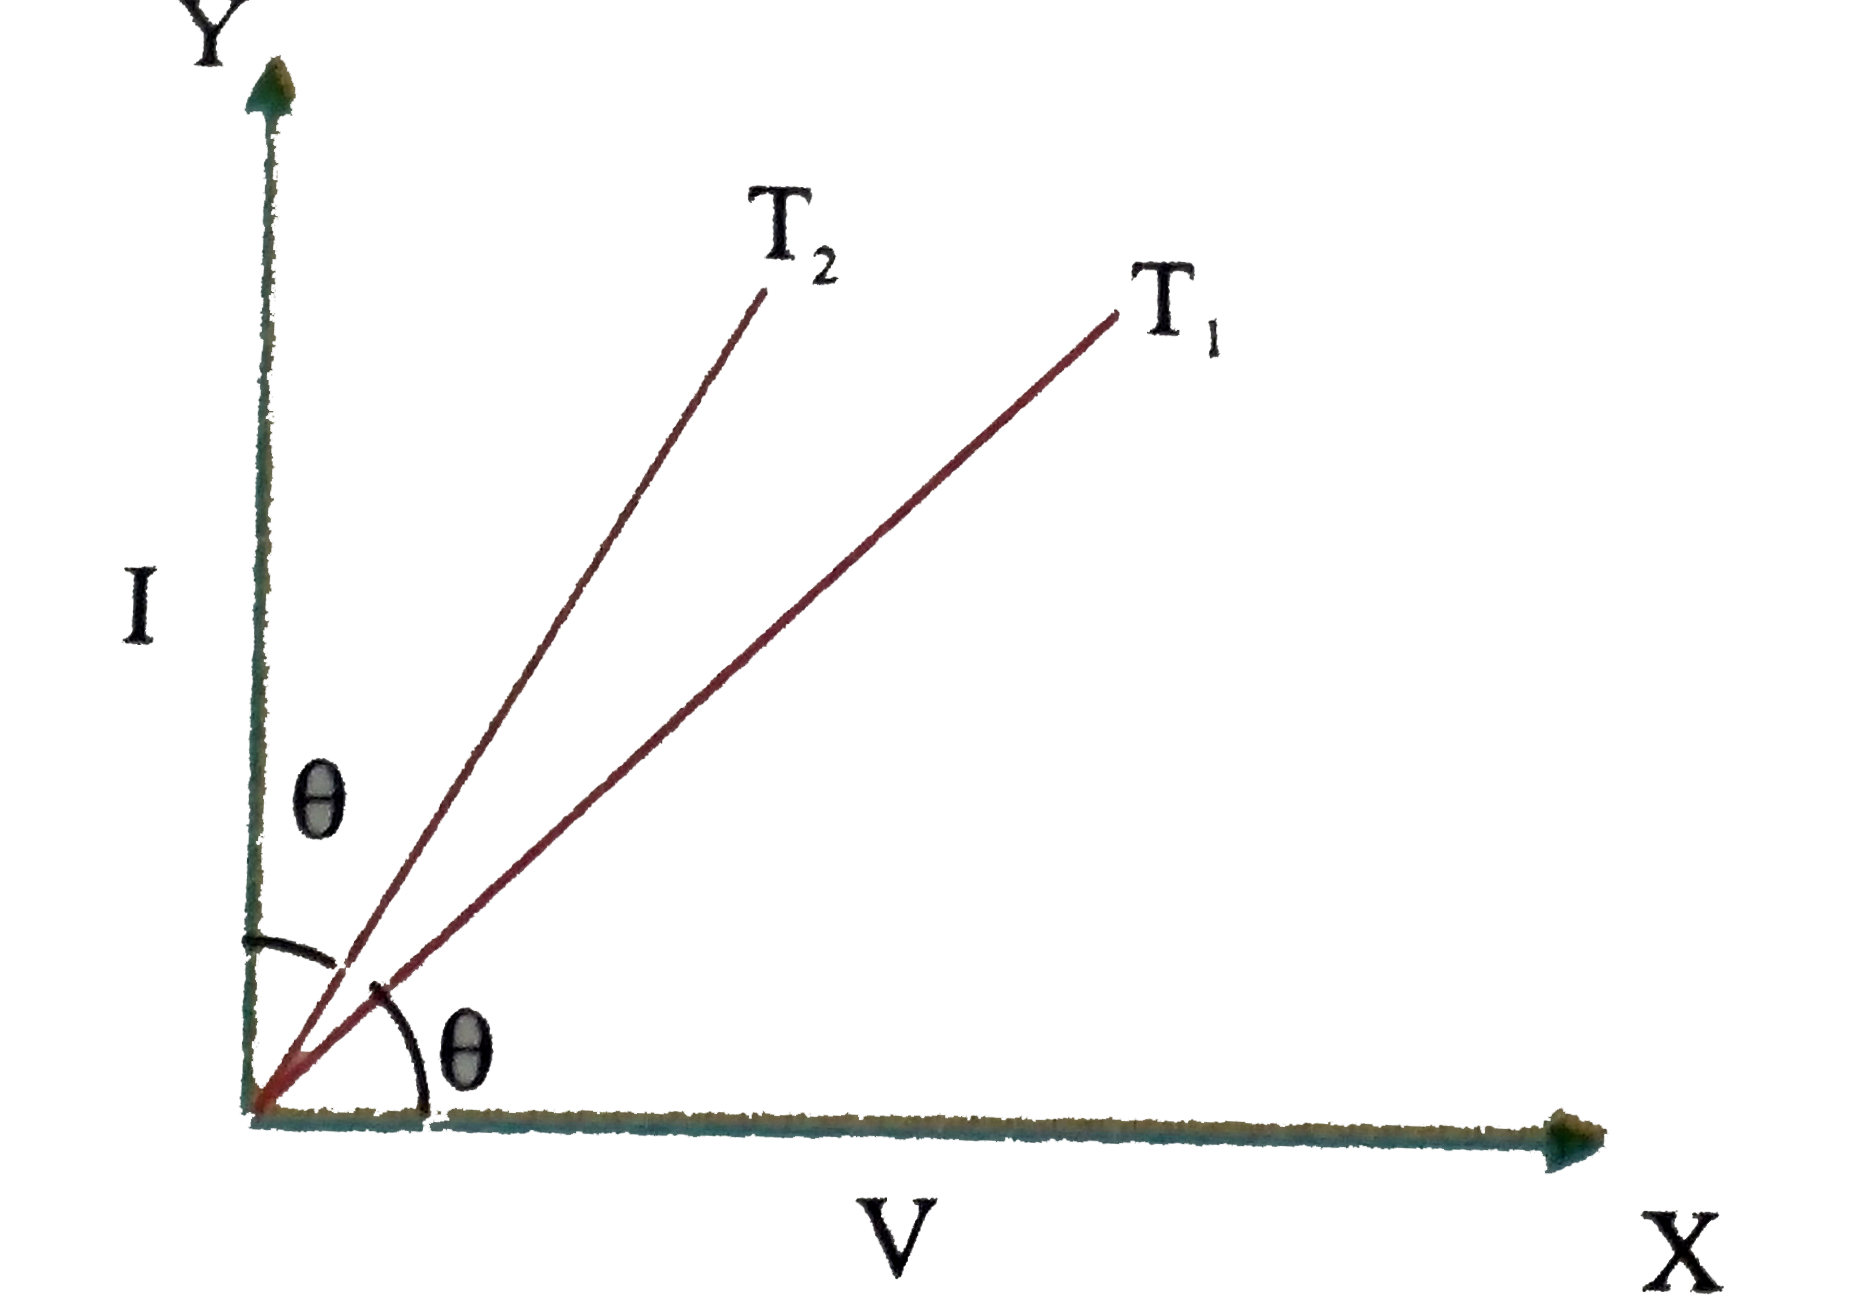
V−I graphs for a material is shown in the figure. The graphs are drawn at two different temperatures.AT1−T2∝cot2θBT1−T2∝sin2θCT1−T2∝tan2θDT1−T2∝cos2θ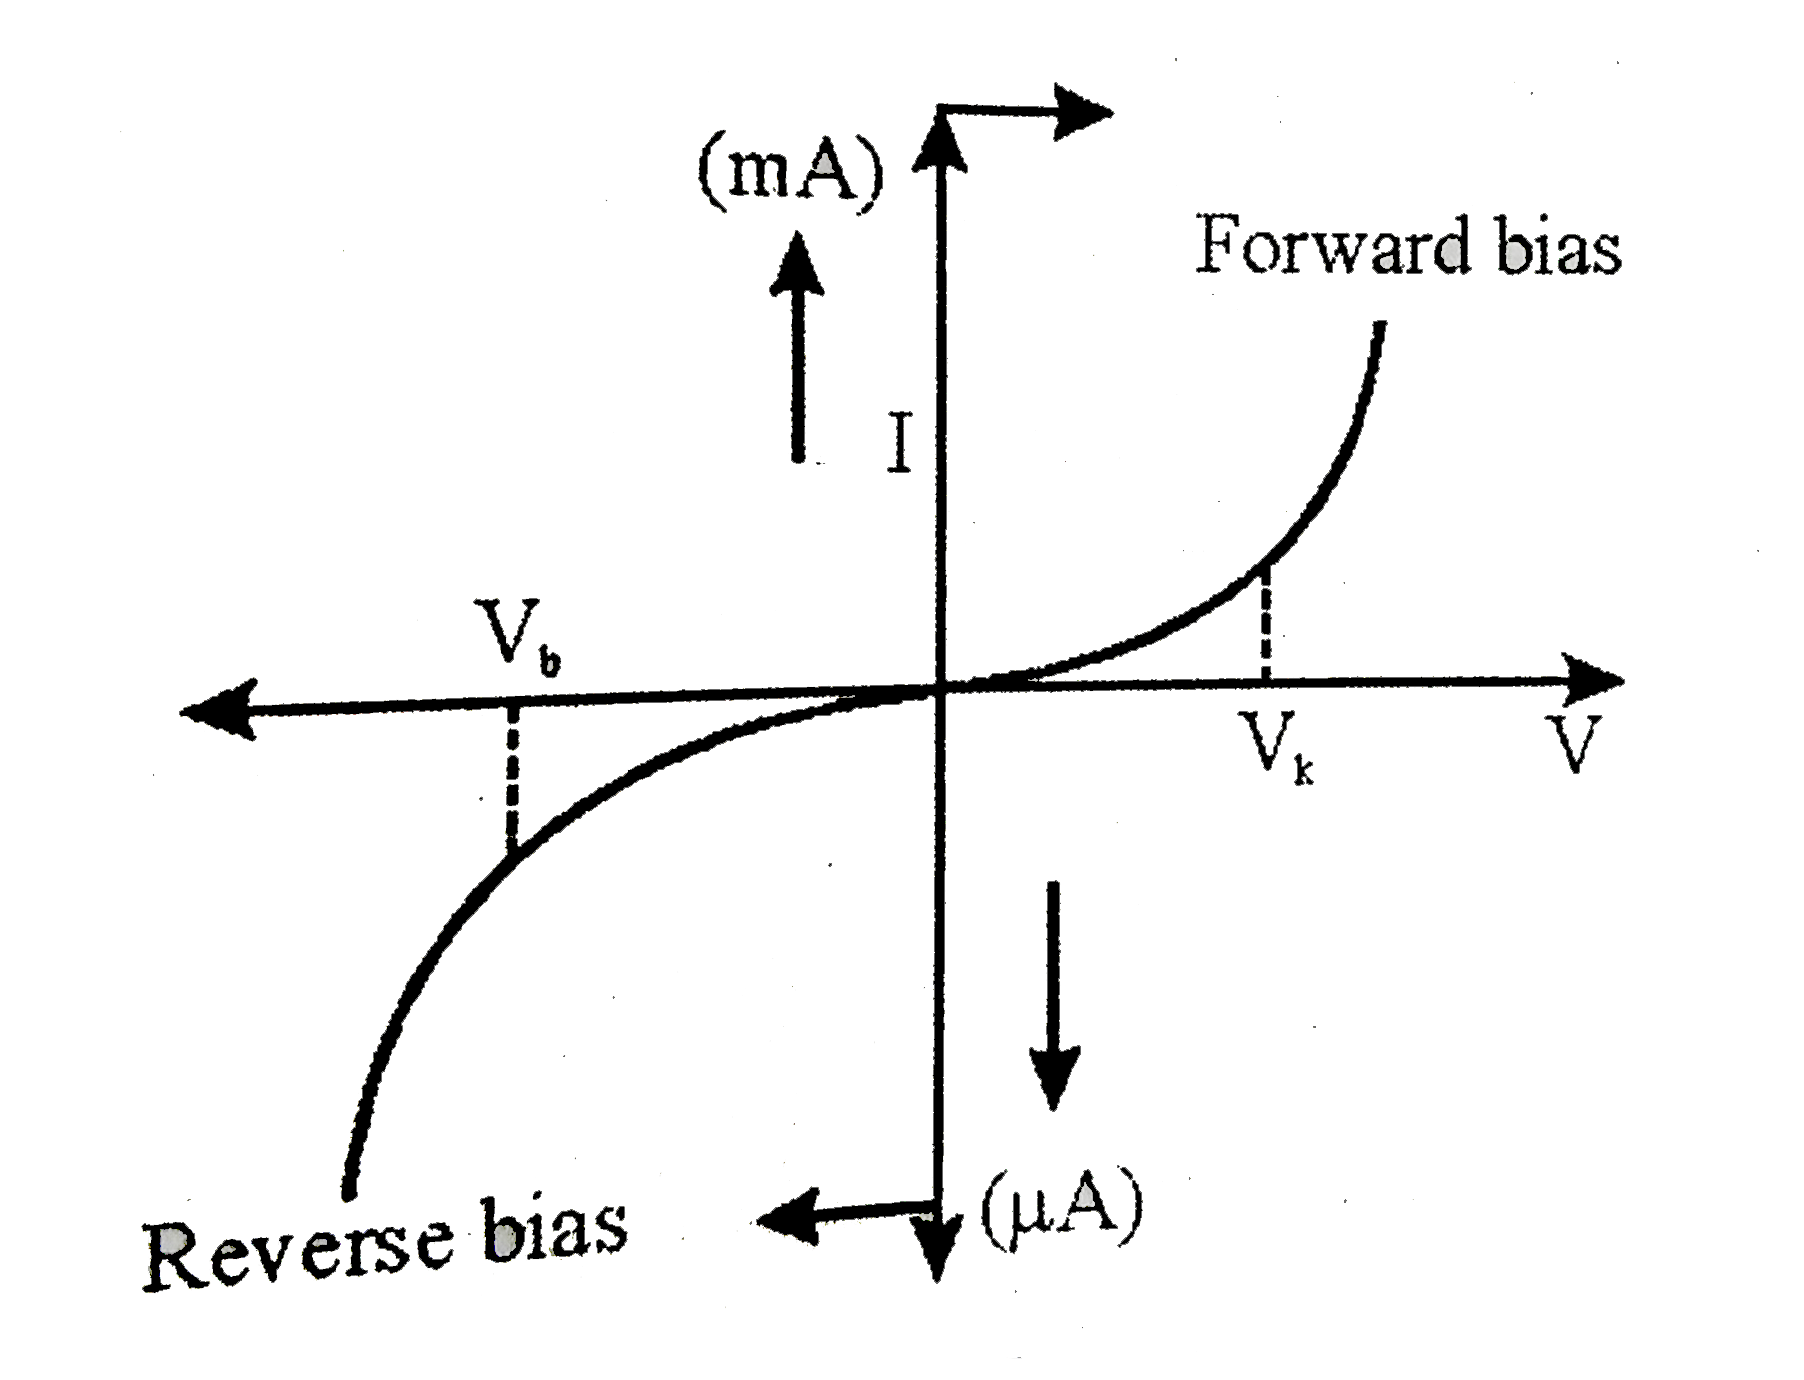
The V-I characterisctic for a p-n junction diode is plotted as shown in the figure. From the plot we can conclude that
[Vb→ breakdown voltage, Vk→ knee voltage]Athe forward bias resistance of diode is very high, almost infinity for small values of V and after a certain value it becomes very lowBthe reverse bias resistance of diode is very high in the beginning upto breakdown voltage is not achievedCboth forward and reverse bias resistances are same for all voltagesDboth (A) and (B) are correct
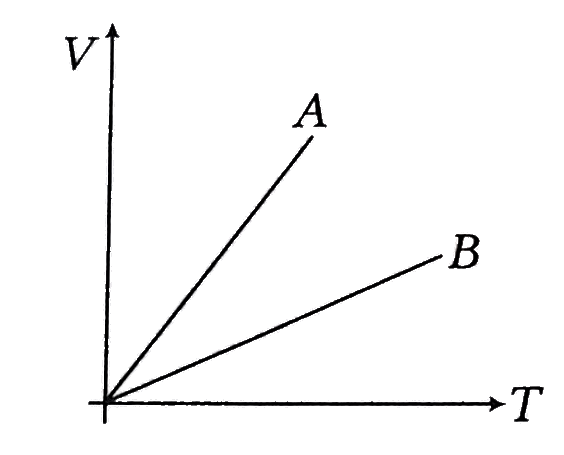
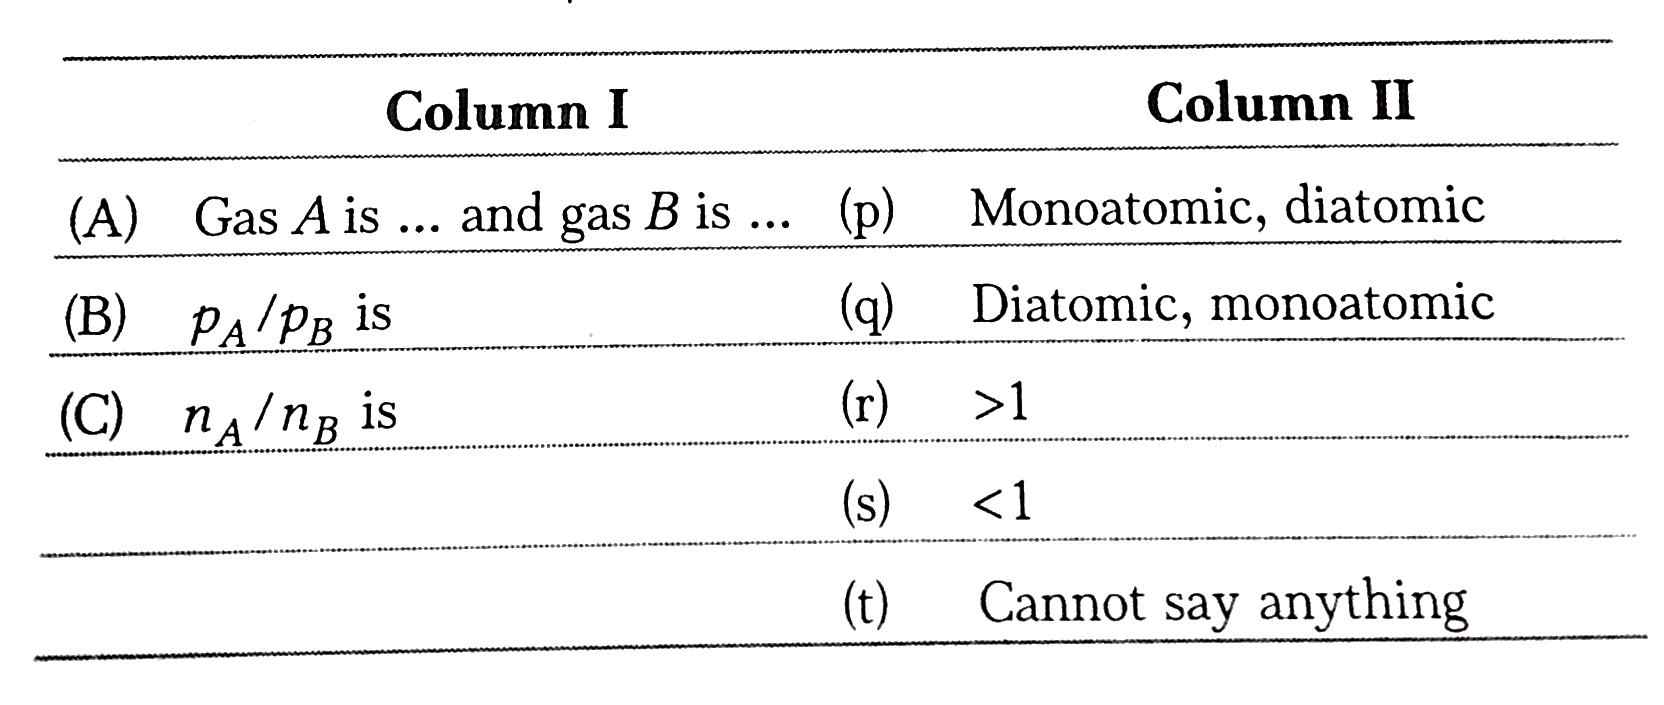
In the V-T graph shown in the figure match the following columns.
View SolutionA periodic voltage V varies with time t as shown in figure. T is the time period. Find the runs value of the voltage.
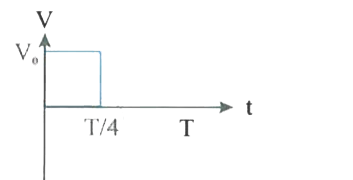
View SolutionA periodic voltage V varies with time t as shown in figure. T is the time period. Find the rms value of the voltage.

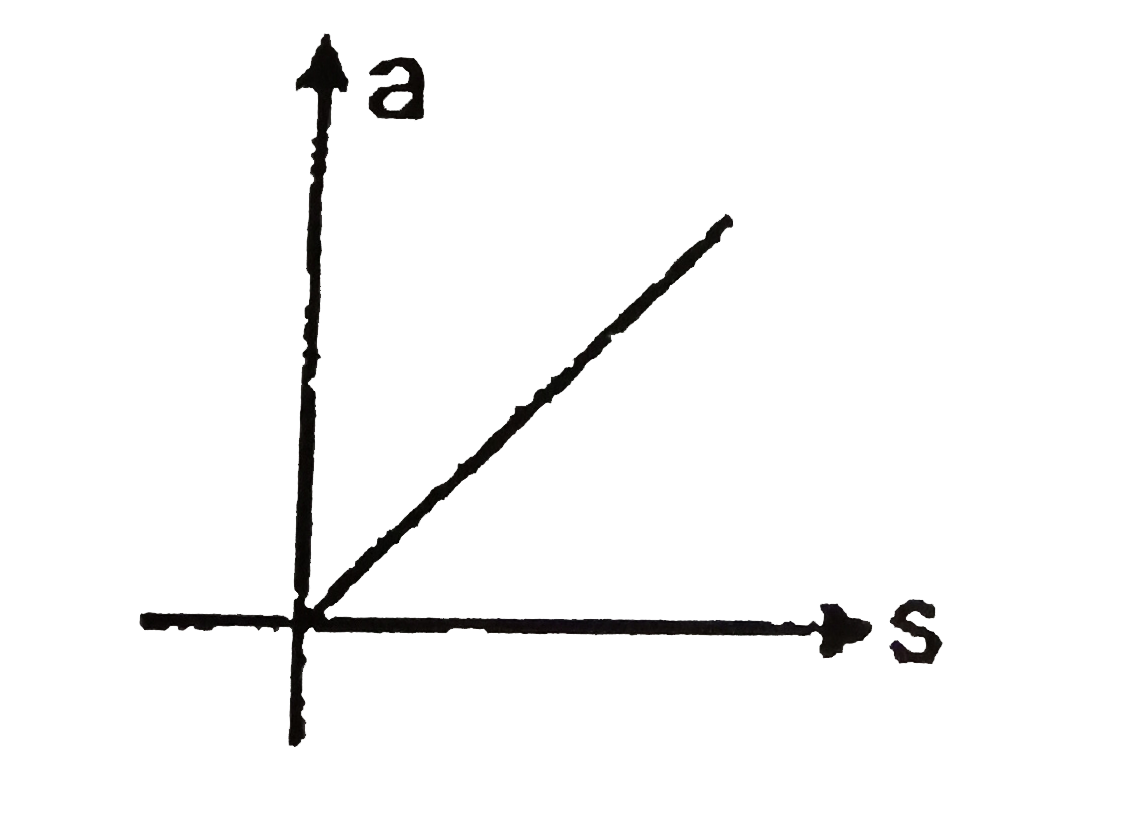
View SolutionAcceleration (a) -displacement (s) graph of a particle moving in a straight line is as shown in the figure. The initial velocity of the particle is zero. The v−s graph of the particle would be
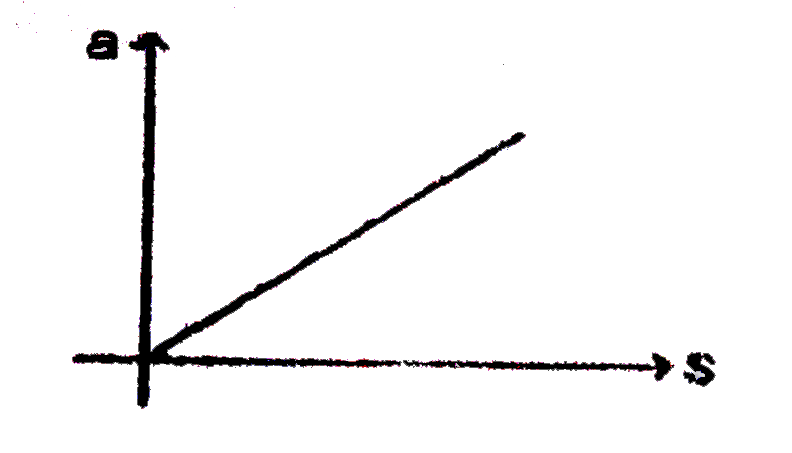
View SolutionAcceleration v/s displacement graph of a particle moving in a straight line is as shown in the figure. The initial velocity of the particle is zero. The velocity v/s displacement graph of the particle would be :
View Solution

