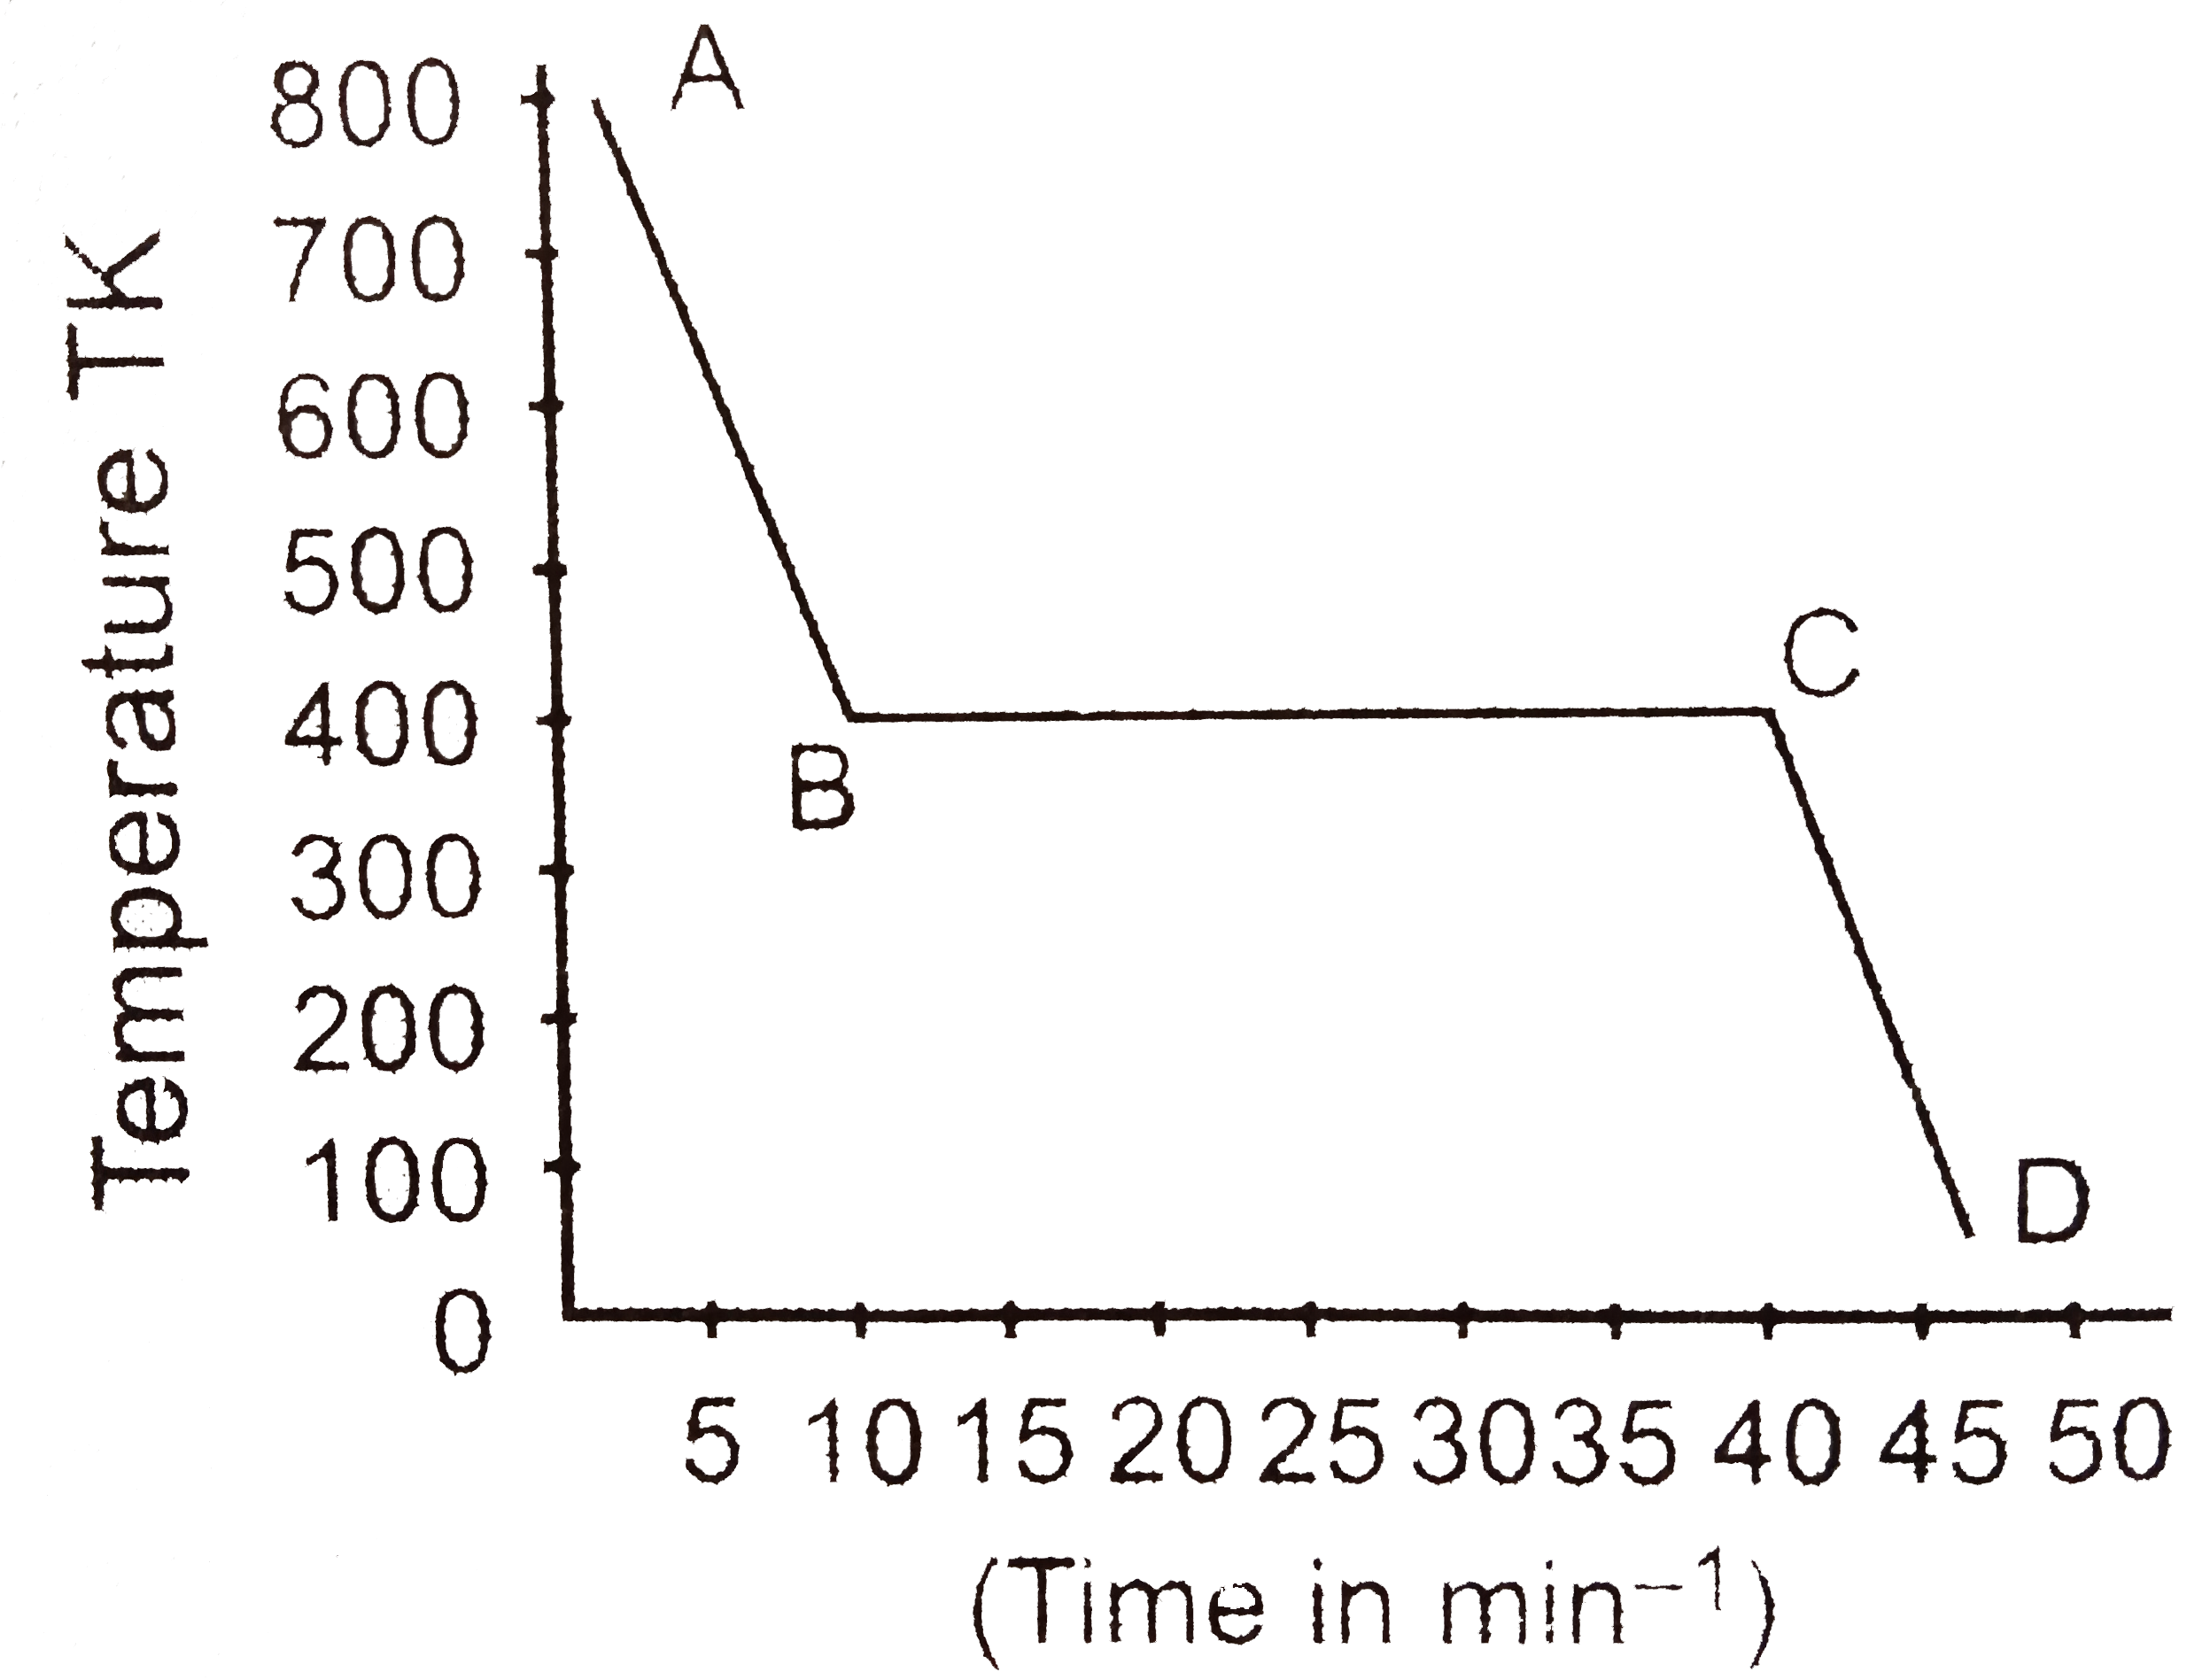
The graph given in daigram represents a cooling curve for a substance being cooled form its vapour to soild phase by releasing heat at a constant rate of 100Js−1

What happens in the region DE ?
The rgion DE represent freezing of the substance where the liquid changes into solid at a constant temperature (=100∘C)
Related Playlists
- BOOK - CHETAN PUBLICATIONCHAPTER - HEATEXERCISE - Paragraph Based Question .4videos
HEAT
- BOOK - CHETAN PUBLICATIONCHAPTER - HEATEXERCISE - ASSIGNMENT - 5 (Answer the following)3videos
HEAT
- BOOK - CHETAN PUBLICATIONCHAPTER - HEATEXERCISE - Darw a neat and labelled diagram.4videos
HEAT
- BOOK - CHETAN PUBLICATIONCHAPTER - GRAVITATIONEXERCISE - ASSIGNMENT-115videos
GRAVITATION
- BOOK - CHETAN PUBLICATIONCHAPTER - LENSESEXERCISE - Assignment14videos
LENSES
Similar Questions
Read the following paragraph carefully and answer the following question .
If the heat is exchanged between a hot and cold object, the temperature of the cold object goes on increasing due to gain of energy and the temperature of the hot object goes on decreasing due to loss of energy .
The change in temperature continues till the temperatures of both the the object attain the same value . In the process, the cold object gains heat energy and the hot objet lose heat energy . If the system of both the object is isolated from the environment by keeping it inside a heat resistance box ( meaning that the energy exchange takes place between the two object only), then no energy can flow from inside the box or come into the box.
Heat is transferred from where to where ?04:53View SolutionWhat is Specific latent heat of fusion?
02:05View SolutionHope' s apparatus.
02:34View SolutionThe value of g at the centre of the Earth is zero. Explain?
04:44View SolutionThe defect of myopia can be corrected by using ___________ .
04:14View SolutionOne mole of a substance is cooled at the rate of 0.4kJ−1min as shown in the graph. Curve AB, points B and C and curve CD represent respectively, the cooling of the liquid, start of freezing, completion of freezing and cooling of the solid based on this data. The entropy of fusion in JmolK−1 is :
 04:26View Solution
What happens if water vapour at a pressure of 0.003 atmosphere is cooled to 0∘C?
01:57View SolutionA block of steel heated to 100^(@)C is left in a room to cool Which of the curves shown in the represents the correct behaviour .
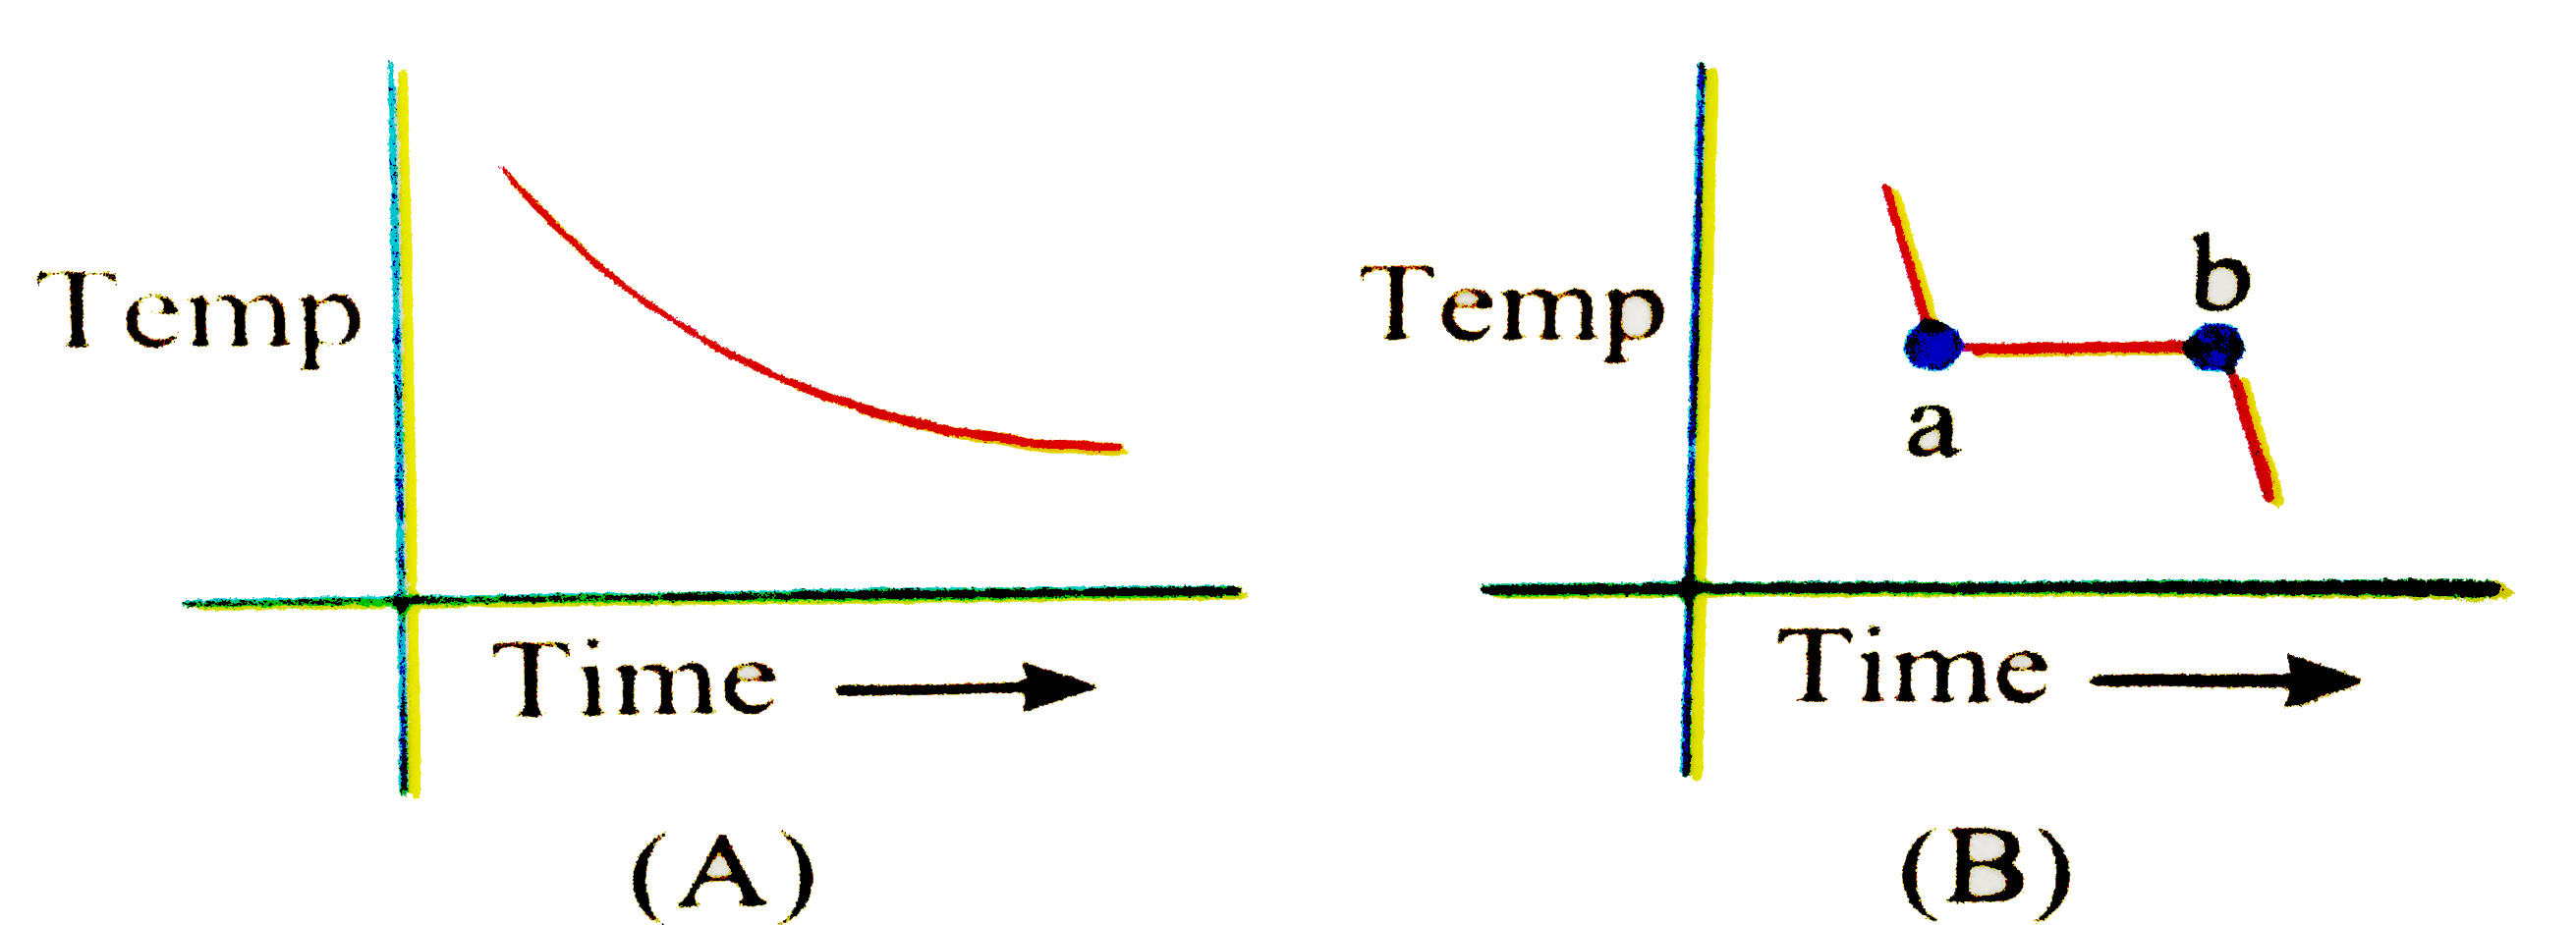
02:43View SolutionCooling curves for amorophous and crystalline substances represented as follows

Collect statement regards (A) and (B) graphs03:05View Solutioni) DNA को 100∘ C तक गर्म किया जाये तो क्या होगा?
ii) विकृत DNA को ठण्डा किया जाये तो क्या होगा?01:57View SolutionGraph of rate of cooling against time is (assume Newton's law of cooling)
03:39View SolutionIf a substance is heated or cooled, the change in mass of that substance is
04:27View Solutionन्यूटन के शीतलन के नियम से शीतलन की दर होती है
02:53View SolutionA block of steel heated to 100∘C left in a room to cool. Which of the following curves represent the correct behaviour ?
 02:50View Solution
If a substance is heated or cooled, the change in mass of that substance is
03:19View Solutionजल की शीतलन की प्रक्रिया में ऊष्मा का क्या होता है?
01:32View Solution

