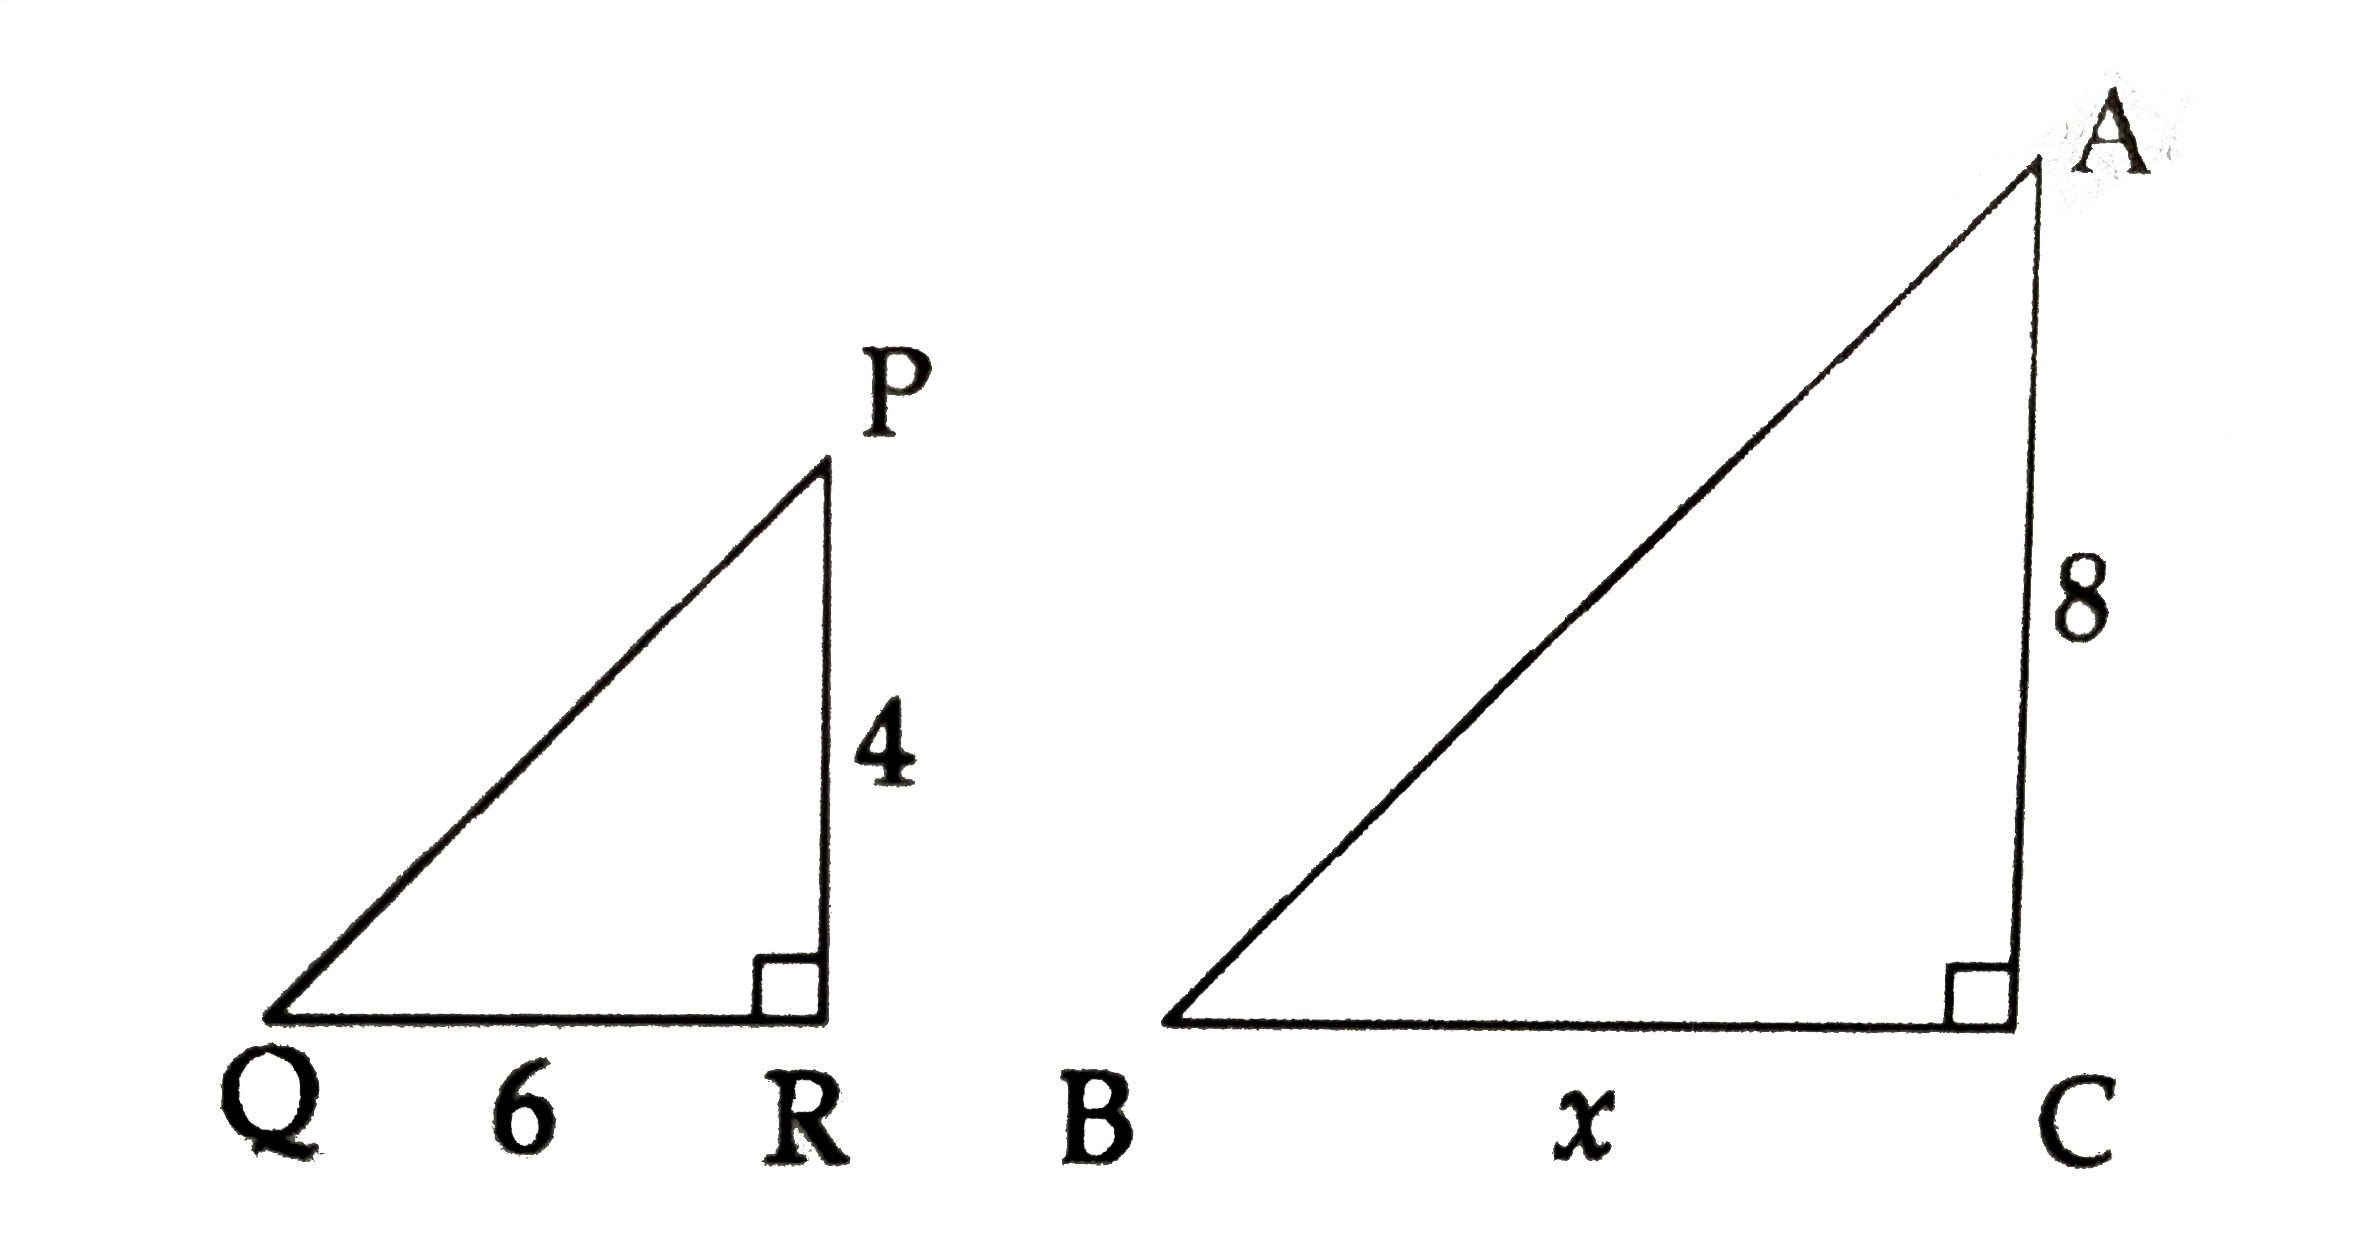
As shown in adjoining figure , two poles of height 8 m and 4 mare perpendicular to ground . If the length of shodow of smaller pole due to sunlight is 6 m then how long will be the shadow of bigger pole at at the same time?
 Solution in Tamil
The correct Answer is:Length of the shadow catsed by longer pole is 12 m .
Step by step video & image solution for As shown in adjoining figure , two poles of height 8 m and 4 mare perpendicular to ground . If the length of shodow of smaller pole due to sunlight is 6 m then how long will be the shadow of bigger pole at at the same time? by Maths experts to help you in doubts & scoring excellent marks in Class 10 exams.
Updated on:21/07/2023Topper's Solved these Questions
- SIMILARITY Book:CHETAN PUBLICATIONChapter:SIMILARITY Exercise:Practice Set - 1.4
Explore 7 Videos
- SIMILARITY Book:CHETAN PUBLICATIONChapter:SIMILARITY Exercise:Problem Set - 1
Explore 12 Videos
- SIMILARITY Book:CHETAN PUBLICATIONChapter:SIMILARITY Exercise:Practice Set - 1.2
Explore 13 Videos
- QUADRATIC EQUATIONSBook:CHETAN PUBLICATIONChapter:QUADRATIC EQUATIONSExercise:ASSIGNMENT
Explore 12 Videos
- STANDARD IX SYLLABUS Book:CHETAN PUBLICATIONChapter:STANDARD IX SYLLABUS Exercise:PROBLEMS FOR PRACTICE
Explore 20 Videos
Similar Questions
If ΔABC~ΔPQRandAB:AP=2:3 , then fill in the blanks.
A(△ABC)A(△PQR)=(AB)2(PQ)2=2232=□□
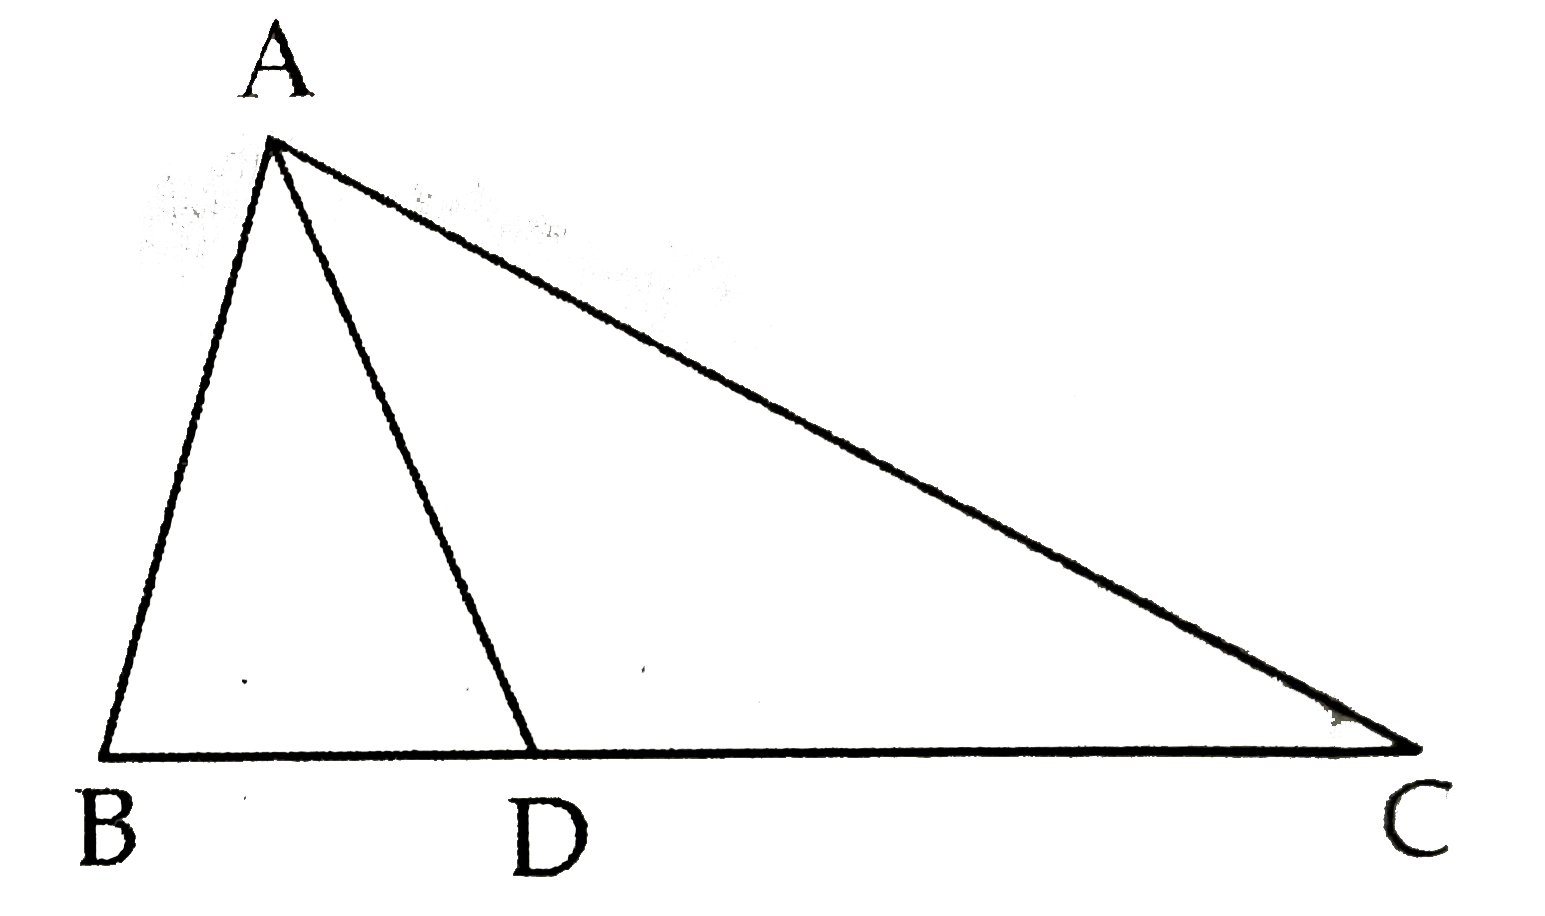
View SolutionIn ΔABC,B−D−CandBD=7,BC=20 Then find the following ratio.
A(ΔABD)A(ΔADC)

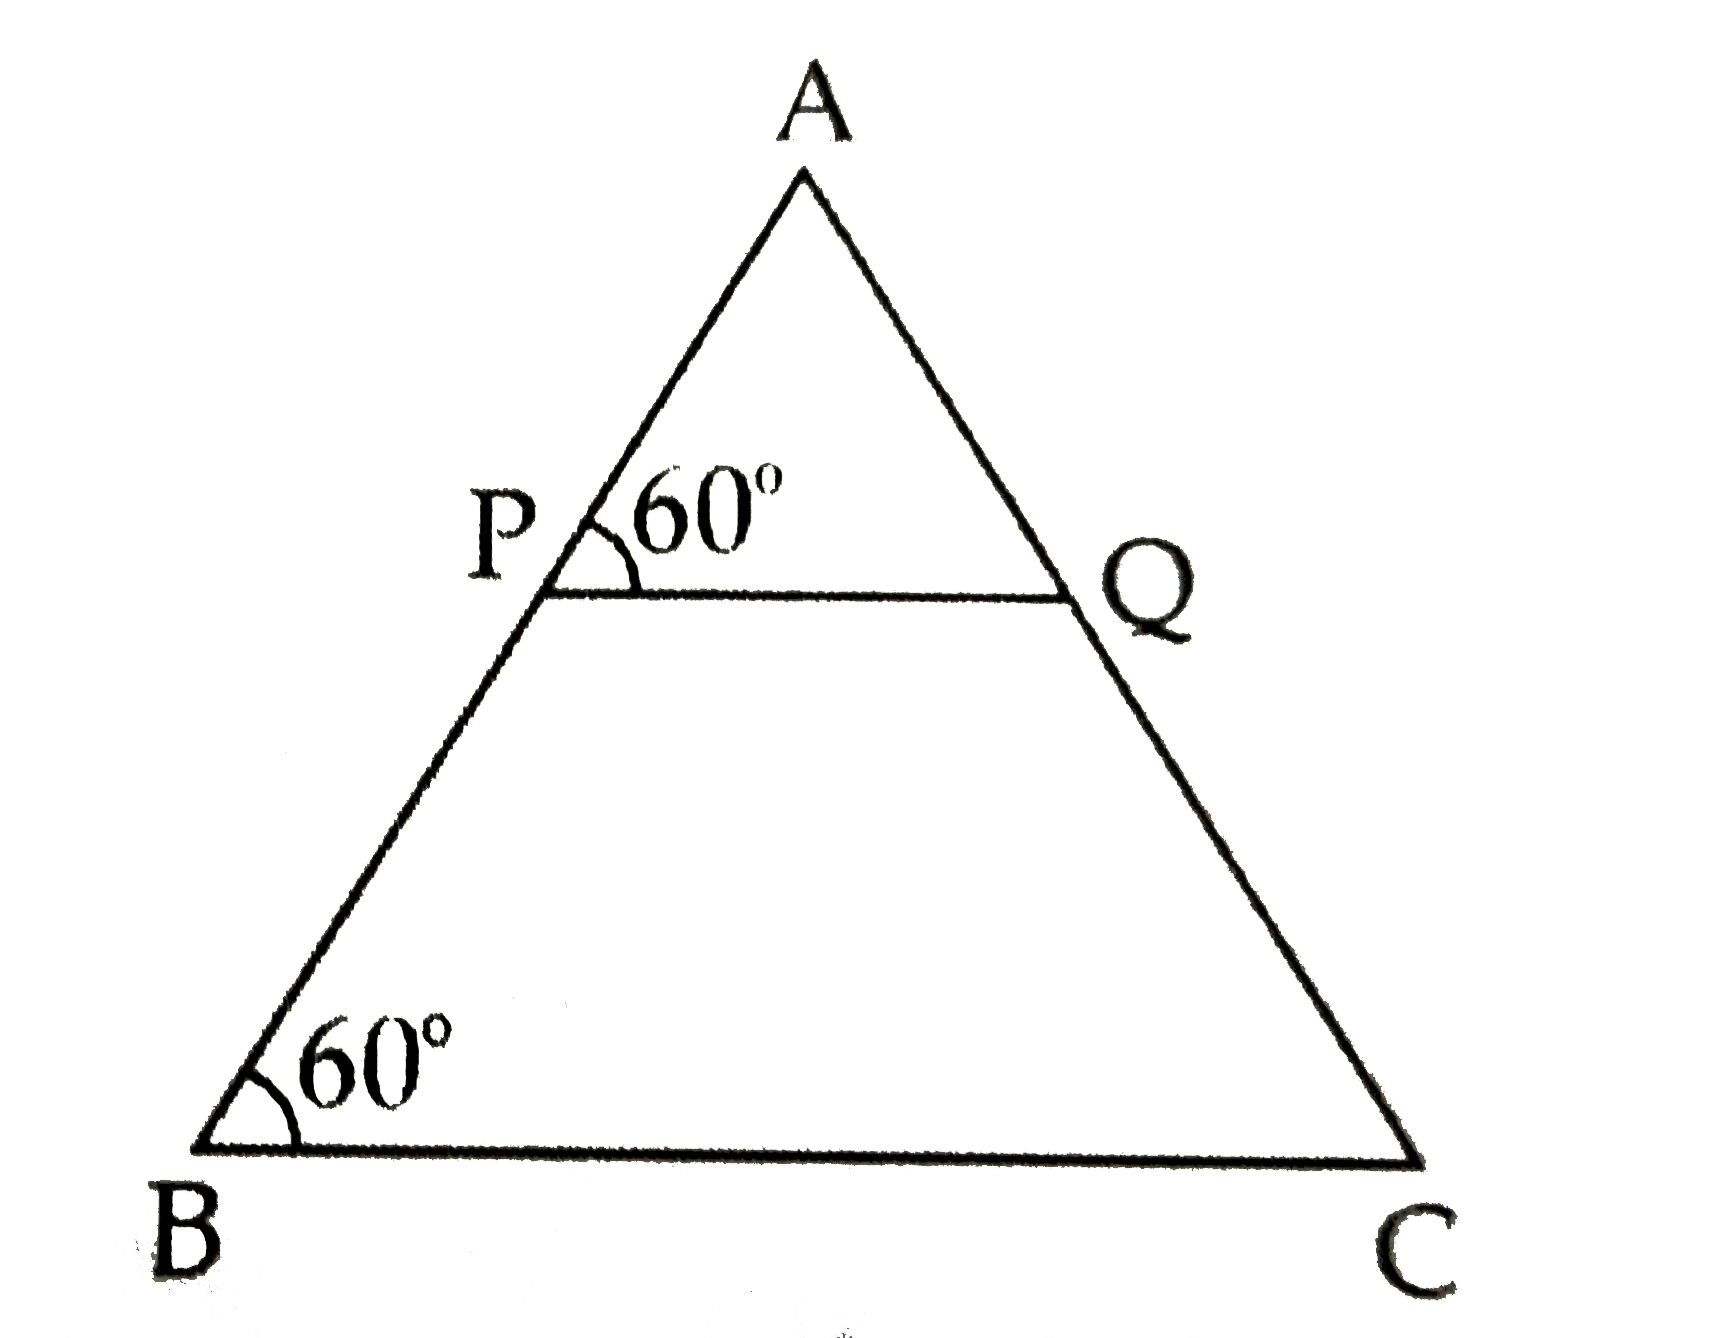
View SolutionMeasurements of the some angles in the figure are given . Prove that APPB=AQQC

View SolutionIf α and β are the roots of quadratic equation 2x2+4x+3=0, then the value of α+β=
View SolutionDraw segment PQ=4.3cm and bisect it.
View SolutionHow many lines of symmetry does the above figure have ?
View SolutionDetermine the point of symmetry of a regular hexagon.
View SolutionDtermine the images of the following figure about the given line :
View SolutionMatch the following Column A to Column B

View SolutionMatch the following Column A to Column B

View SolutionMatch the following Column A to Column B

View SolutionThe inequation represented by the graph given below is :
View SolutionThe inequation that best describes the graph given below is _________
View SolutionThe inequation that best describes the following graph is _________
View SolutionWhich inequations represent the shaded region in the given figure
View Solution

