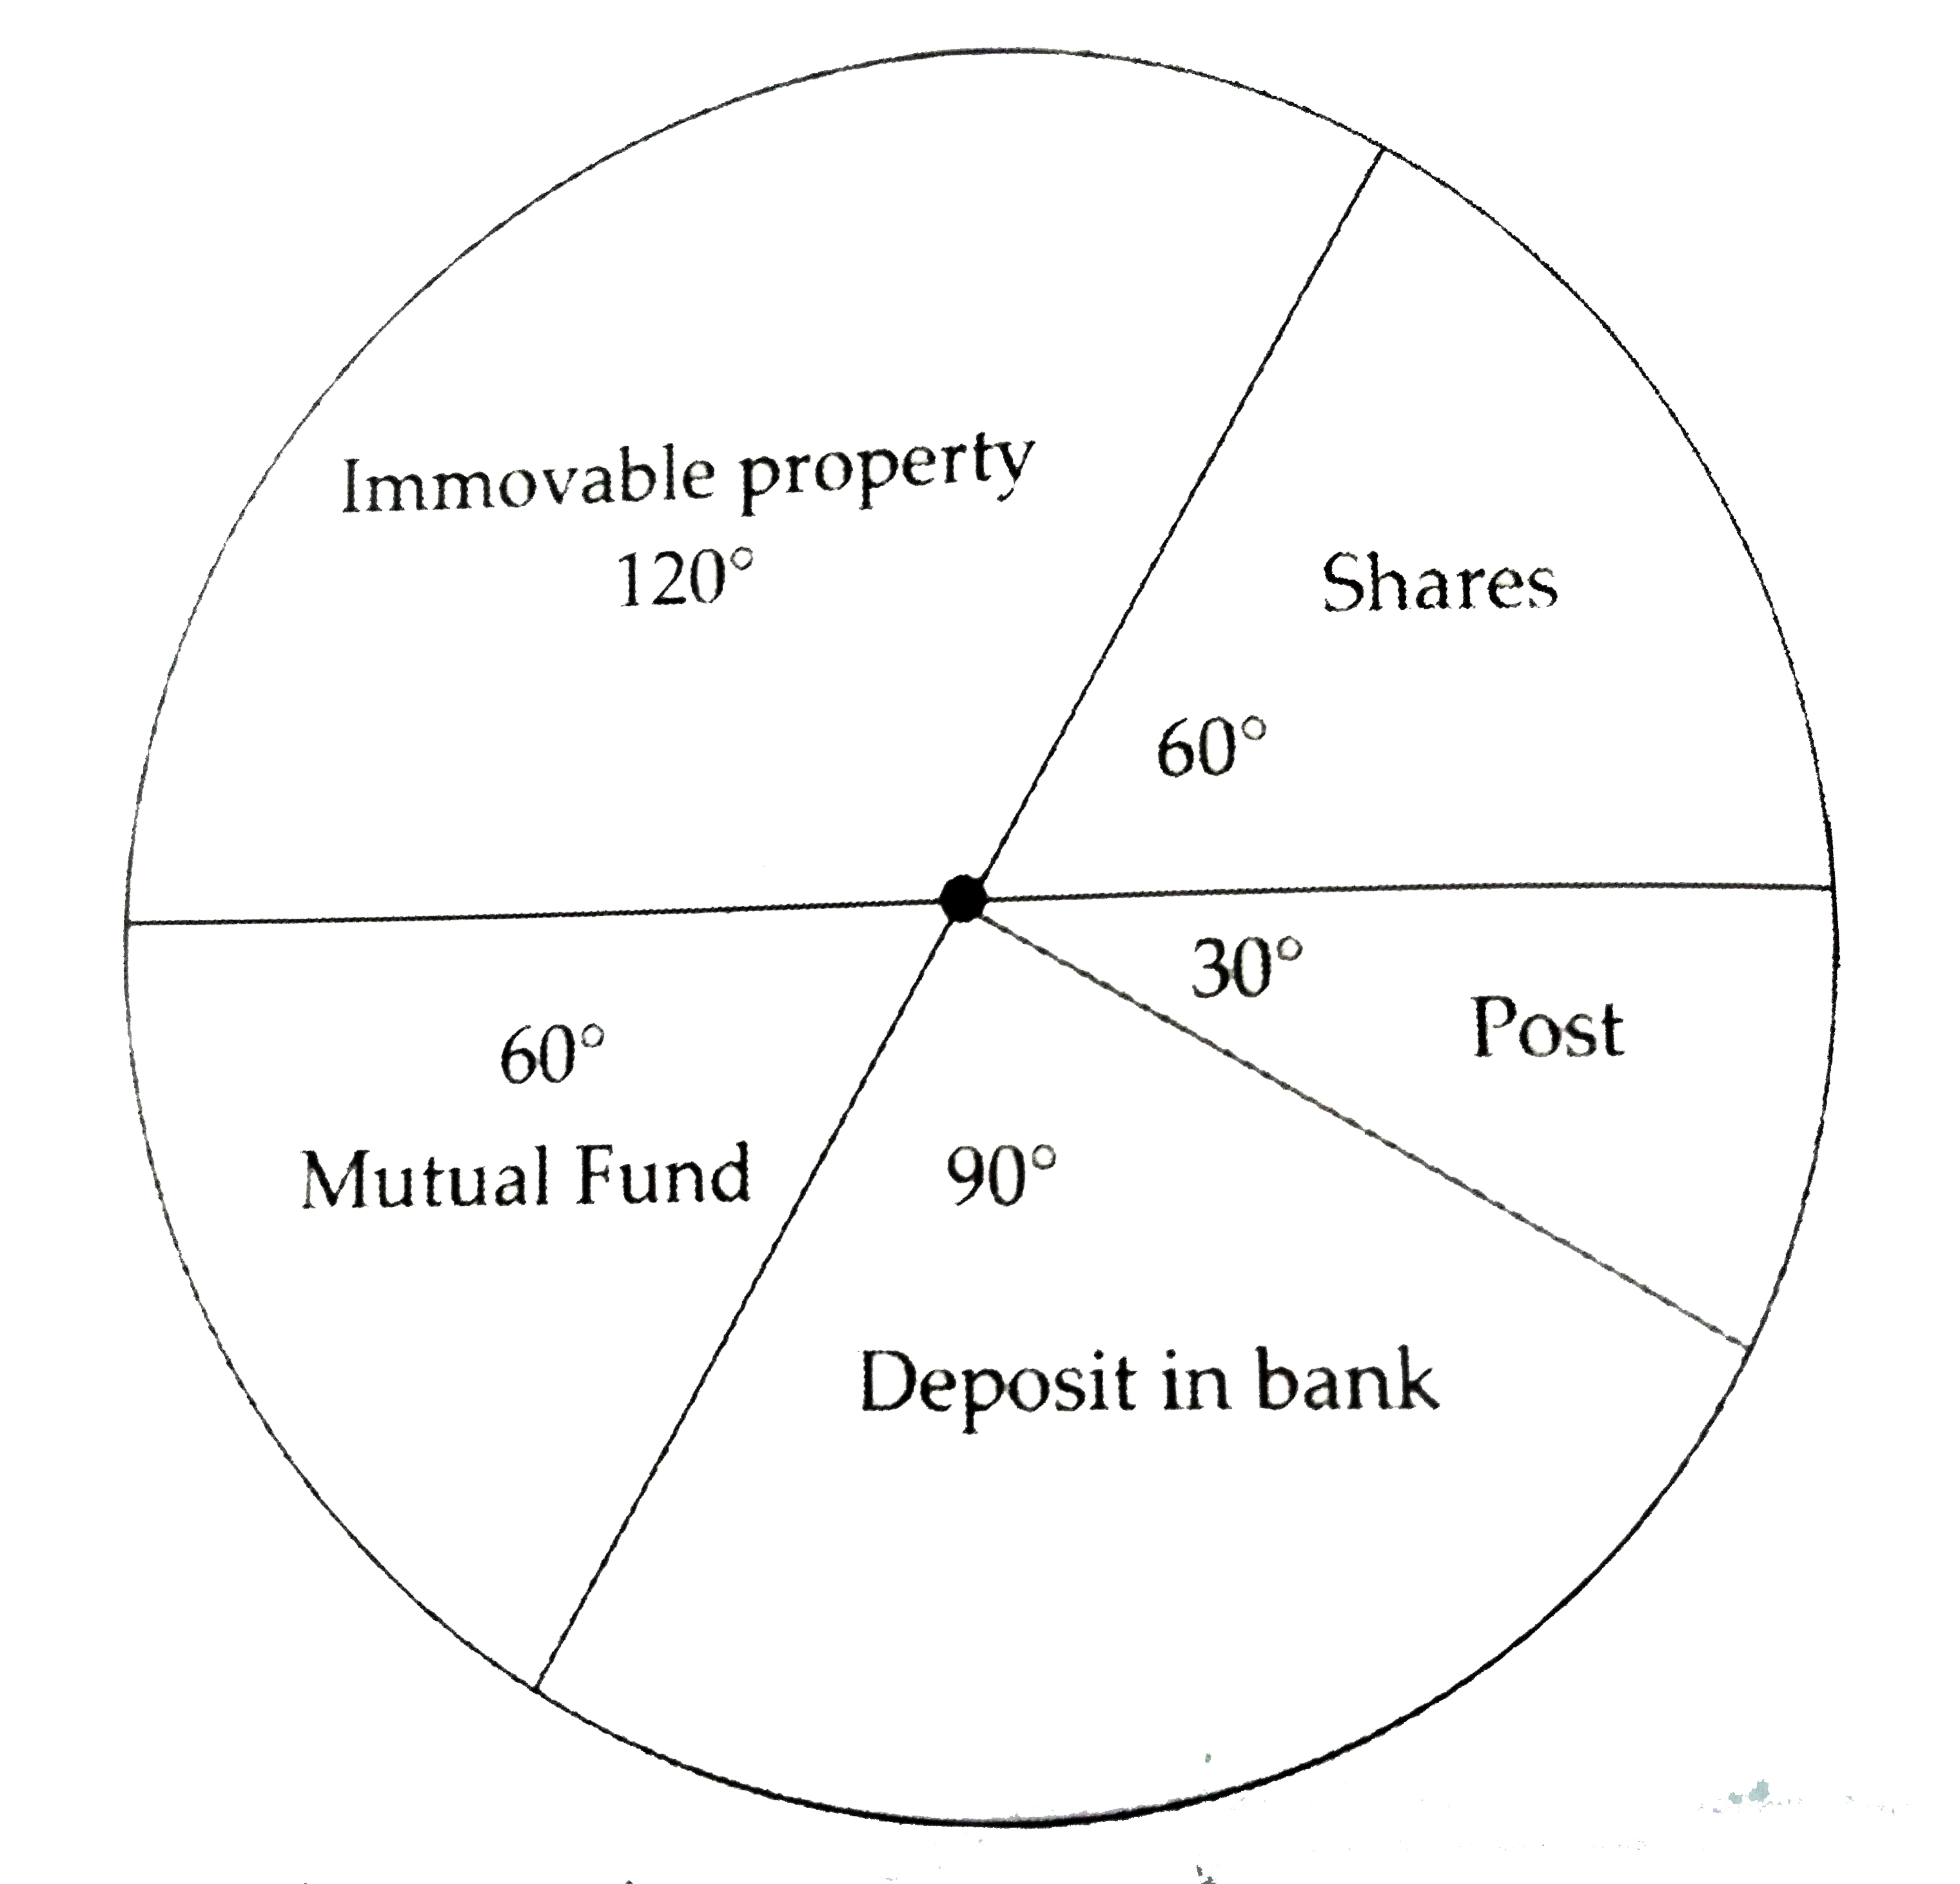
The annual investment of a family are shown in the adjacent pie diagram. Answer the following

If the investment in shares is rs .2000 / , find the total investment . Solution in Tamil
The correct Answer is:Total amount invested = rs 12,000
Step by step video & image solution for The annual investment of a family are shown in the adjacent pie diagram. Answer the following If the investment in shares is rs .2000 / , find the total investment . by Maths experts to help you in doubts & scoring excellent marks in Class 10 exams.
Updated on:21/07/2023Topper's Solved these Questions
- STATISTICS Book:CHETAN PUBLICATIONChapter:STATISTICS Exercise:PROBLEM FOR PRACTICE (Based on practice set )
Explore 26 Videos
- STATISTICS Book:CHETAN PUBLICATIONChapter:STATISTICS Exercise:ASSIGNMENT -6
Explore 12 Videos
- STATISTICS Book:CHETAN PUBLICATIONChapter:STATISTICS Exercise:PRACTICE SET -6.5
Explore 7 Videos
- STANDARD IX SYLLABUS Book:CHETAN PUBLICATIONChapter:STANDARD IX SYLLABUS Exercise:PROBLEMS FOR PRACTICE
Explore 20 Videos
- TRIGONOMETRYBook:CHETAN PUBLICATIONChapter:TRIGONOMETRYExercise:ASSIGNMENT - 6
Explore 11 Videos
Similar Questions
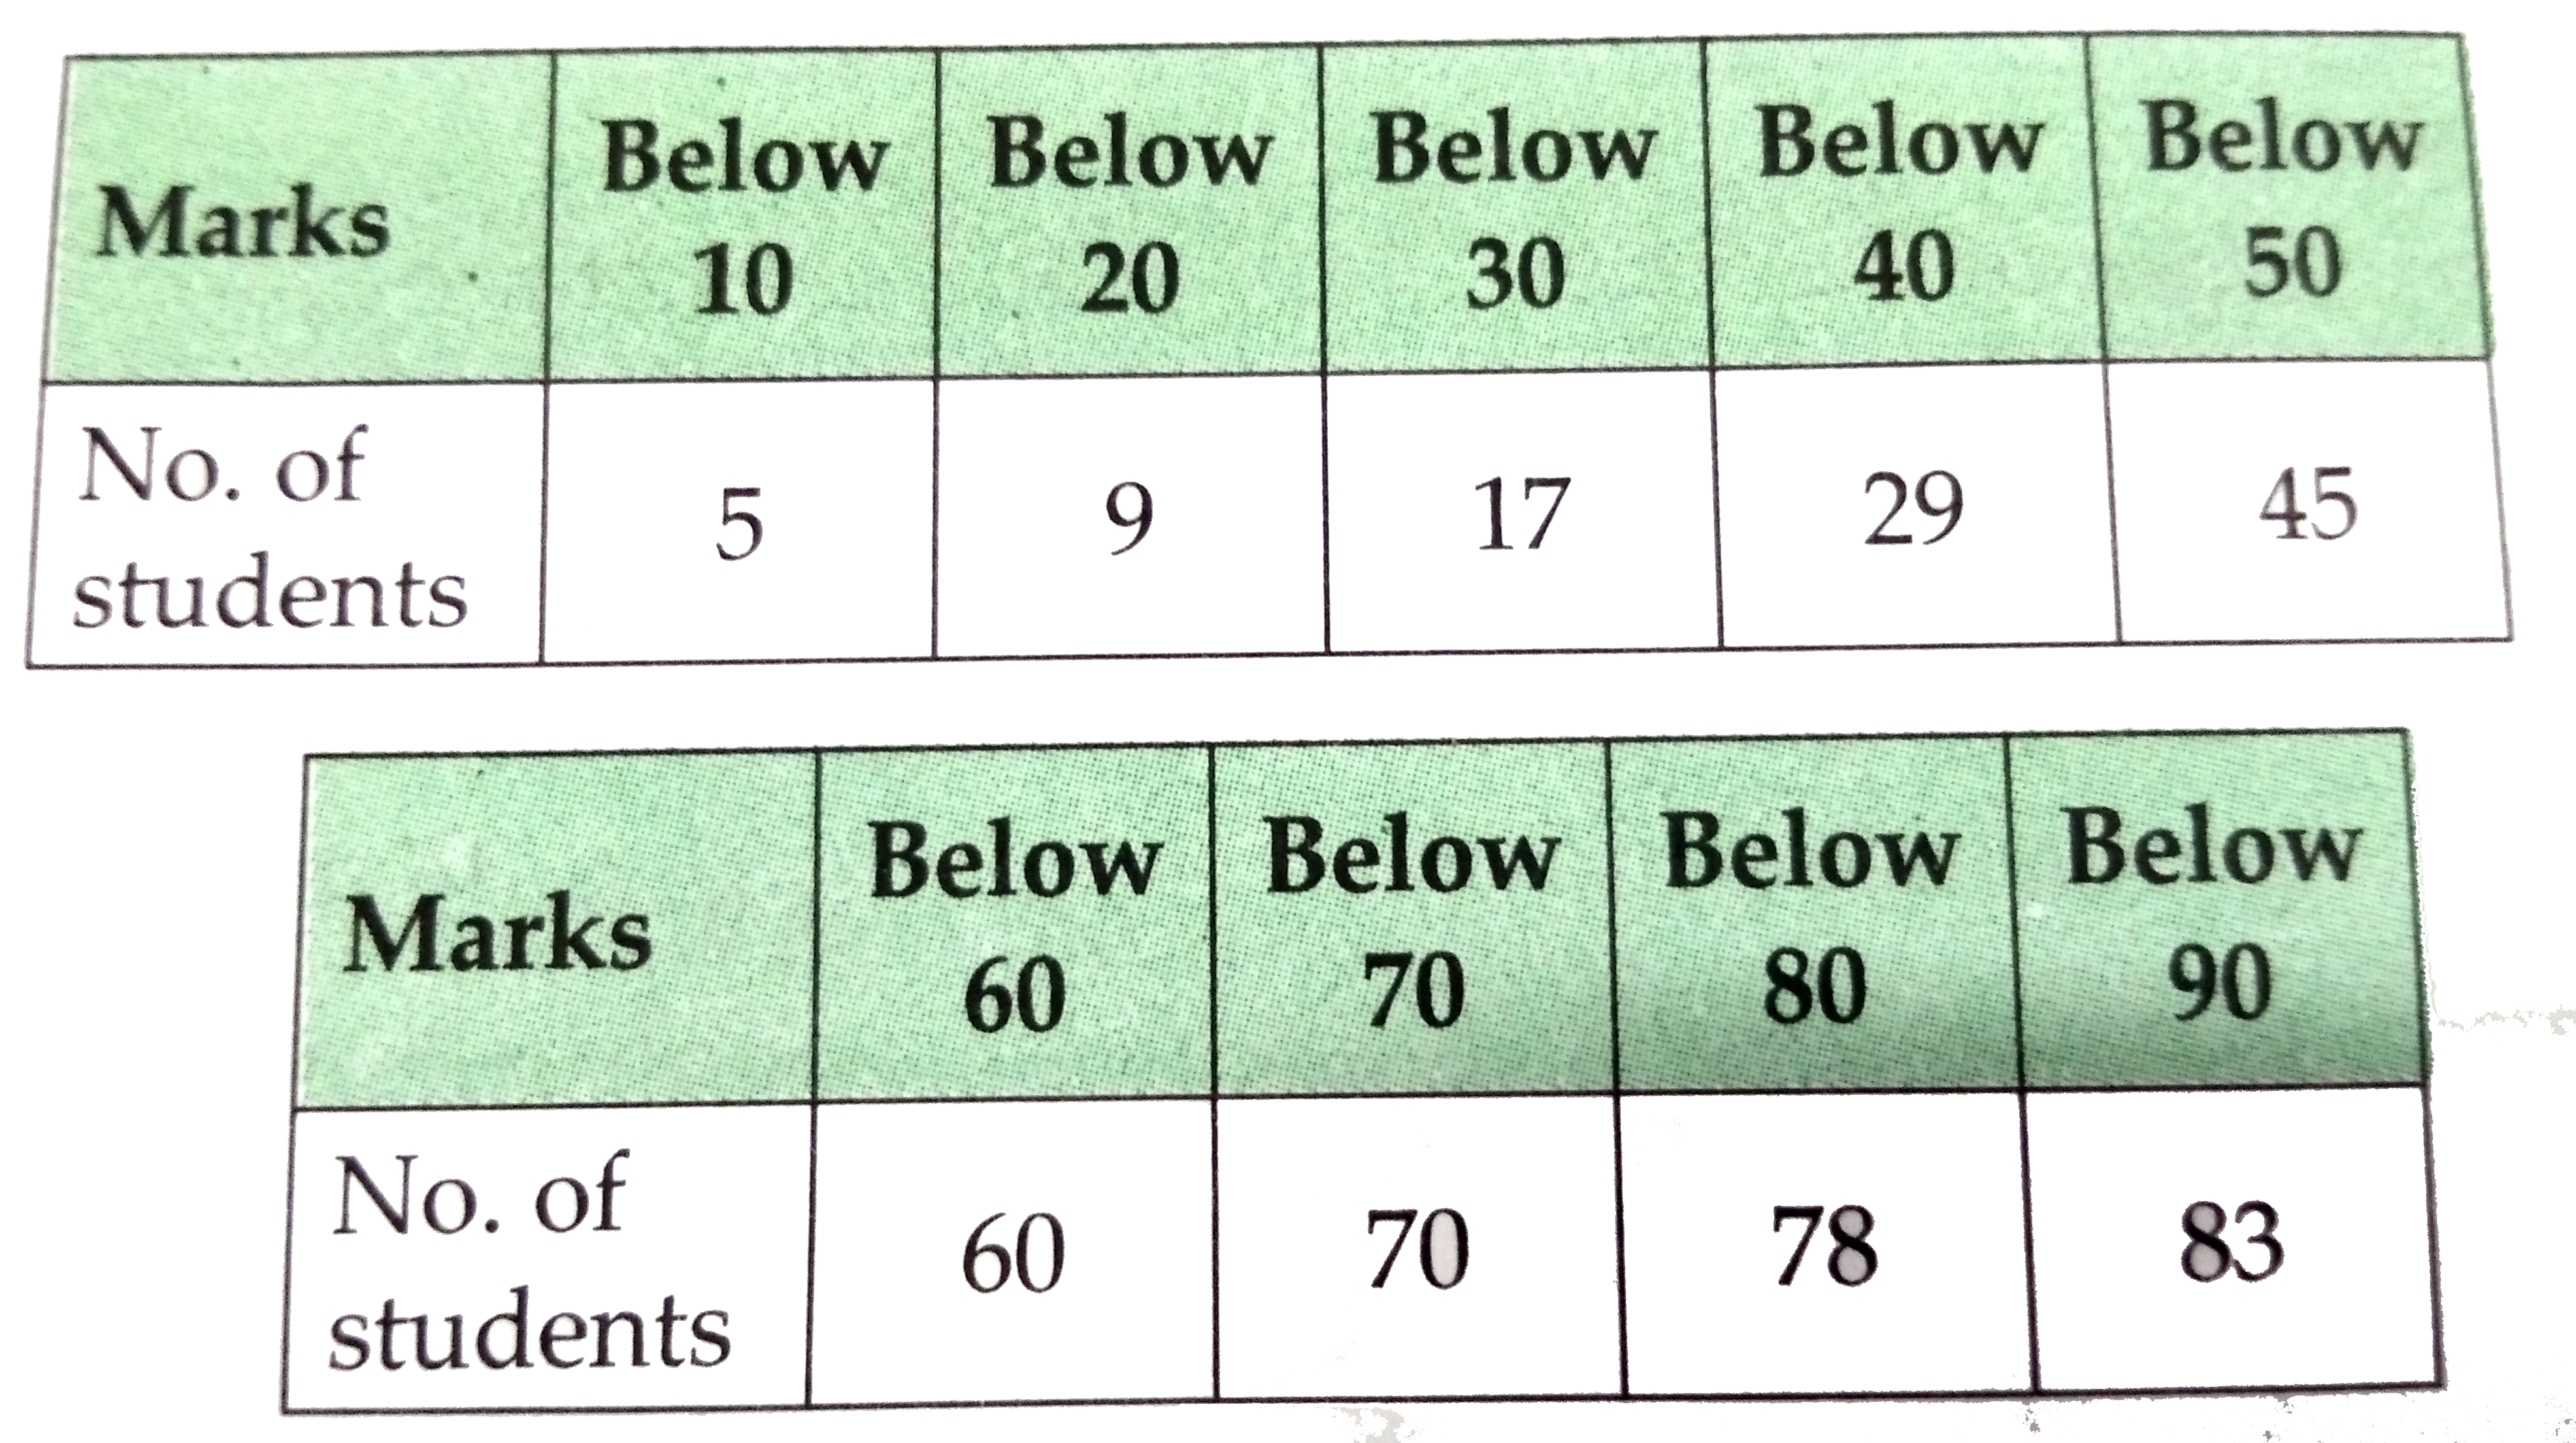
Find the mean marks of the student from the following cumulative frequency distribution .

View SolutionChoose the correct alternative among the following :
The class mark of the class interval 120-130 is,
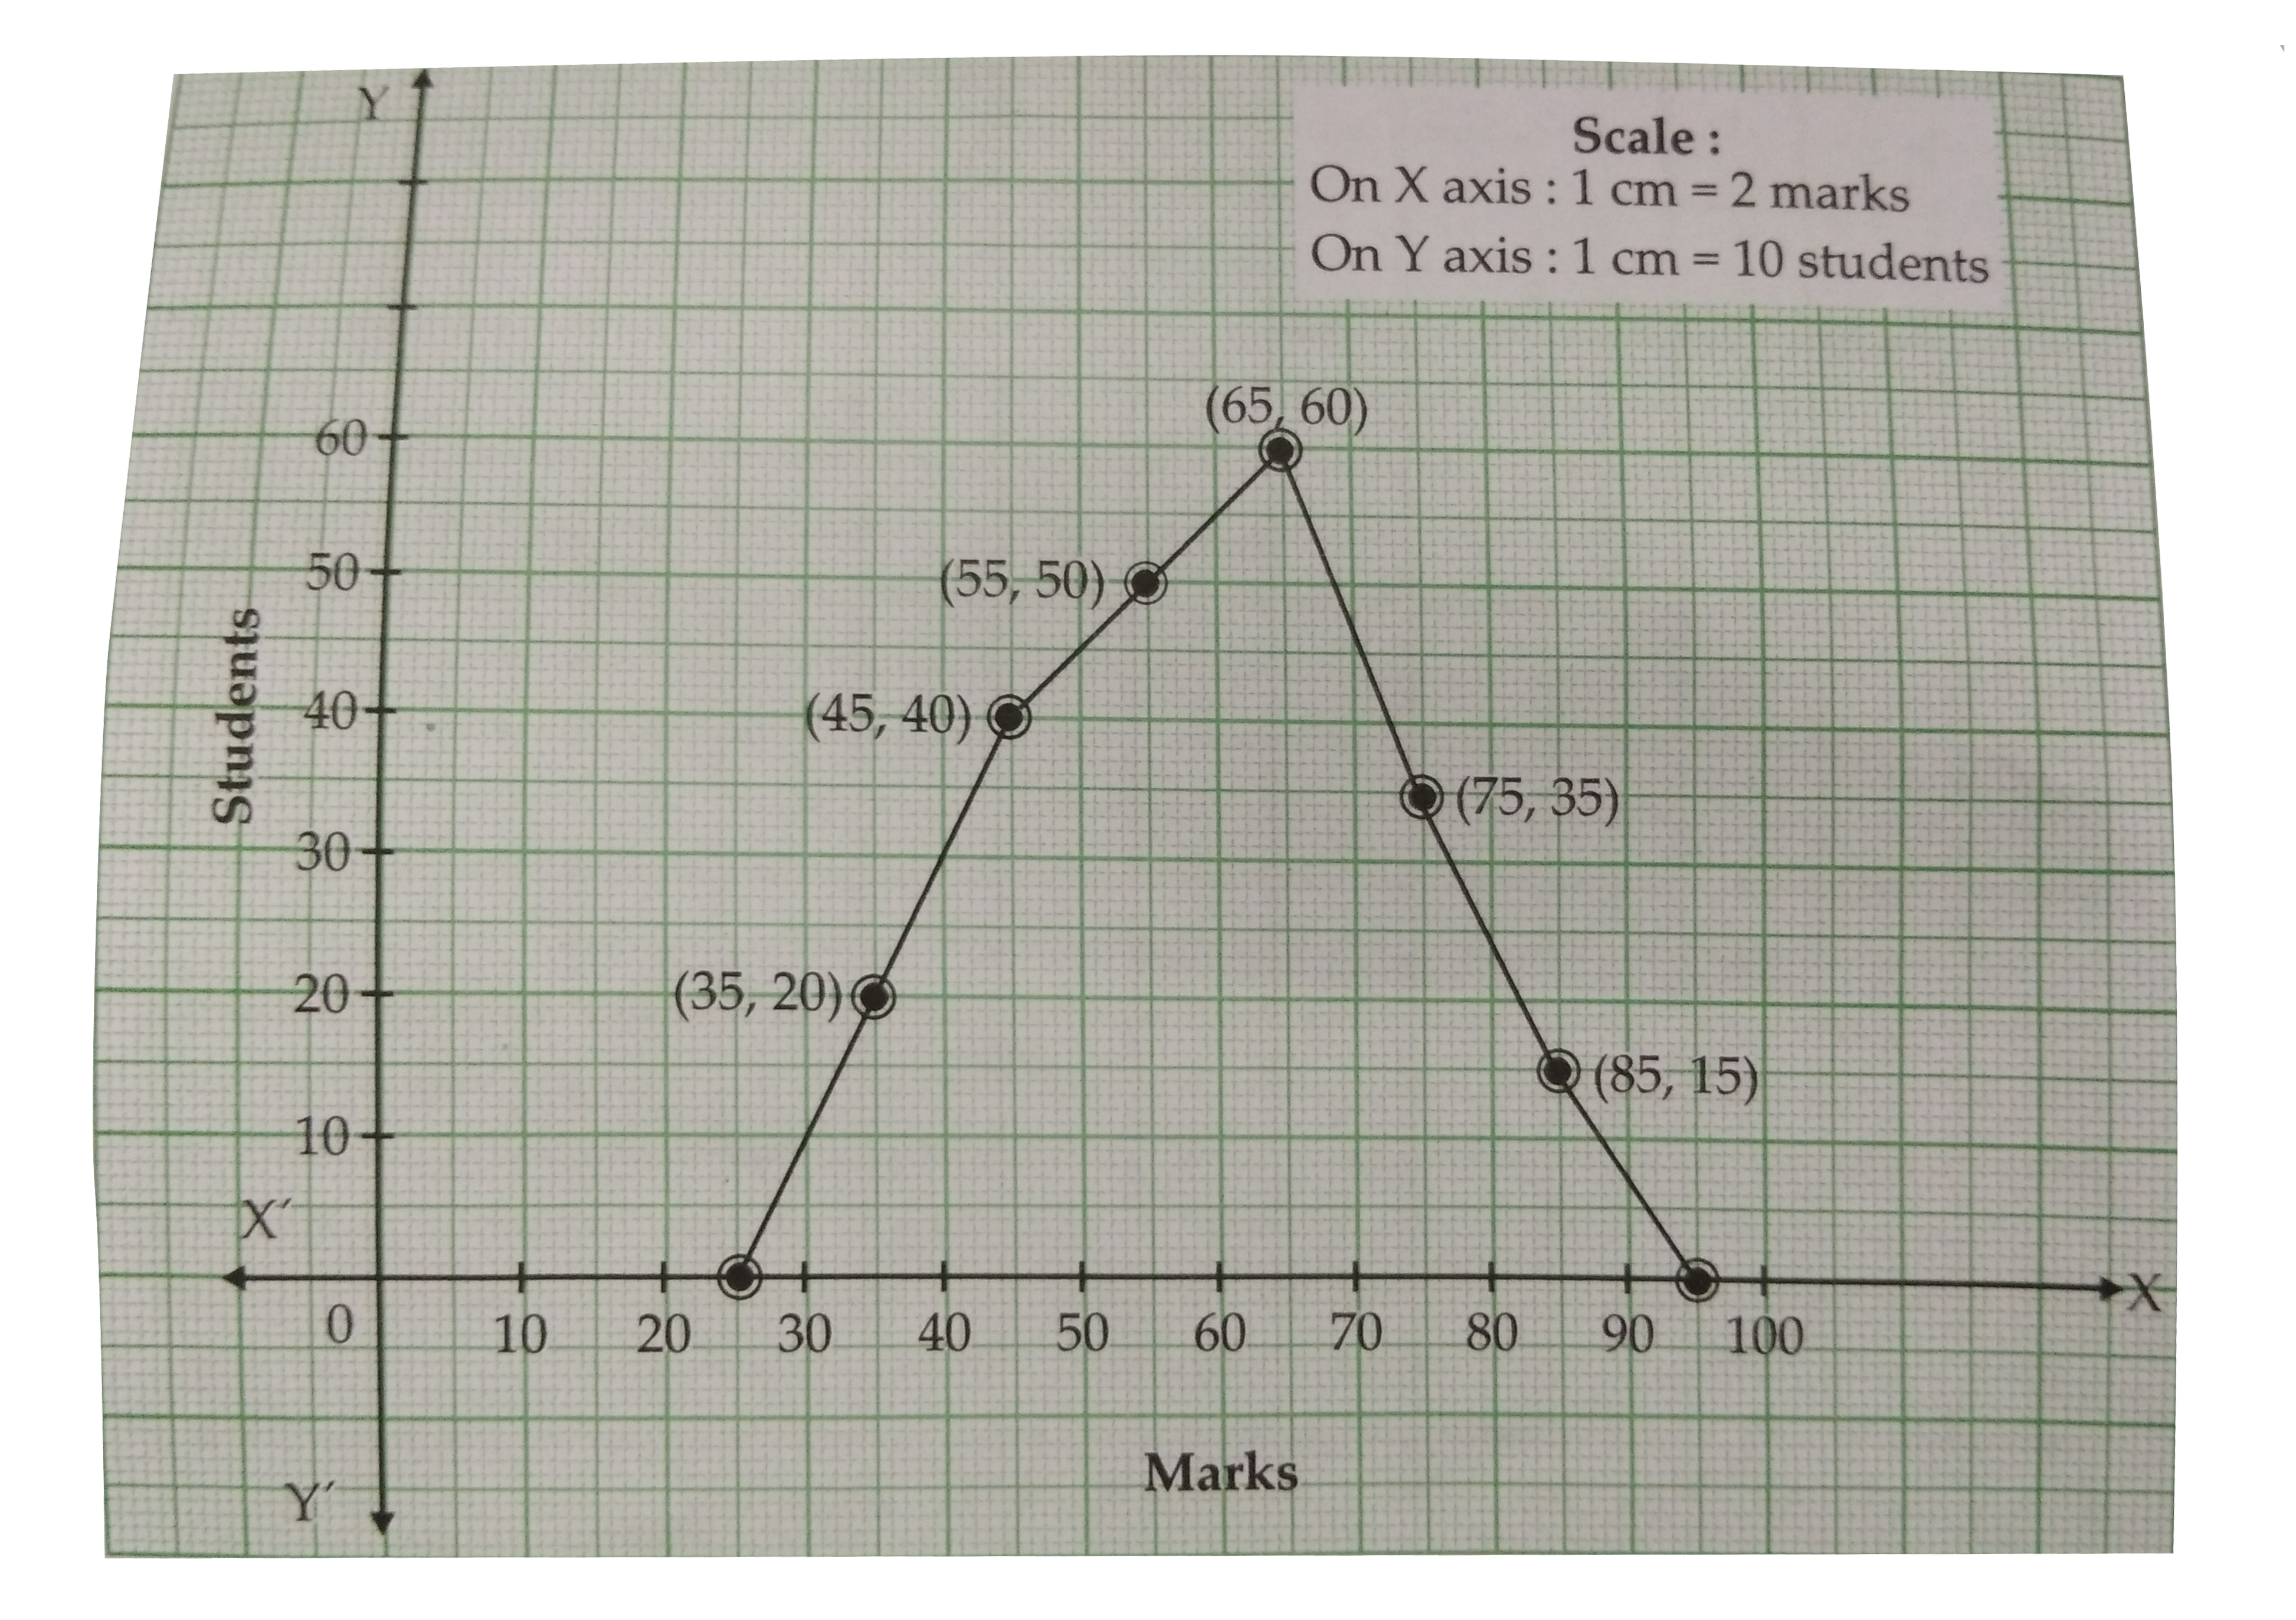
View SolutionObserve the following frequency polygon and write the answers of the

Which class has the maximum number of students ?
View SolutionDraw segment PQ=4.3cm and bisect it.
View SolutionIf sinθ=45, then find cosθ
View SolutionDetermine the point of symmetry of a regular hexagon.
View SolutionDtermine the images of the following figure about the given line :
View SolutionMatch the following Column A to Column B

View SolutionMatch the following Column A to Column B

View SolutionMatch the following Column A to Column B

View SolutionThe inequation represented by the graph given below is :
View SolutionThe inequation that best describes the graph given below is _________
View SolutionThe inequation that best describes the following graph is _________
View SolutionThe equation of straight line shown in figure is :
ltimg src="https://d10lpgp6xz60nq.cloudfront.net/physics_images/ALN_PHY_R04_E01_020_Q01.png" width="80%"gt
View SolutionWhat is the distance OA for the square shown in figure :- ltimg src="https://d10lpgp6xz60nq.cloudfront.net/physics_images/ALN_PHY_R05_E01_015_Q01.png" width="80%"gt
View Solution