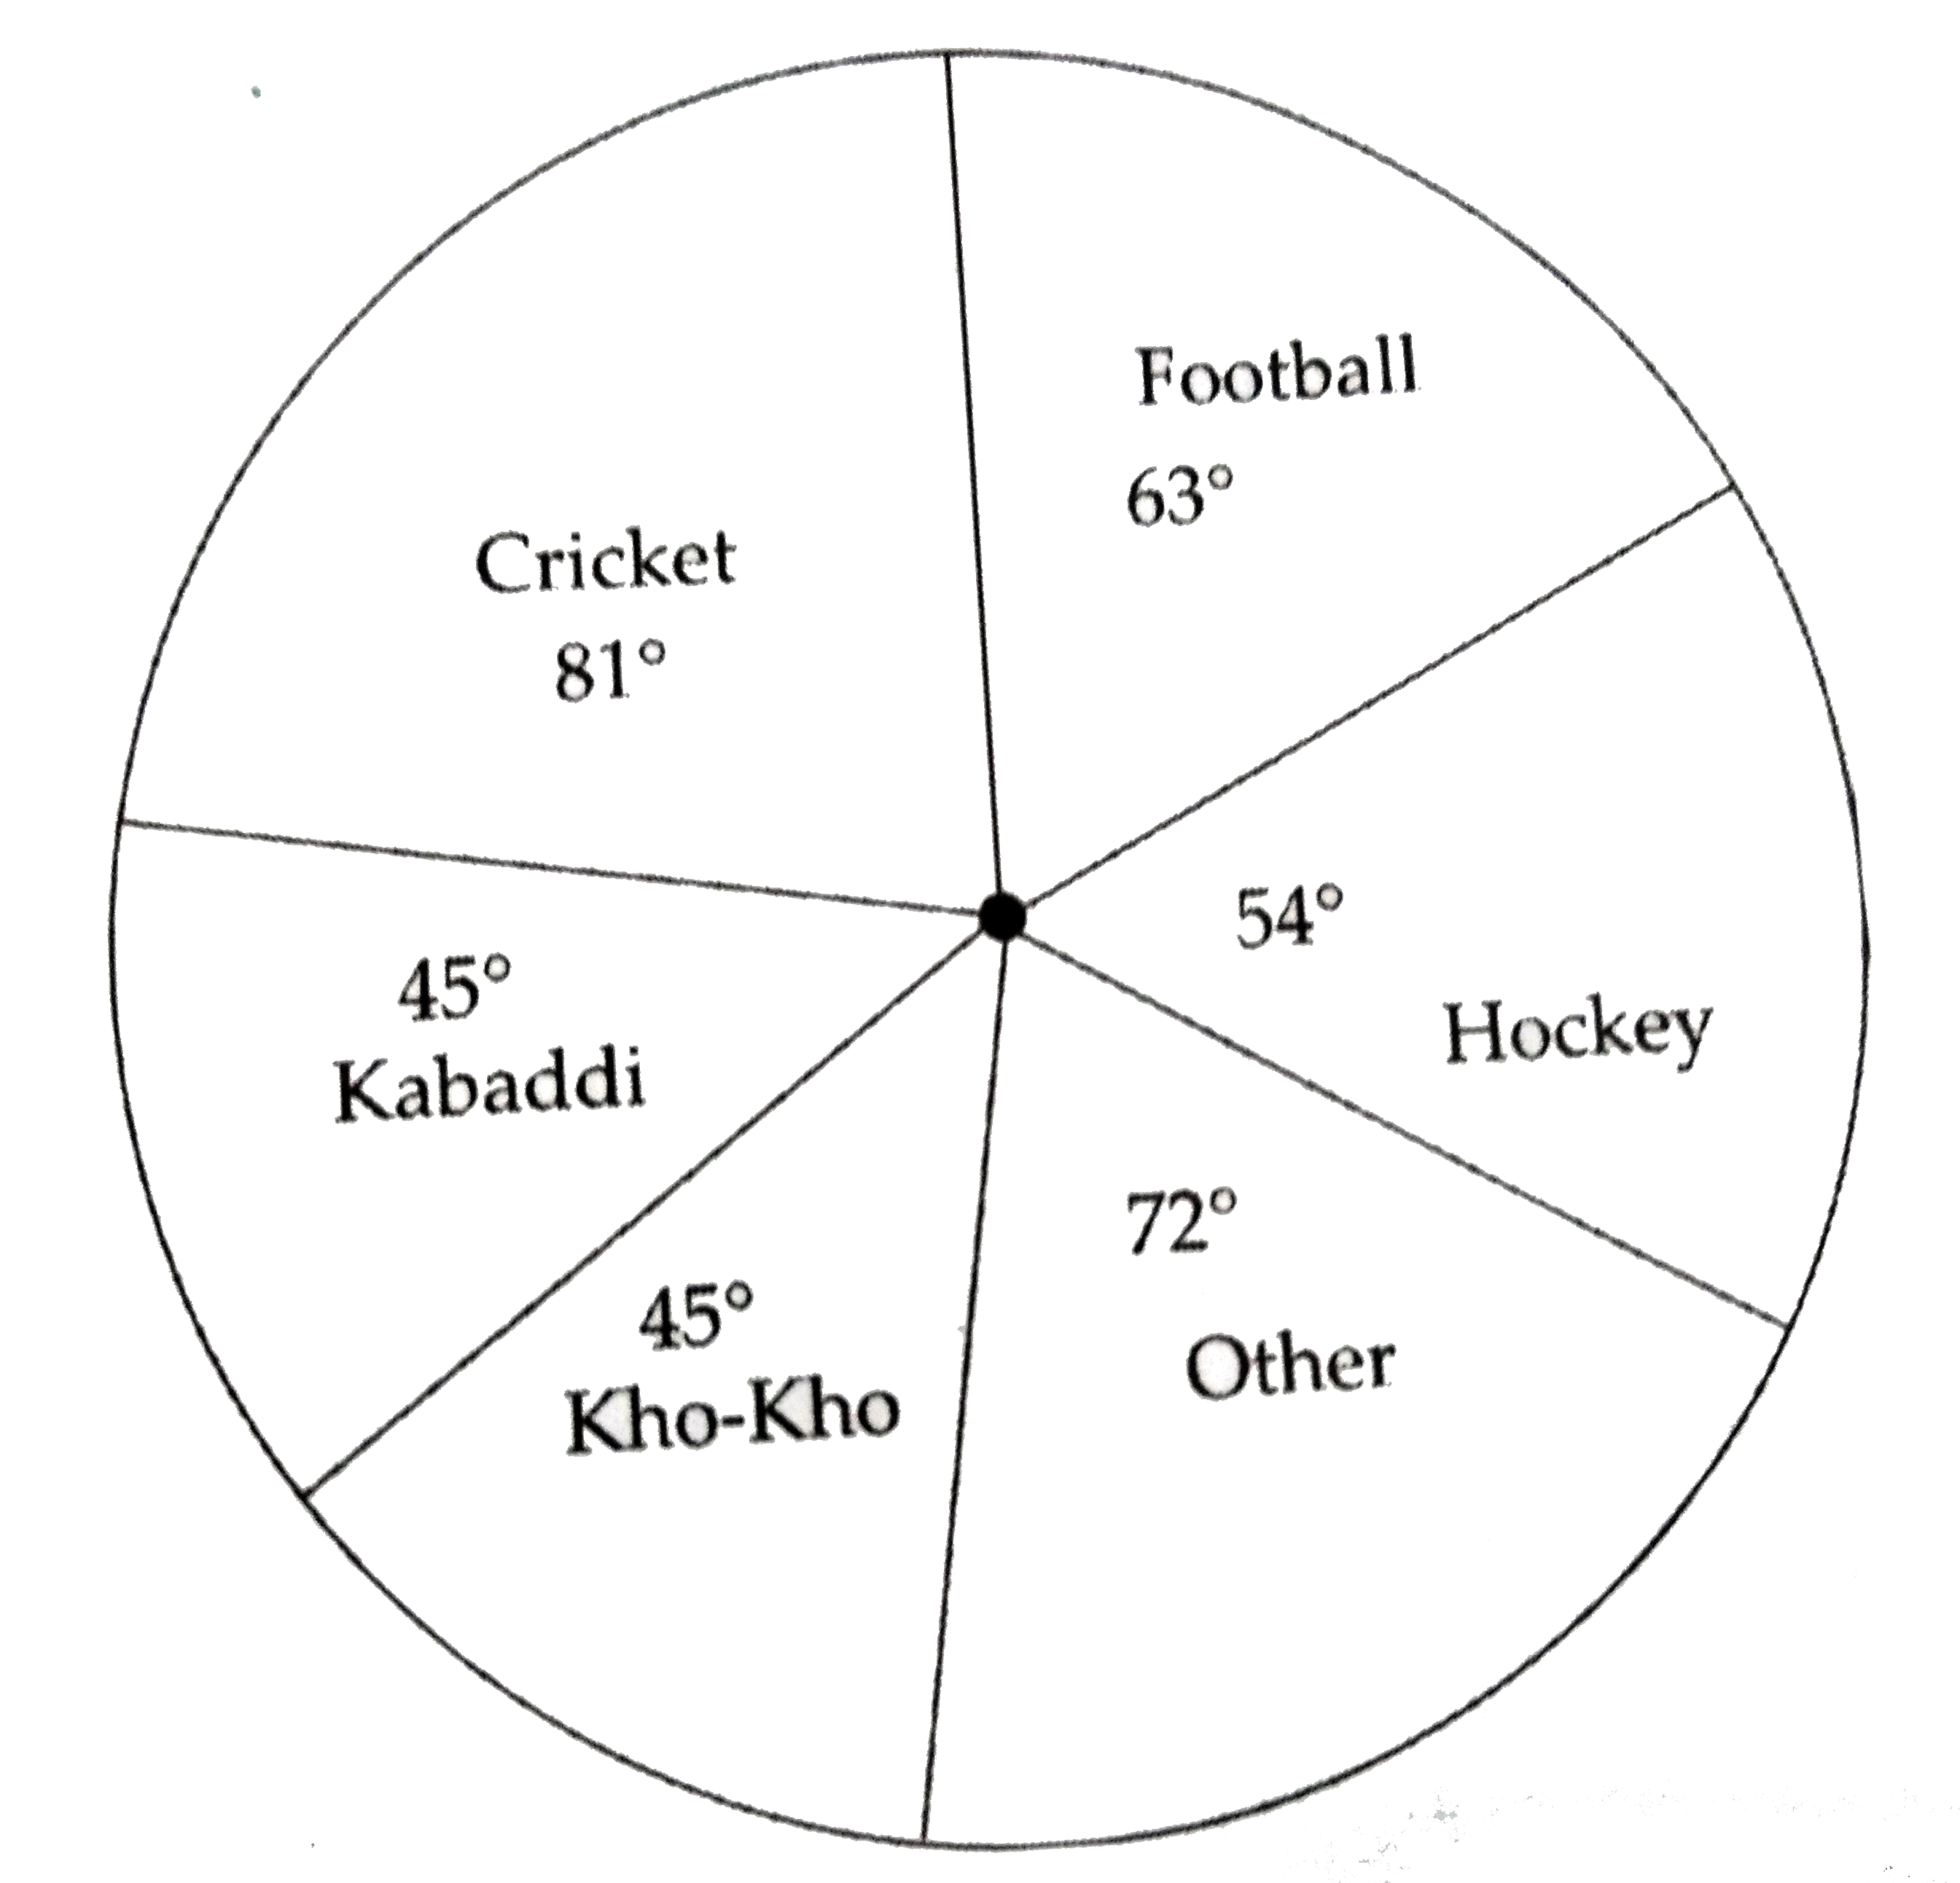
A survey of students was made to know which game they like. The date obtained in the survey is presented in the below pie diagram. If the total number of students are 1000 
(iii) How many students prefer other games?Solution in Tamil
Step by step video & image solution for A survey of students was made to know which game they like. The date obtained in the survey is presented in the below pie diagram. If the total number of students are 1000 (iii) How many students prefer other games? by Maths experts to help you in doubts & scoring excellent marks in Class 10 exams.
Updated on:21/07/2023Topper's Solved these Questions
- STATISTICS Book:CHETAN PUBLICATIONChapter:STATISTICS Exercise:PRACTICE SET -6.1
Explore 6 Videos
- STATISTICS Book:CHETAN PUBLICATIONChapter:STATISTICS Exercise:PRACTICE SET -6.2
Explore 4 Videos
- STANDARD IX SYLLABUS Book:CHETAN PUBLICATIONChapter:STANDARD IX SYLLABUS Exercise:PROBLEMS FOR PRACTICE
Explore 20 Videos
- TRIGONOMETRYBook:CHETAN PUBLICATIONChapter:TRIGONOMETRYExercise:ASSIGNMENT - 6
Explore 11 Videos
Similar Questions
The following table shows the number of students and the time they utilized daily for their studies . Find the mean time spent by students for their studies by direct method.

View SolutionThe following table shows classification of number of workers and the number of hours they work in a software company . Find the median of the number of hours they work .

View SolutionDraw segment PQ=4.3cm and bisect it.
View SolutionIf sinθ=45, then find cosθ
View SolutionHow many lines of symmetry does the above figure have ?
View SolutionWhich of the following are correct chain isomers of butane ? (i)
View SolutionDetermine the point of symmetry of a regular hexagon.
View SolutionMatch the following Column A to Column B

View SolutionMatch the following Column A to Column B

View SolutionMatch the following Column A to Column B

View SolutionFind the area of the figure given below.

View SolutionThe area of the shaded part in the figure given below is ______.

View SolutionThe inequation represented by the graph given below is :
View SolutionThe inequation that best describes the graph given below is _________
View SolutionThe inequation that best describes the following graph is _________
View SolutionWhich inequations represent the shaded region in the given figure
View Solution
