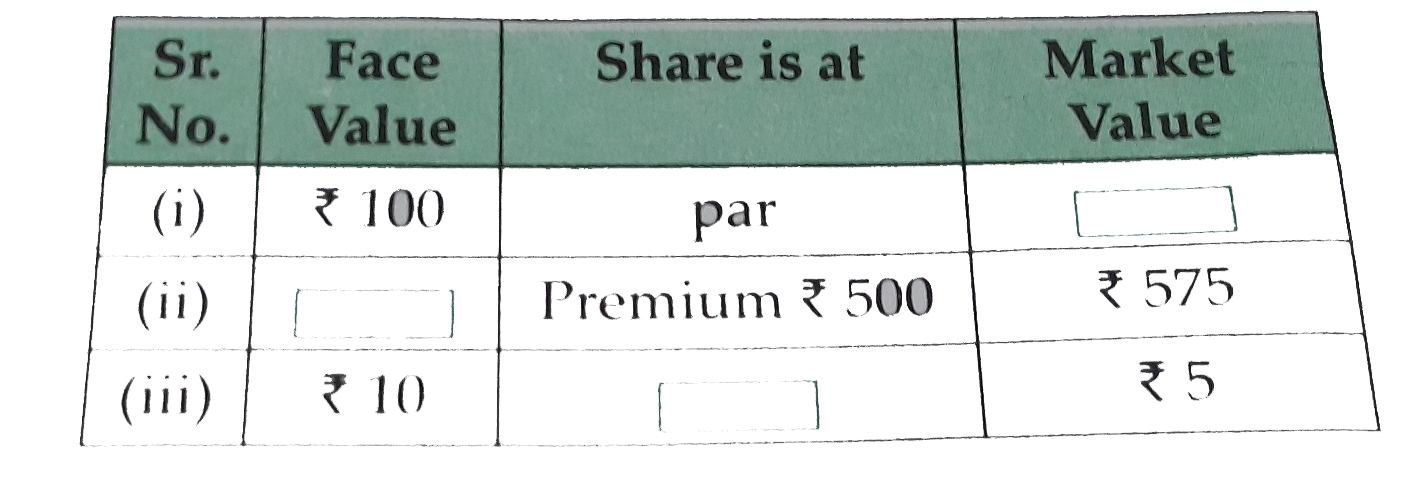
Fill in the blanks in the contract note of sale -purchase of shares . (B-buy, S - sell)
 Solution in Tamil
Step by step video & image solution for Fill in the blanks in the contract note of sale -purchase of shares . (B-buy, S - sell) by Maths experts to help you in doubts & scoring excellent marks in Class 10 exams.
Updated on:21/07/2023Topper's Solved these Questions
- FINANCIAL PLANNINGBOOK - CHETAN PUBLICATIONCHAPTER - FINANCIAL PLANNINGEXERCISE - Problem Set -4A
8 Videos
- FINANCIAL PLANNINGBOOK - CHETAN PUBLICATIONCHAPTER - FINANCIAL PLANNINGEXERCISE - Problem Set -4B
10 Videos
- FINANCIAL PLANNINGBOOK - CHETAN PUBLICATIONCHAPTER - FINANCIAL PLANNINGEXERCISE - Practise Set -4.3
6 Videos
- CO-ORDINATE GEOMETRY BOOK - CHETAN PUBLICATIONCHAPTER - CO-ORDINATE GEOMETRY EXERCISE - ASSIGNMENT-5
11 Videos
- GEOMETRIC CONSTRUCTIONBOOK - CHETAN PUBLICATIONCHAPTER - GEOMETRIC CONSTRUCTIONEXERCISE - ASSIGNMENT
13 Videos
Similar Questions
A trader from Surat, Gujrat sold cotton clothes to a trader in Rajkot, Gujarat.The taxable value of cotton clothes is Rs2.5 lacs.What is the amount of Gst at 5% paid by the trader in Rajkot?
View SolutionFind the amount received when 300 shares of FV Rs100, were sold at a discount of Rs30
View SolutionComplete the following table by writing suitable numbers and words .

View SolutionSlope of a line is √3. Find its inclination.
View SolutionThe number of tangents that can be drawn to a circle at a point on the circle is………..
View SolutionHow many lines of symmetry does the above figure have ?
View SolutionWhich of the following are correct chain isomers of butane ? (i)
View SolutionDetermine the point of symmetry of a regular hexagon.
View SolutionDtermine the images of the following figure about the given line :
View SolutionMatch the following Column A to Column B

View SolutionMatch the following Column A to Column B

View SolutionMatch the following Column A to Column B

View SolutionFind the area of the figure given below.

View SolutionThe inequation represented by the graph given below is :
View SolutionThe inequation that best describes the graph given below is _________
View Solution
