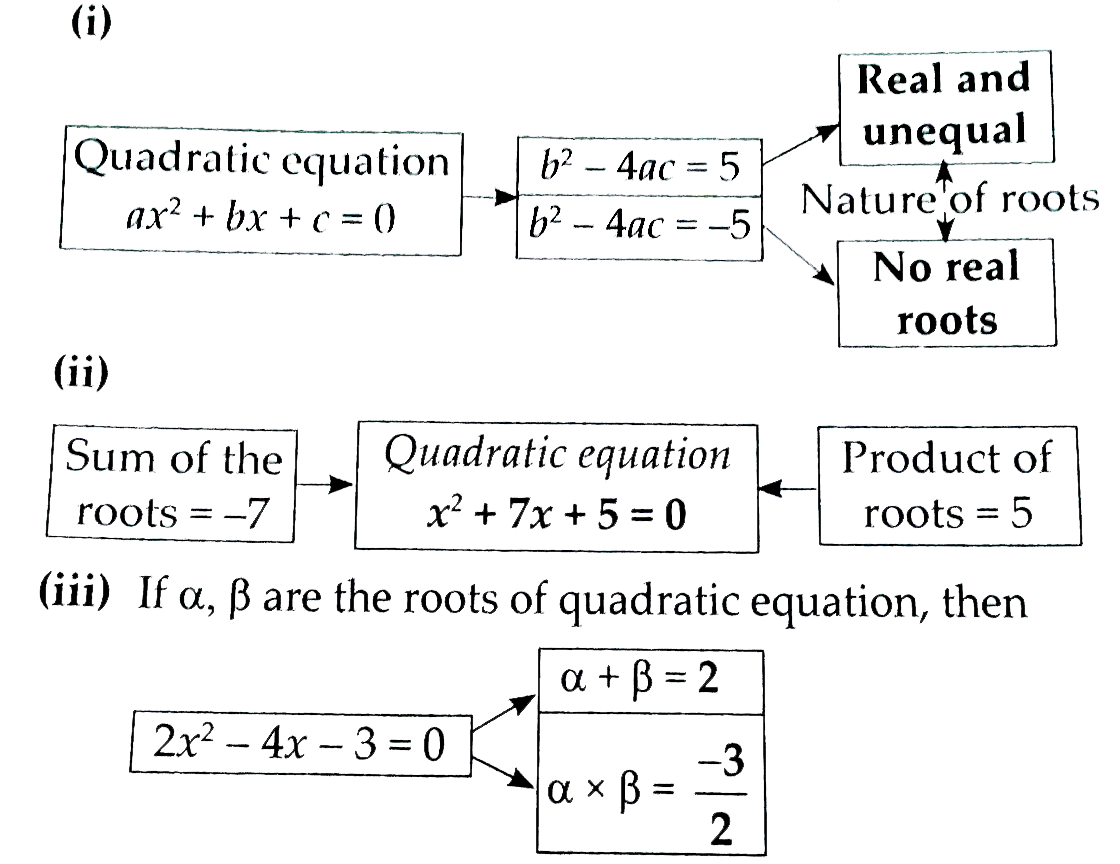
Fill in the gaps and complete.
(i) 
α×β=ca=−32Solution in Tamil
Step by step video & image solution for Fill in the gaps and complete. (i) " " alpha times beta =c/a=(-3)/2 by Maths experts to help you in doubts & scoring excellent marks in Class 10 exams.
Updated on:21/07/2023Topper's Solved these Questions
- QUADRATIC EQUATIONSBook:CHETAN PUBLICATIONChapter:QUADRATIC EQUATIONSExercise:PRACTICE SET 2.6
Explore 10 Videos
- QUADRATIC EQUATIONSBook:CHETAN PUBLICATIONChapter:QUADRATIC EQUATIONSExercise:PROBLEM SET 2
Explore 50 Videos
- QUADRATIC EQUATIONSBook:CHETAN PUBLICATIONChapter:QUADRATIC EQUATIONSExercise:PRACTICE SET 2.4
Explore 10 Videos
- PYTHAGORAS THEOREMBook:CHETAN PUBLICATIONChapter:PYTHAGORAS THEOREMExercise:ASSIGNMENT -5
Explore 1 Video
- SIMILARITY Book:CHETAN PUBLICATIONChapter:SIMILARITY Exercise:ASSIGNMENT-1
Explore 12 Videos
Similar Questions
Product of Pragati's age 2 years ago and 3 years hence is 84. Find her present age.
View SolutionWhich of the following are quadratic equations?
x2+2x+11=0
View SolutionFind the values of a,b,c for the following quadratic equations by comparing with standard form :
x2−7x+5=0
View SolutionSolve the following sub question :
In an equilateral triangle ABC, the side BC is trisected at D. prove that 9AD2=7AB2
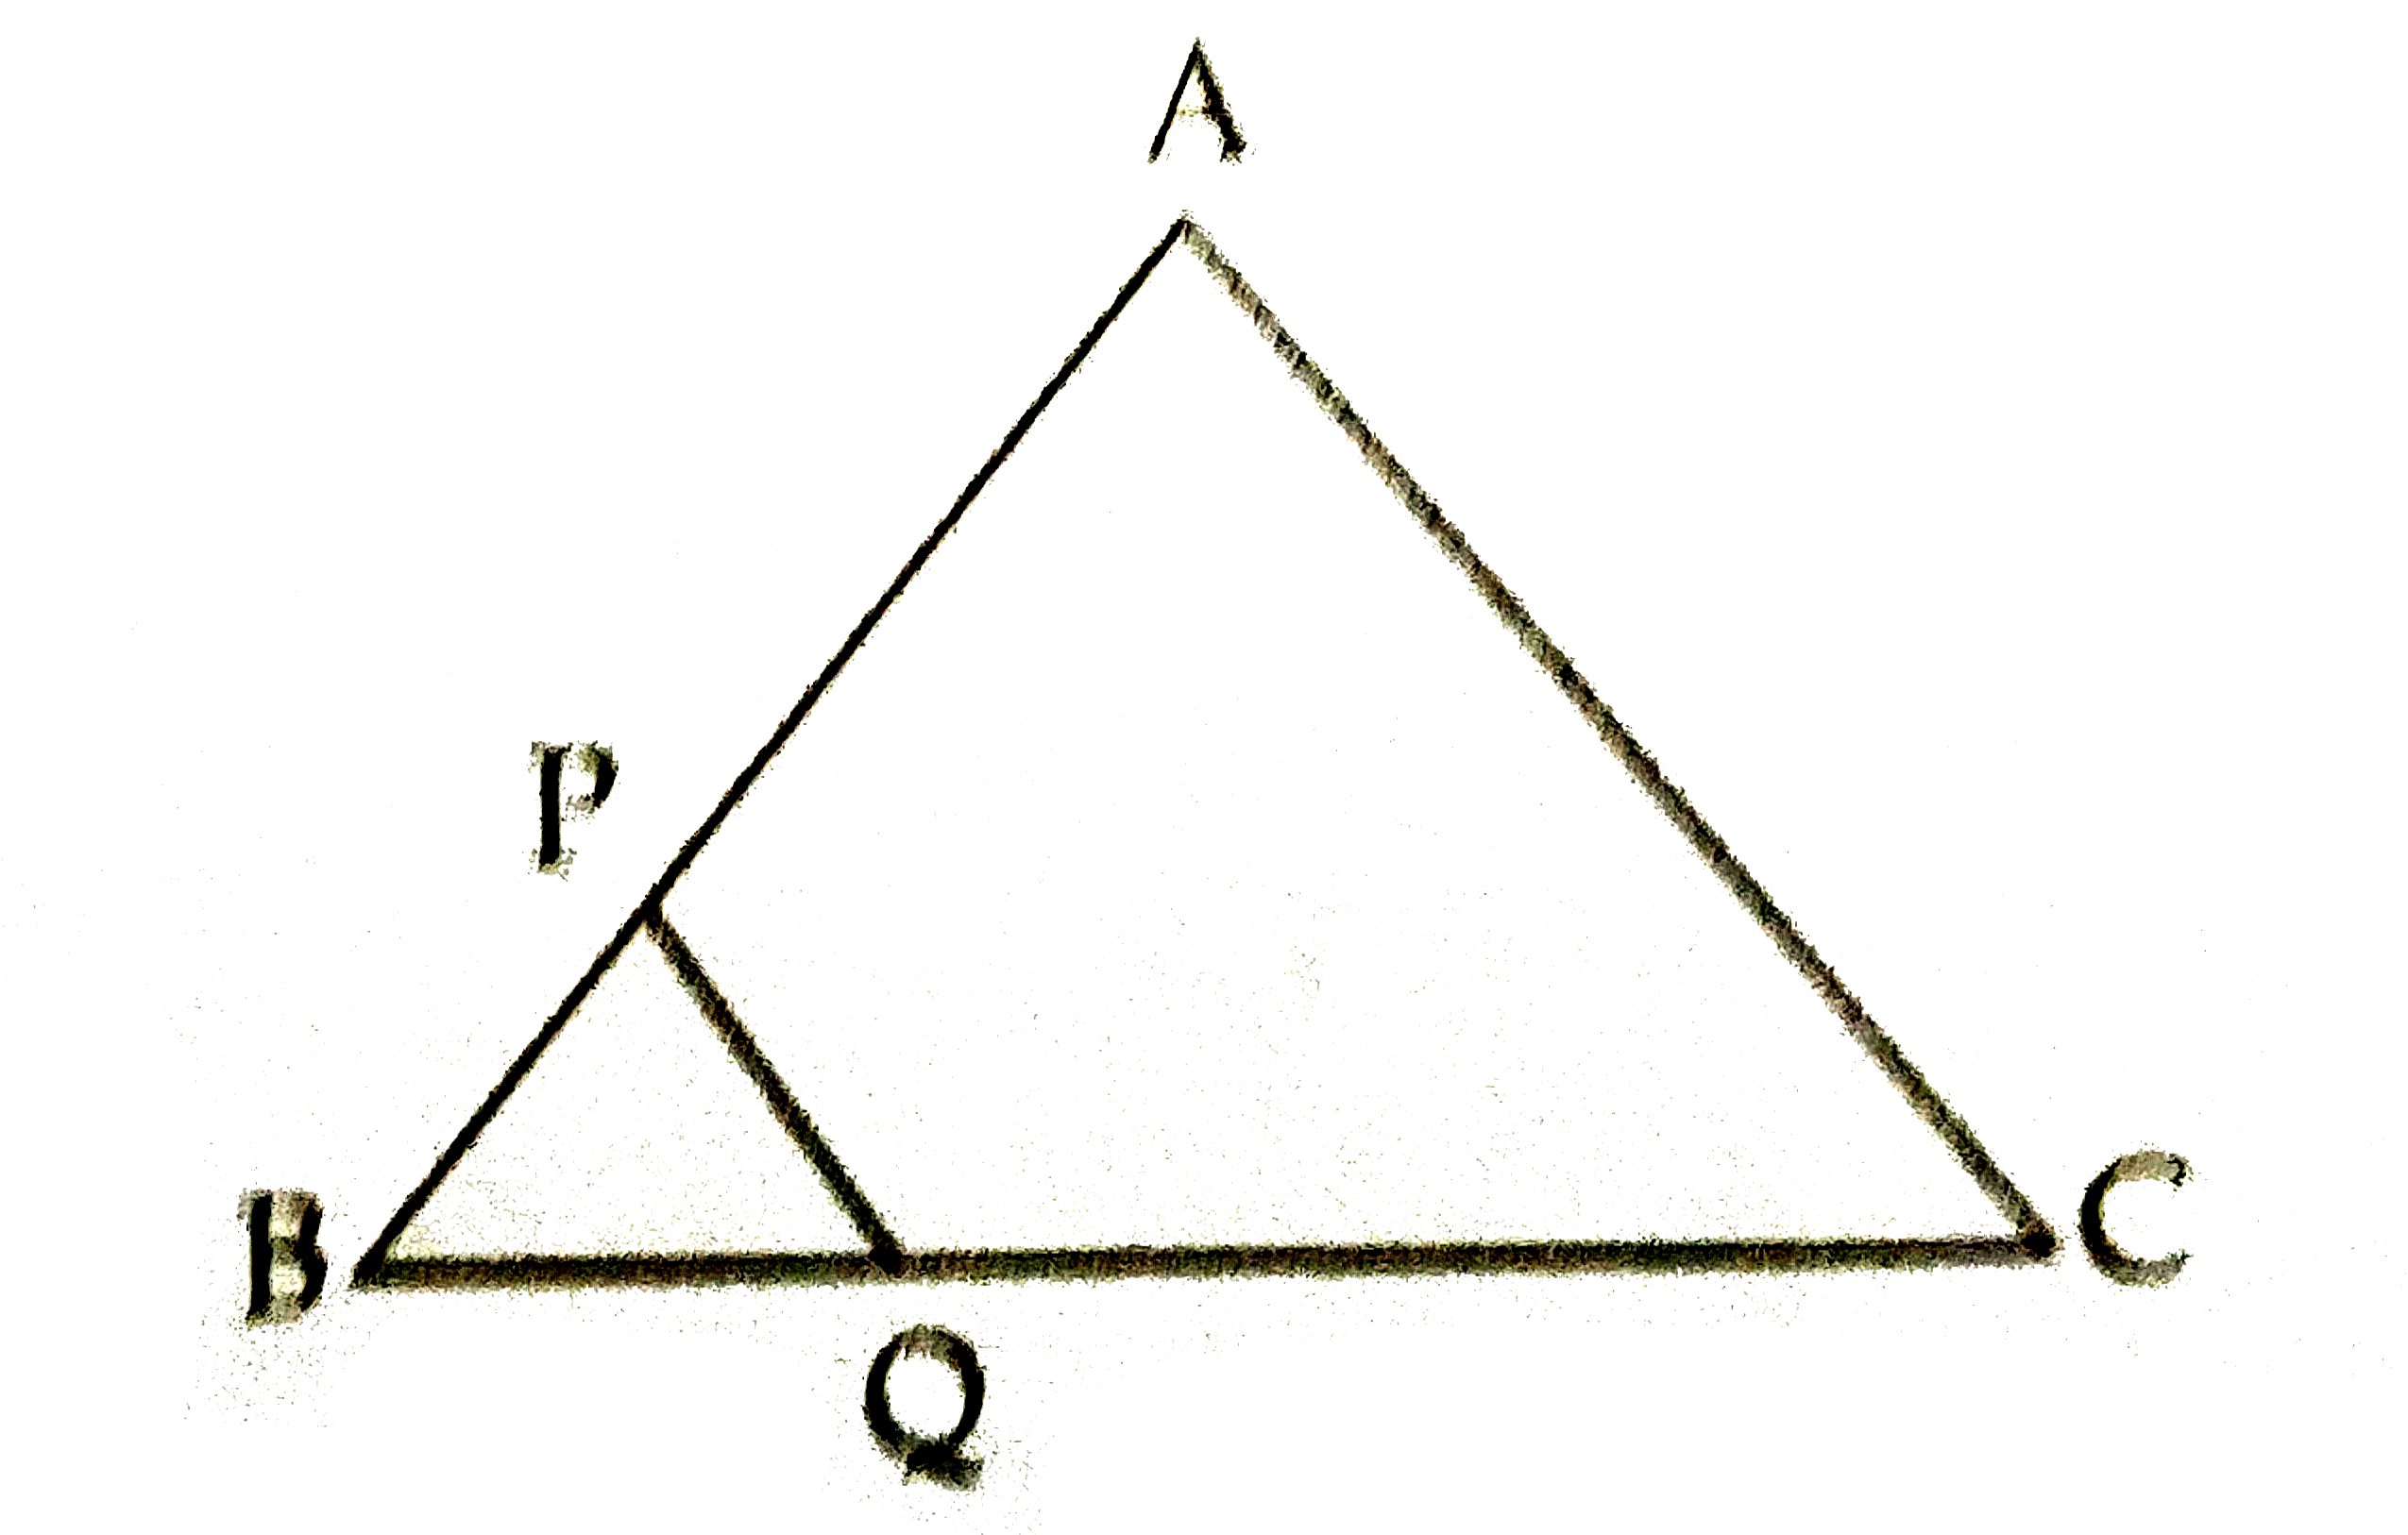
View SolutionSelect the appropriate alternative : In the adjoining figure ,PQ∣∣AC.BP=6,PA=8,BQ=9 , then QC = ……………

View SolutionHow many lines of symmetry does the above figure have ?
View SolutionWhich of the following are correct chain isomers of butane ? (i)
View SolutionDetermine the point of symmetry of a regular hexagon.
View SolutionDtermine the images of the following figure about the given line :
View SolutionMatch the following Column A to Column B

View SolutionMatch the following Column A to Column B

View SolutionMatch the following Column A to Column B

View SolutionFind the area of the figure given below.

View SolutionThe inequation represented by the graph given below is :
View SolutionThe inequation that best describes the graph given below is _________
View SolutionThe inequation that best describes the following graph is _________
View Solution

