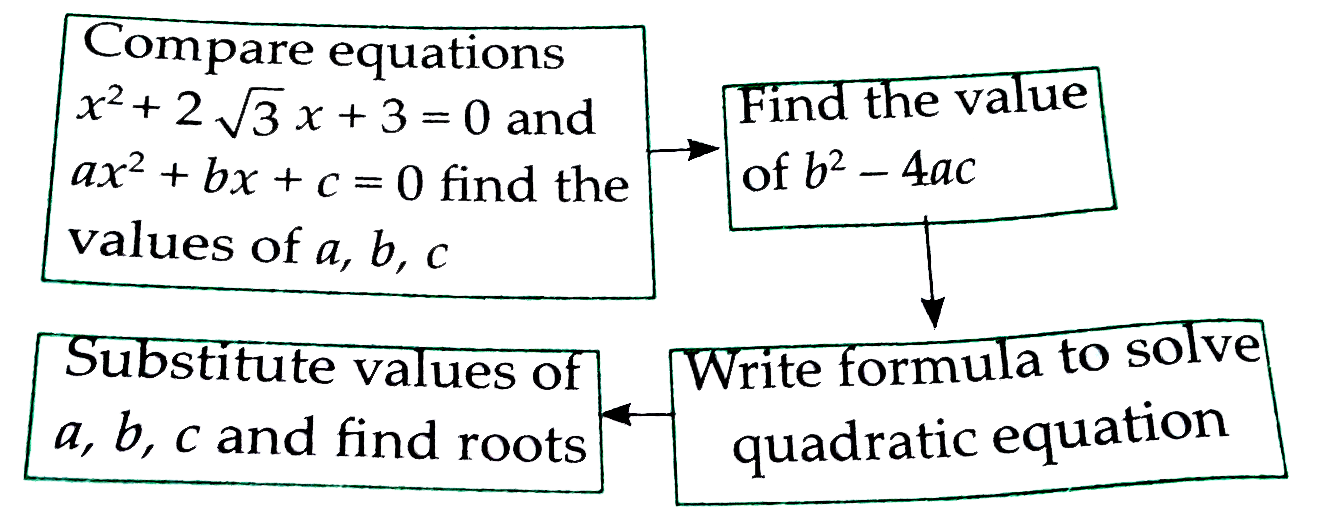
With the help of the flow chart given below solve the equation x2+2√3x+3=0 using formula.
 Solution in Tamil
The correct Answer is:The root of given quadratic equation is −√3.
Step by step video & image solution for With the help of the flow chart given below solve the equation x^(2)+2sqrt(3)x+3=0 using formula. by Maths experts to help you in doubts & scoring excellent marks in Class 10 exams.
Updated on:21/07/2023Topper's Solved these Questions
- QUADRATIC EQUATIONSBook:CHETAN PUBLICATIONChapter:QUADRATIC EQUATIONSExercise:PRACTICE SET 2.5
Explore 15 Videos
- QUADRATIC EQUATIONSBook:CHETAN PUBLICATIONChapter:QUADRATIC EQUATIONSExercise:PRACTICE SET 2.6
Explore 10 Videos
- QUADRATIC EQUATIONSBook:CHETAN PUBLICATIONChapter:QUADRATIC EQUATIONSExercise:PRACTICE SET 2.3
Explore 6 Videos
- PYTHAGORAS THEOREMBook:CHETAN PUBLICATIONChapter:PYTHAGORAS THEOREMExercise:ASSIGNMENT -5
Explore 1 Video
- SIMILARITY Book:CHETAN PUBLICATIONChapter:SIMILARITY Exercise:ASSIGNMENT-1
Explore 12 Videos
Similar Questions
Find the value of discriminant.
x2+7x−1=0
View SolutionProduct of Pragati's age 2 years ago and 3 years hence is 84. Find her present age.
View SolutionSolve the following quatratic equations by completing square method :
x2+x−20=0
View SolutionSolve the following sub question :
In an equilateral triangle ABC, the side BC is trisected at D. prove that 9AD2=7AB2
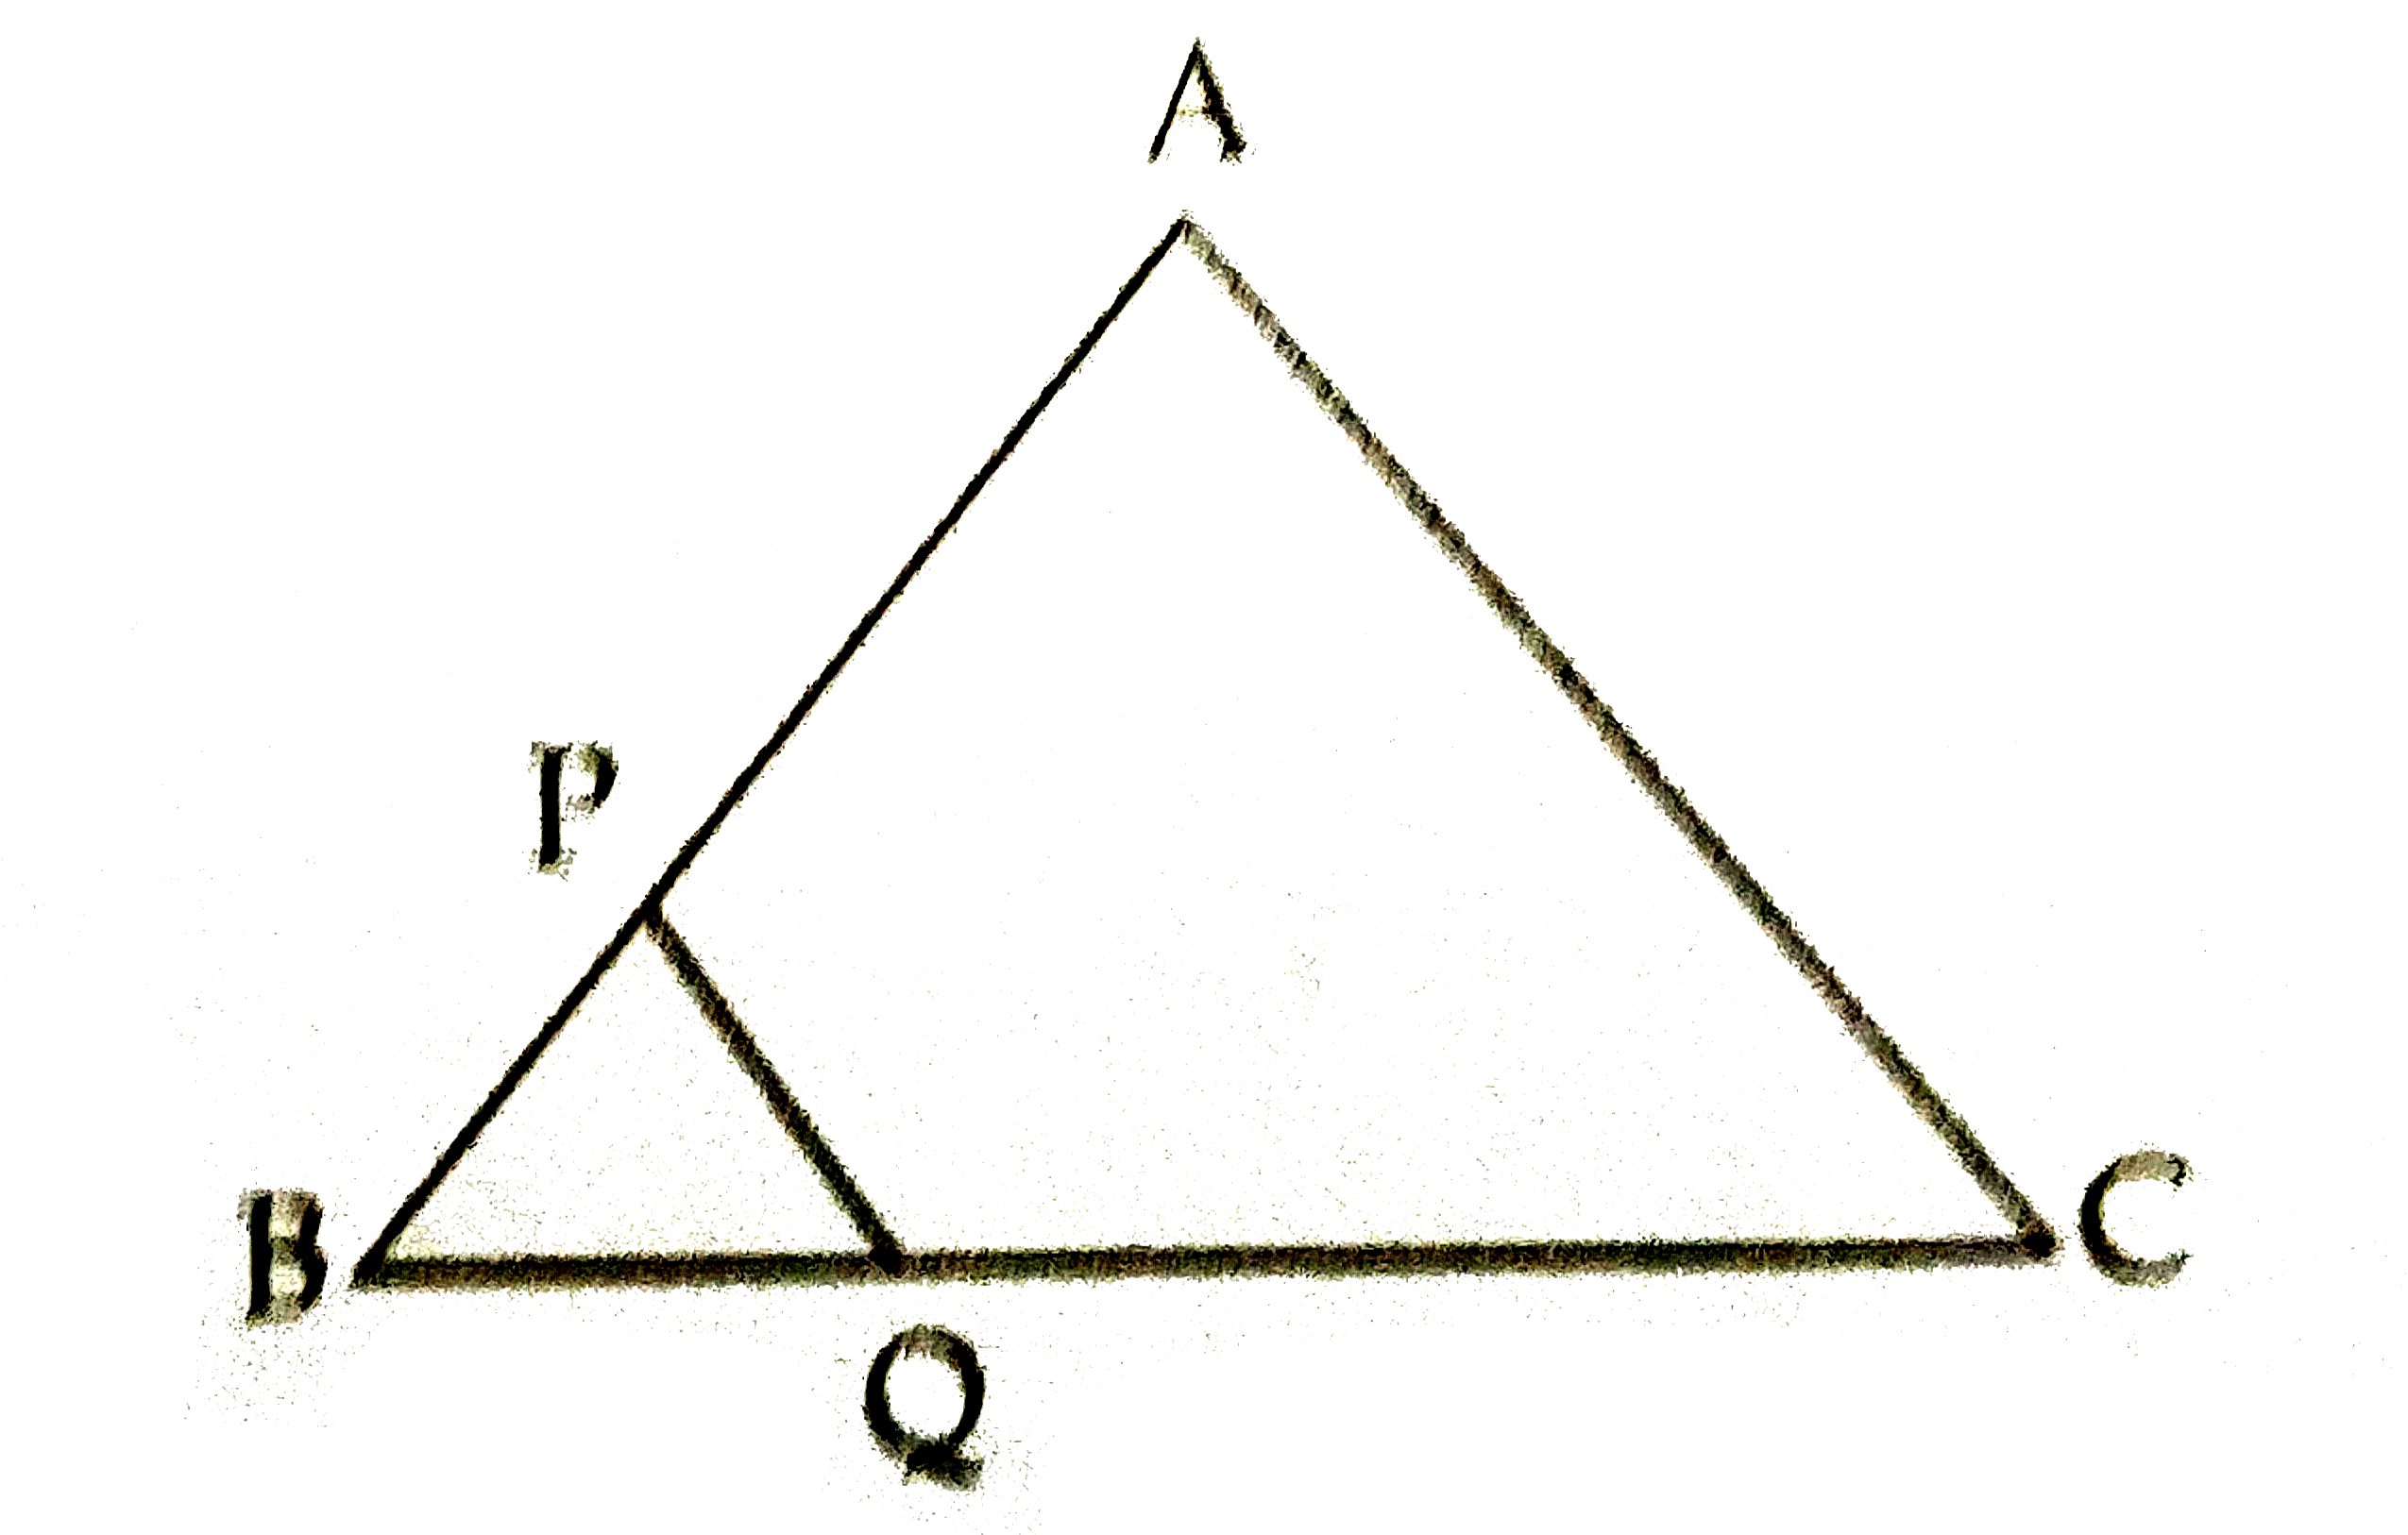
View SolutionSelect the appropriate alternative : In the adjoining figure ,PQ∣∣AC.BP=6,PA=8,BQ=9 , then QC = ……………

View SolutionDetermine the point of symmetry of a regular hexagon.
View SolutionDtermine the images of the following figure about the given line :
View SolutionMatch the following Column A to Column B

View SolutionMatch the following Column A to Column B

View SolutionMatch the following Column A to Column B

View SolutionFind the area of figure given below.

View SolutionFind the perimeter of the figure given below.

View SolutionFind the area of the figure given below.

View SolutionThe area of the shaded part in the figure given below is ______.

View SolutionThe inequation represented by the graph given below is :
View SolutionThe inequation that best describes the graph given below is _________
View Solution

