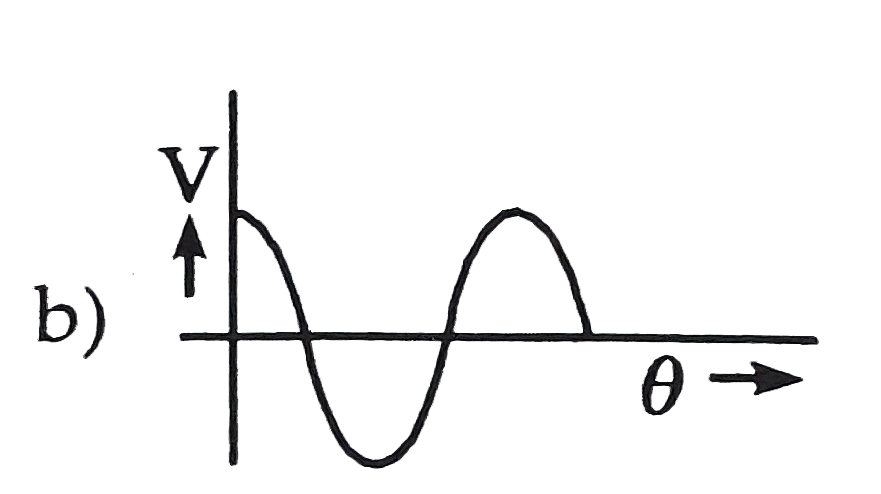
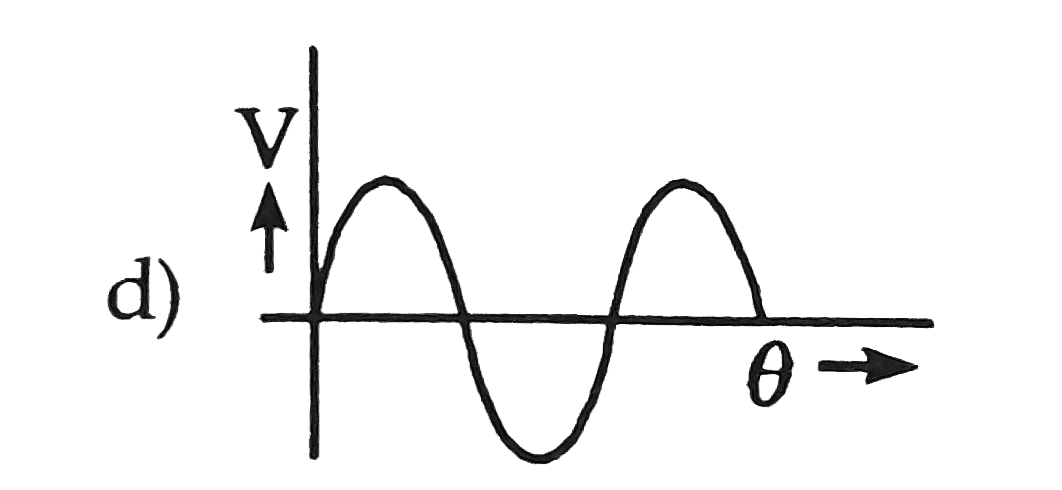
Keeping r constant a graph is plotted by varying both 0 and the potential V due to the magnetic dipole.Which is a correct graph in the figure given below?


The correct Answer is:B
To solve the problem of determining the correct graph of potential V versus angle θ for a magnetic dipole while keeping r constant, we can follow these steps:
Step 1: Understand the Formula for Magnetic Potential
The potential V due to a magnetic dipole at a point in space is given by the formula:
V=μ04π⋅mcosθr2
where:
- μ0 is the permeability of free space,
- m is the magnetic dipole moment,
- r is the distance from the dipole,
- θ is the angle between the dipole moment and the line connecting the dipole to the point of interest.
Step 2: Analyze the Relationship Between V and θ
From the formula, we see that V is directly proportional to cosθ:
V∝cosθ
This means that as θ varies, V will vary in a manner that follows the cosine function.
Step 3: Determine the Characteristics of the Cosine Function
The cosine function has the following characteristics:
- It starts at 1 when θ=0,
- It decreases to 0 when θ=90∘,
- It becomes negative as θ approaches 180∘,
- It is periodic with a period of 360∘.
Step 4: Identify the Correct Graph
Since V is proportional to cosθ, the graph of V versus θ will resemble the graph of cosθ but scaled by the factor μ0m4πr2. The graph will not start from zero; instead, it will start from a positive value when θ=0.
Step 5: Conclusion
Based on the characteristics of the cosine function and the relationship derived from the formula, the correct graph will be the one that resembles the cosine function starting from a positive value.
Thus, the correct answer is option B, which represents the graph of V versus θ.
---
The potential V due to a magnetic dipole at a point in space is given by the formula:
V=μ04π⋅mcosθr2
where:
- μ0 is the permeability of free space,
- m is the magnetic dipole moment,
- r is the distance from the dipole,
- θ is the angle between the dipole moment and the line connecting the dipole to the point of interest.
From the formula, we see that V is directly proportional to cosθ:
V∝cosθ
This means that as θ varies, V will vary in a manner that follows the cosine function.
The cosine function has the following characteristics:
- It starts at 1 when θ=0,
- It decreases to 0 when θ=90∘,
- It becomes negative as θ approaches 180∘,
- It is periodic with a period of 360∘.
Since V is proportional to cosθ, the graph of V versus θ will resemble the graph of cosθ but scaled by the factor μ0m4πr2. The graph will not start from zero; instead, it will start from a positive value when θ=0.
Based on the characteristics of the cosine function and the relationship derived from the formula, the correct graph will be the one that resembles the cosine function starting from a positive value.
Topper's Solved these Questions
Similar Questions
If a graph is plotted between 1/v and 1/u , which one of the graph shown in figure is approximately correct ?
View Solution(a) Obtain the expression for the potential due to a point charge.
(b) Use the above expression to show that the potential, due to an electric dipole (length 2a), varies as the inverse square' of the distance r of the 'field point' from the centre of the dipole for r>a.
View Solution
Knowledge Check
Which of the graph between potential energy and time is correct ?
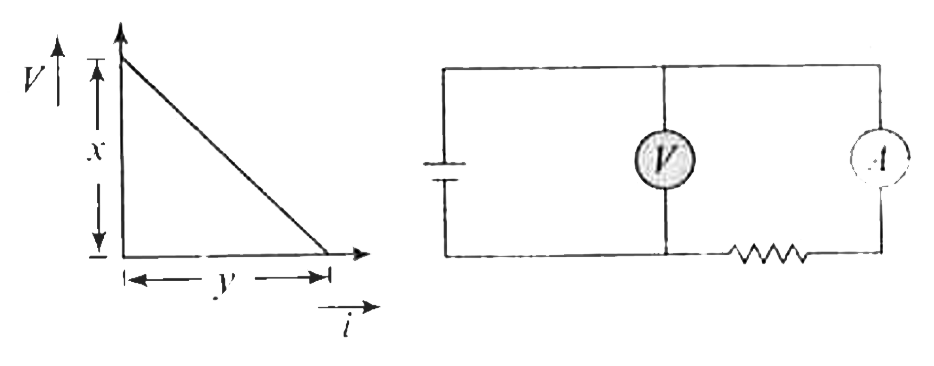
AABBCEDFIn an experiment, a graph was plotted of the potential difference V between the terminals of a cell against the circuit current i by varying load rheostat. Internal conductance of the cell is given by
 AxyByxCxyD(x−y)
In an experiment, a graph was plotted of the potential difference V between the terminals of a cell against the circuit current "I" by varying load rheostat, internal conductance of the cell is given by
 AxyBy/xCx/yD(x-y)
Potential Due to Point Charges||V vs X Graph
View SolutionA short electric dipole has dipole moment p. Find the distance of farthest point from the dipole where (a) potential due to the dipole is V0 (b) Electric field due to the dipole is E0
View SolutionA spring of spring constant k is stretched by distance r. Obtain formula for elastic potential energy of a stretched spring. Plot graph of energies versus distance.
View SolutionThe ratio of magnitude of magnetic induction (B)at any point due to short magnetic dipole and the magnetic potential (V) at that point is given by
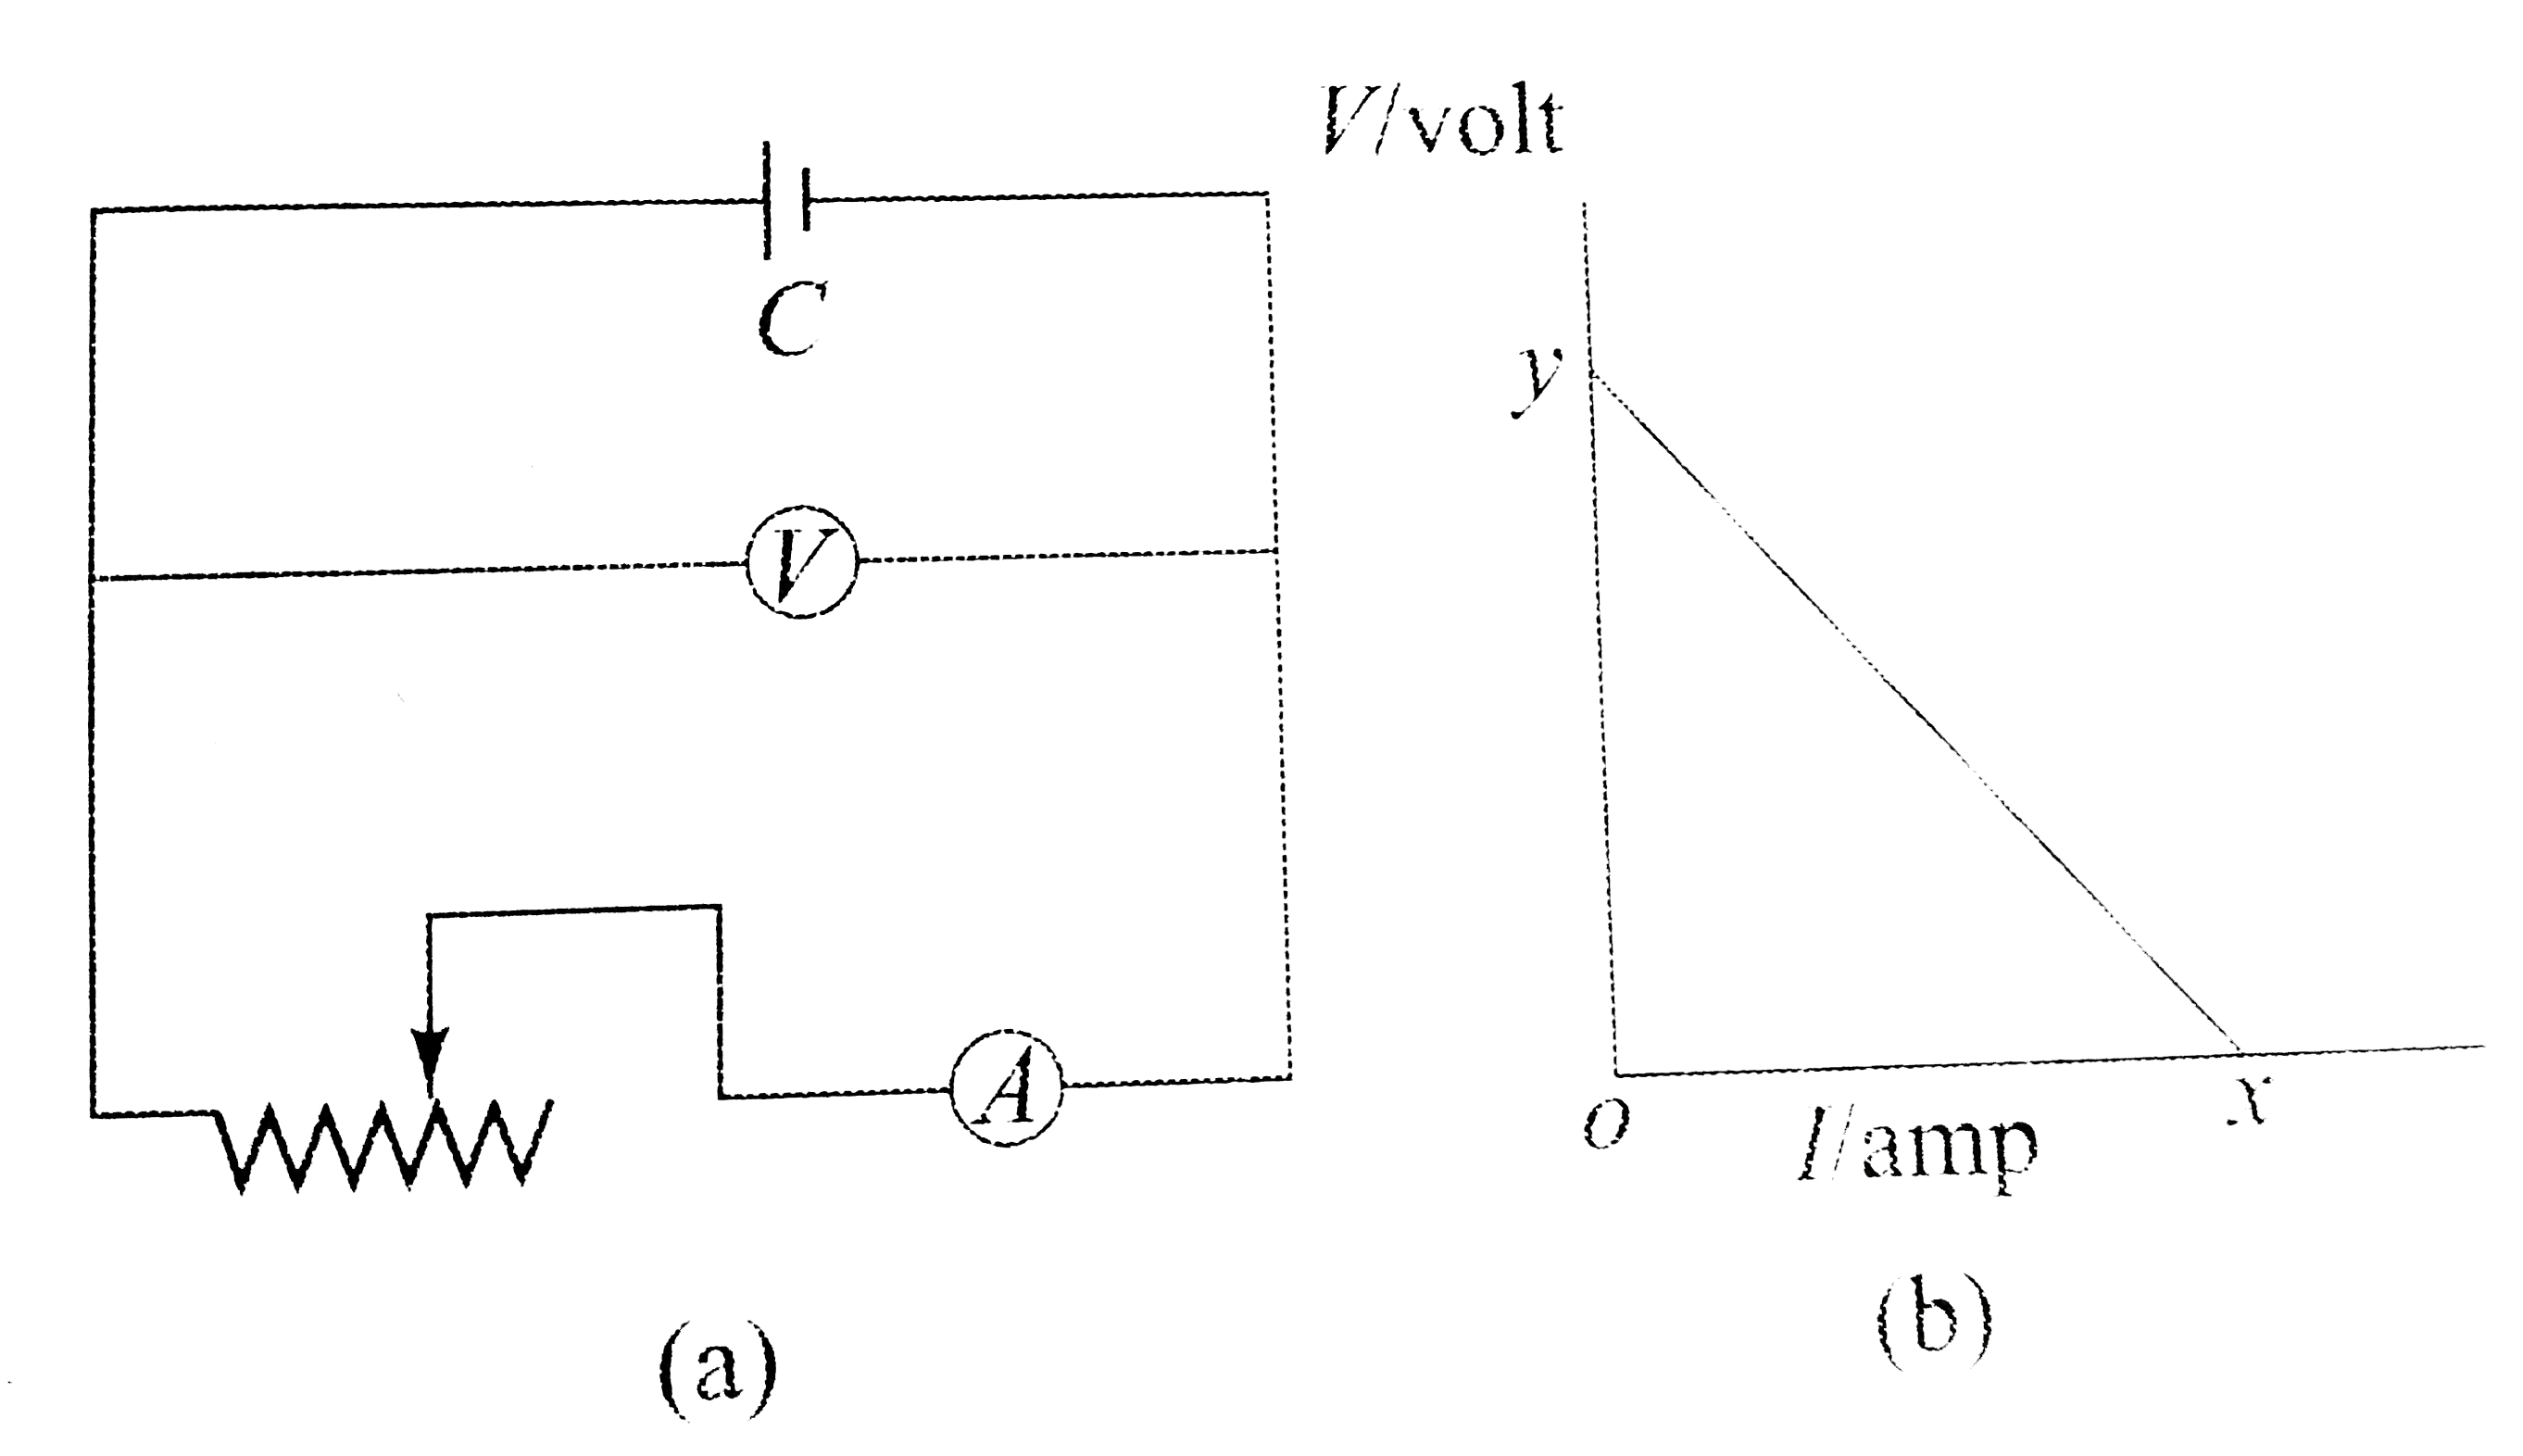
View Solutionshows a circuit used in an experiment to determine the emf and internal resistance of the battery C. A graph was plotted of the potential difference V between the terminals of the battery against the current I, which was varied by adjusting the rheostat. The graph is shown in x and y are the intercepts of the graph with the axes as shown. What is the internal resistance of the battery?

View Solution

