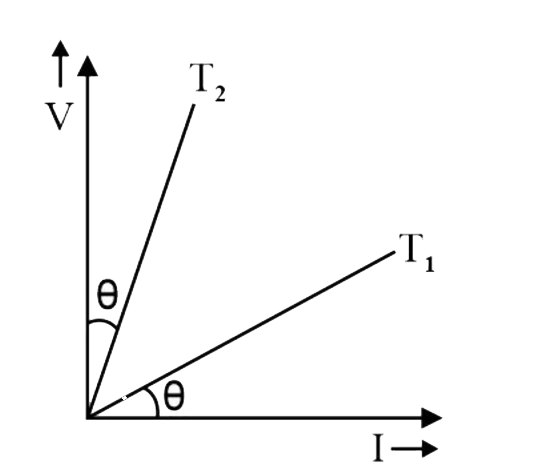
The V - I graph for a conductor makes angle θ with V-axis. Here V denotes voltage and I denotes current. What is the resistance of this conductor?
sinθ
cosθ
tanθ
cotθ
The correct Answer is:D
Slope of graph =tan(90−θ)=VI=R
∴cotθ=R
Topper's Solved these Questions
- CURRENT ELECTRICITYBook:NIKITA PUBLICATIONChapter:CURRENT ELECTRICITYExercise:Multiple Choice Questions
Explore 314 Videos
- COMMUNICATION SYSTEMSBook:NIKITA PUBLICATIONChapter:COMMUNICATION SYSTEMSExercise:Multiple Choice Questions (Examples for Practice)
Explore 8 Videos
- ELASTICITYBook:NIKITA PUBLICATIONChapter:ELASTICITYExercise:MCQ
Explore 314 Videos
Similar Questions
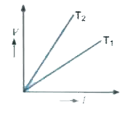
The voltage-current (V-I) graph of a metallic conductor at two different temperature T1 and T2 is shown in figure. At which temperature is the resistance higher?
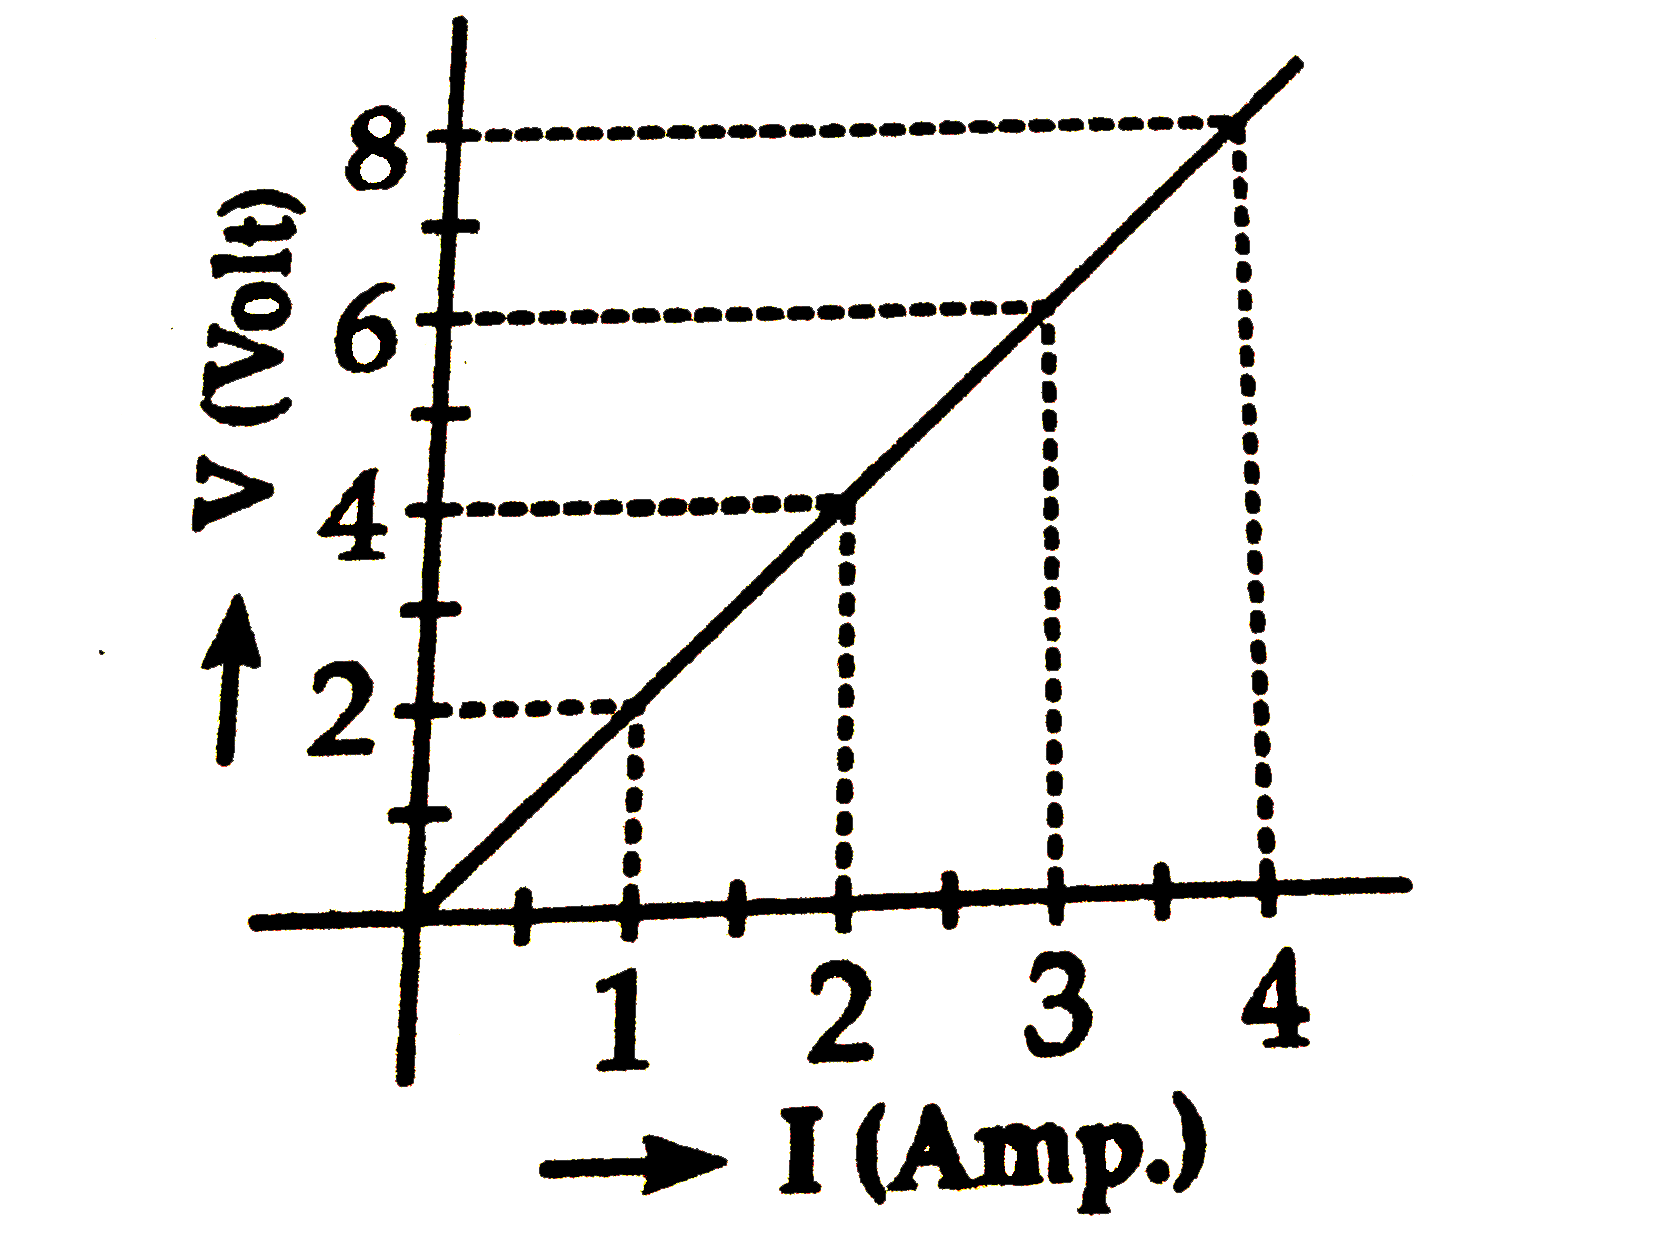
View SolutionVariation of current and voltage in a conductor is shown in the adjoining figure. The resistance of the conductor is
View Solution
Knowledge Check
The V-I graph for a good conductor makes angle 42∘ with V-axis. Here V denotes voltage and I denotes current. Then the resistance of the conductor will be
Asin42∘Bcos42∘Ctan42∘Dcot42∘The V-I graph for a good conductor makes angle 40∘ with V-axis. Here, V denotes voltage and I denotes current. The resistance of the conductor will be
Asin40∘Bcos40∘Ctan40∘Dcot40∘The slope of voltage (V) versus current (I) is called
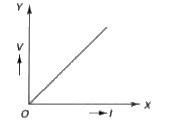 AresistanceBconductanceCresistivityDconductivity
If the potential difference across the ends of a conductor is i volt and the current flowing through the conductor is 1 ampere,the resistance of the conductor?
View SolutionAssertion : Current versus potential difference (i-V) graph for a conductor at two different temperatures T1 and T2 is shown in figure. Hence T1>T2.
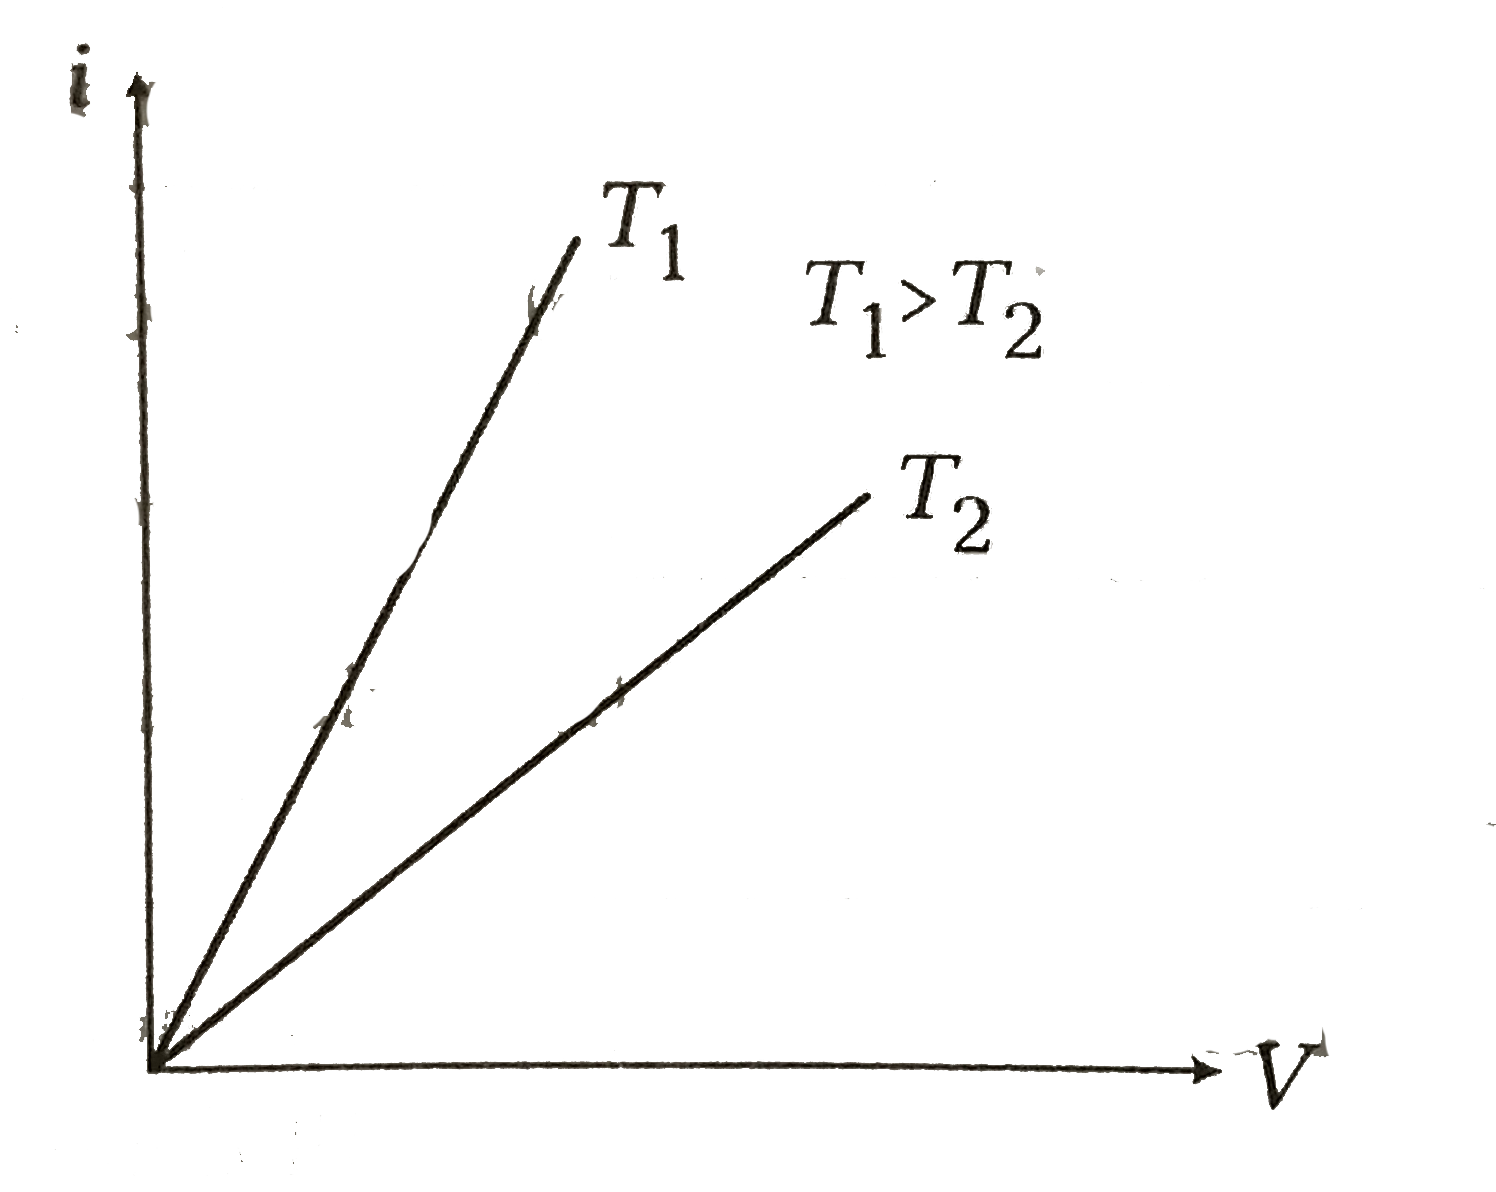
Reason : Resistance of a conductor increases with rise in temperature.
View SolutionWhich of the following I-V characteristic represent the characteristic of a Ohmic conductor?
View SolutionIn an AC circuit with voltage V and current I, the power dissipated is
View SolutionThe V - I graphs for a conductor at temperature T1andT2 are shown in the figure (T2−T1) is proportional to
View Solution

