For production of steel ________ is used .
AOP
BOP
COP
DOP
The correct Answer is:D
BOP-basic Oxygen Process
Topper's Solved these Questions
- GENERAL PRINCIPLES AND PROCESSES OF ISOLATION OF ELEMENTSBOOK - MARVEL PUBLICATIONCHAPTER - GENERAL PRINCIPLES AND PROCESSES OF ISOLATION OF ELEMENTSEXERCISE - Previous Years Entrance Exams MCQ
13 Videos
- GENERAL PRINCIPLES AND PROCESSES OF ISOLATION OF ELEMENTSBOOK - MARVEL PUBLICATIONCHAPTER - GENERAL PRINCIPLES AND PROCESSES OF ISOLATION OF ELEMENTSEXERCISE - Test Your Grasp
30 Videos
- ELECTROCHEMISTRYBOOK - MARVEL PUBLICATIONCHAPTER - ELECTROCHEMISTRYEXERCISE - Test your Grasp
50 Videos
- HALOGEN DERIVATIVES OF ALKANES (AND ARENES)BOOK - MARVEL PUBLICATIONCHAPTER - HALOGEN DERIVATIVES OF ALKANES (AND ARENES)EXERCISE - TEST YOUR GRASP
15 Videos
Similar Questions
The given bar chart shows production of steel by companies A , B , C and D for years 2014 ,2015, 2016
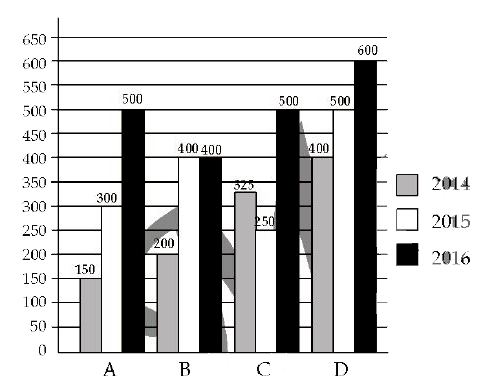
In the given pie chart, the average production of steel at C for the year 2014-2016 is:
View SolutionThe given bar chart production of steel by companies A , B, c and D for years 2014 ,2015, 2016
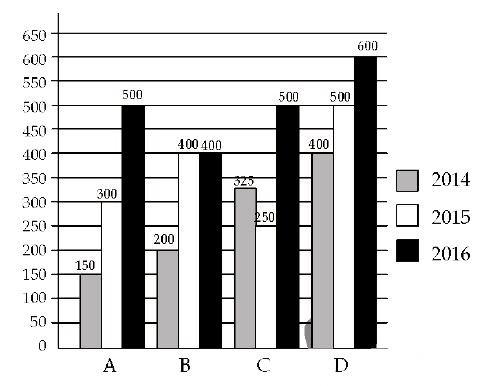
In the given bar chart which company has the maximum total production of steel
View Solution
Knowledge Check
Production of iron and steel is based on
Athe reduction of iron oxidesBthe removal of impuritiesCaddition of carbon and alloying metals such as Cr, Mn and NiDAll of the aboveThe line graph shows the production of steel of a certain country. Study the diagram and answer the following questions.
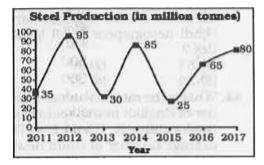
If 1 tonne of steel costs Rs. 30,000, what was the cost (in Rs billion) of the steel production in the year 2017?A240B3000C2400D300The line graph shows the production of steel of a certain country. Study the diagram and answer the following questions.
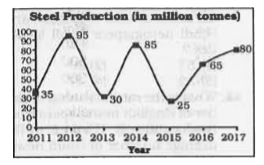
The steel production in 2012 was greater than that in 2015 by _____.A80%B73.6%C200%D280%
The given bar chart shows production of steel by companies A, B, C and D for years 2014, 2015, 2016 (in tonnes).
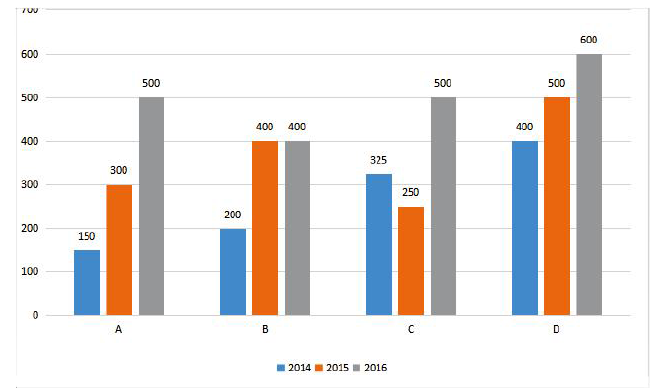
In the given bar-chart, the average production of steel at ‘C’ for the year 2014-2016 is:
View SolutionThe given bar chart shows production of steel by companies A, B, C and D for years 2014, 2015, 2016 (in tonnes).
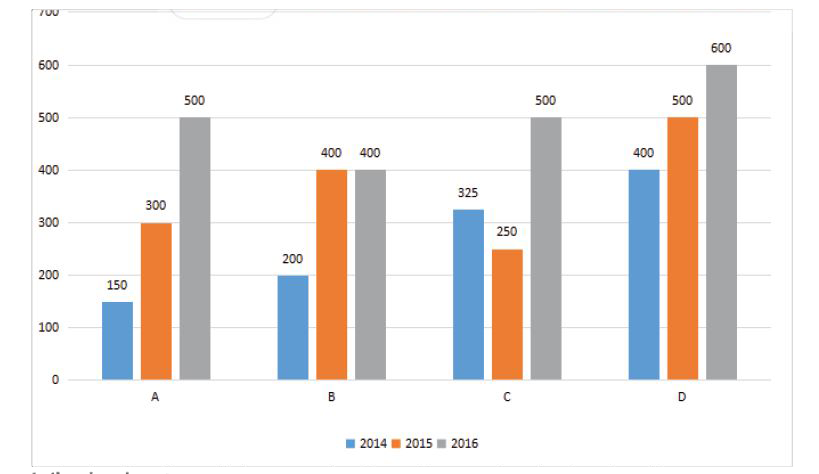
In the given bar-chart, which company has the maximum total production of steel?
View SolutionThe given bar chart shows production of steel by companies A , B , C and D for years 2014 ,2015, 2016
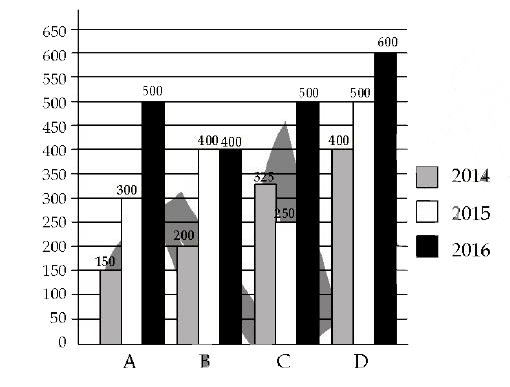
In the given pie chart,what is the percentage production of B in 2014 to the total production of 2014.
View SolutionThe given bar chart shows production of steel by companies A. B, C and D for years 2014, 2015, 2016 (in tonnes).
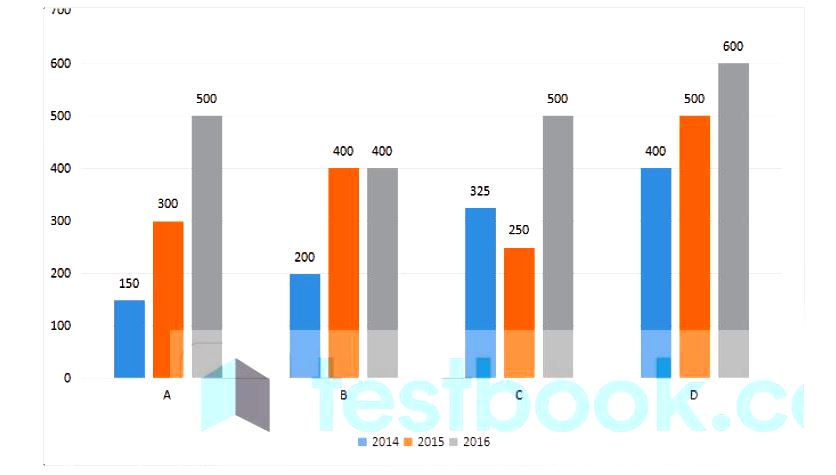
In the given bar-chart, what is the percentage production of ‘B‘ in 2014 to the total production of 2014?
View SolutionThe line graph shows the production of steel of a certain country. Study the diagram and answer the following questions.
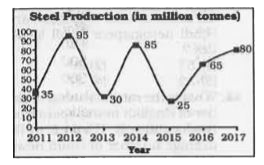
In which year was the steel production lesser than that of the previous year?
View Solution
