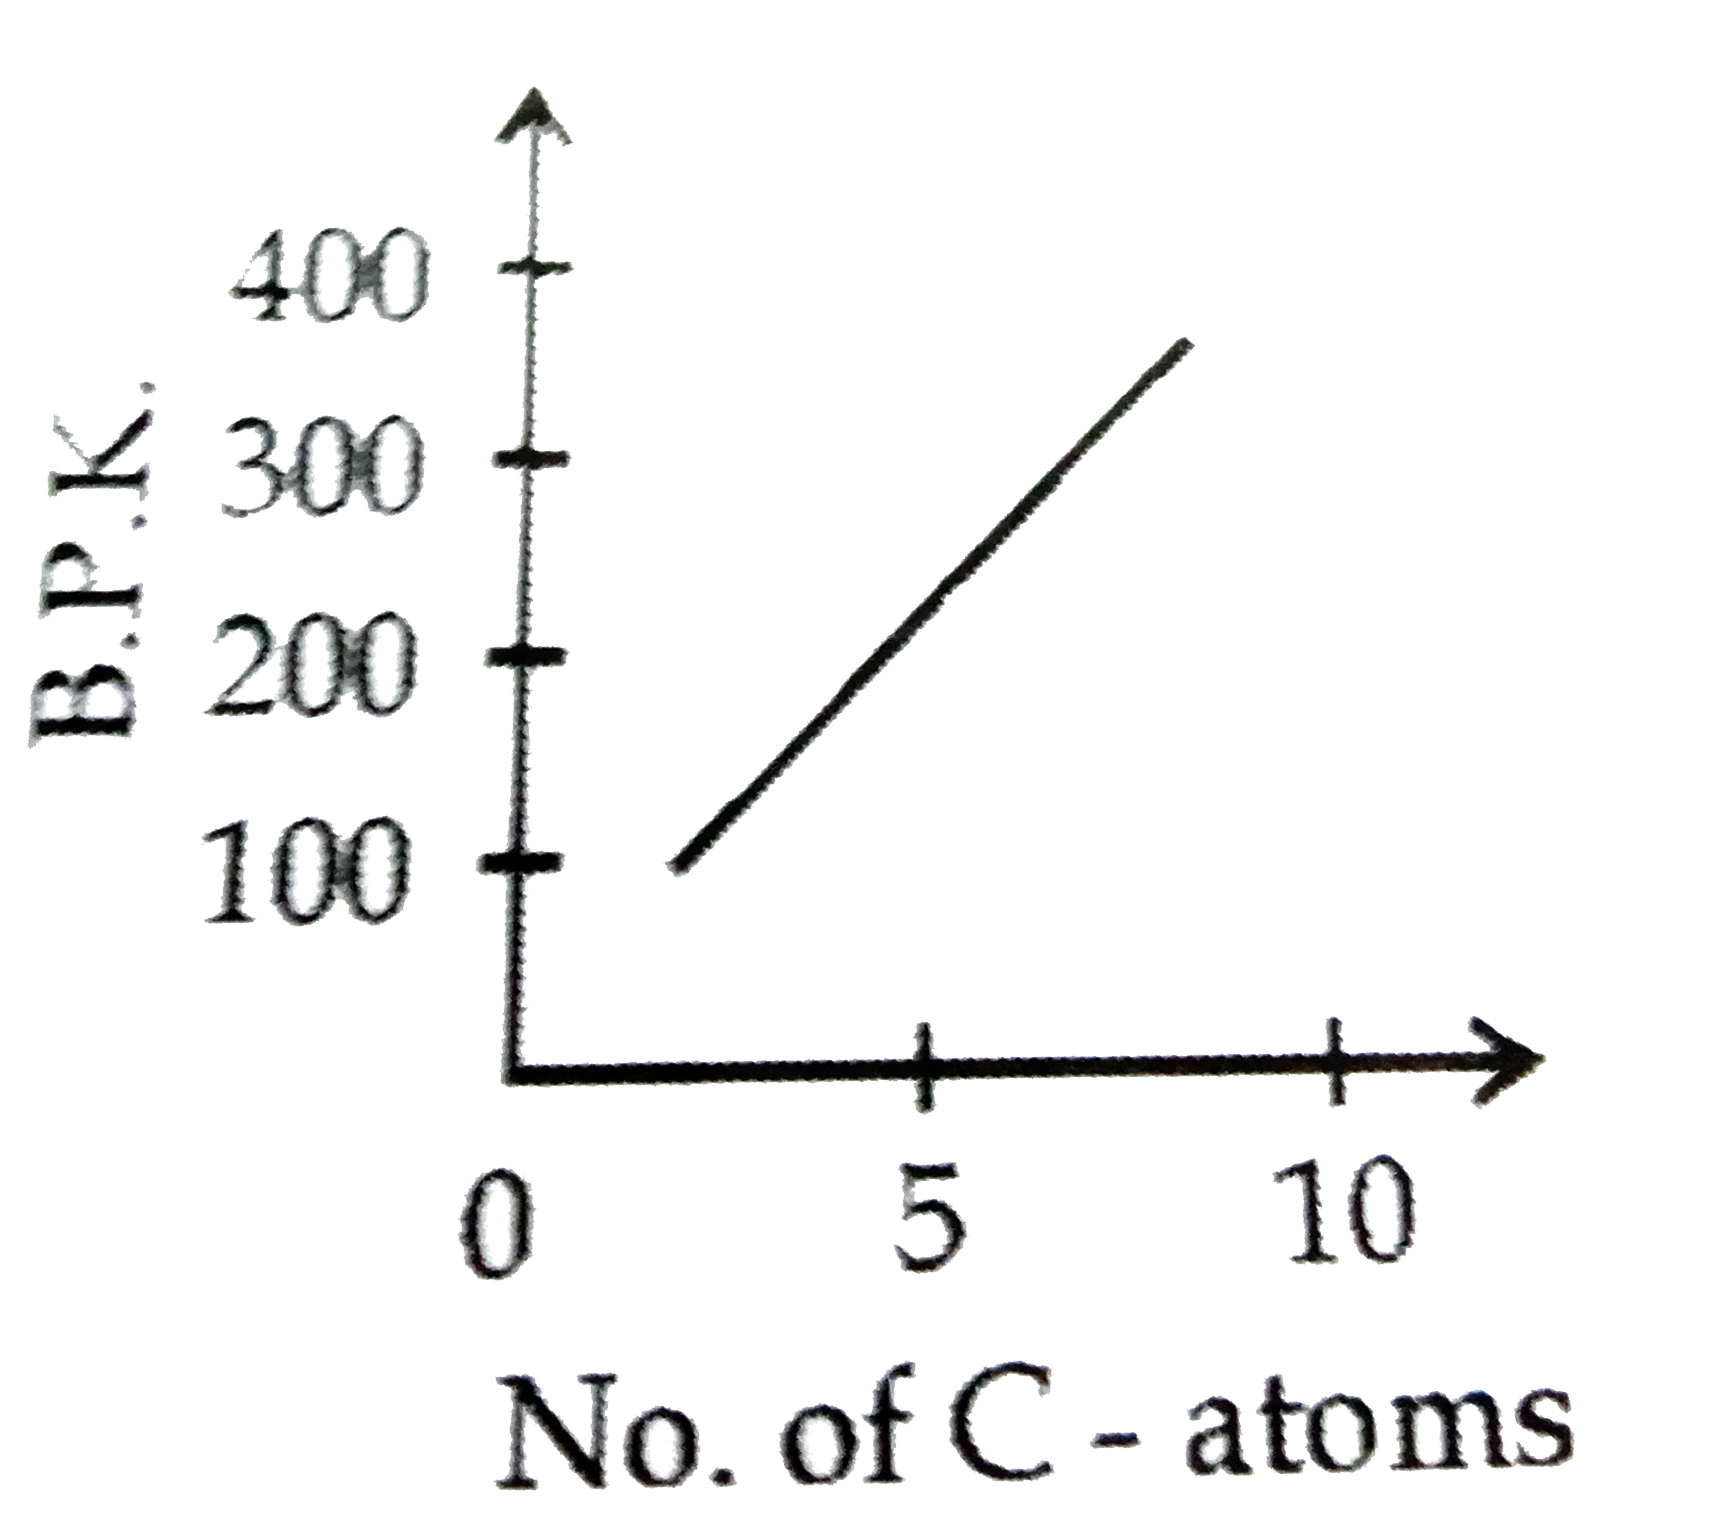
When the boiling points of the first ten normal alkanes are plotted the graph looks like:
A
B
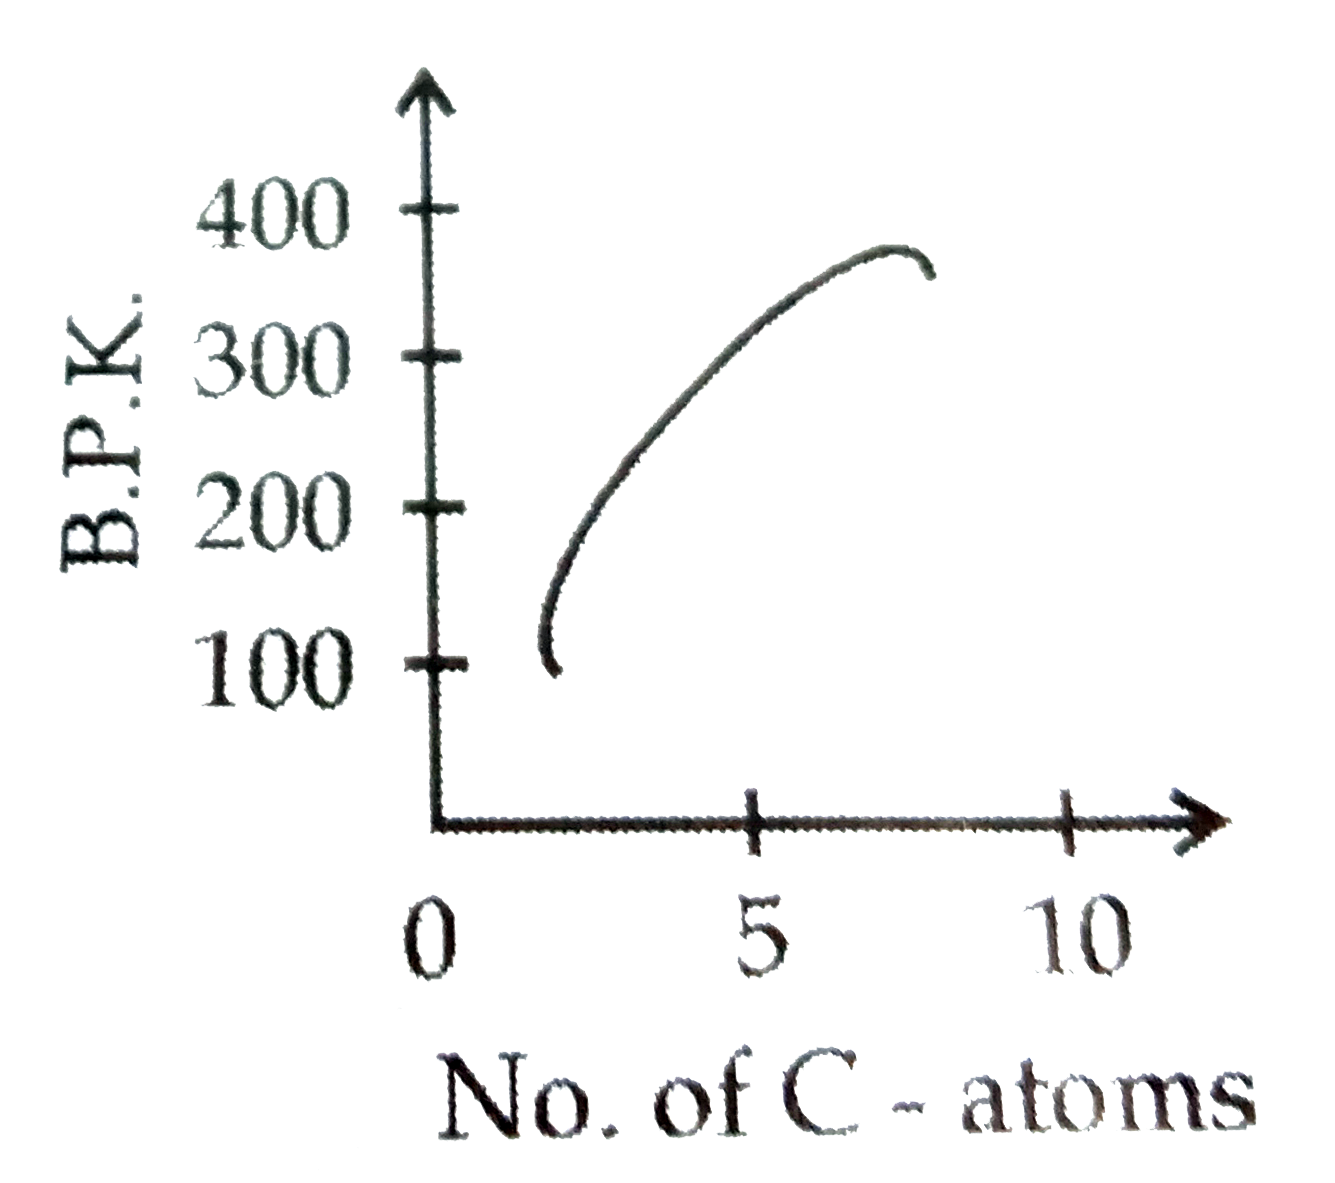
C
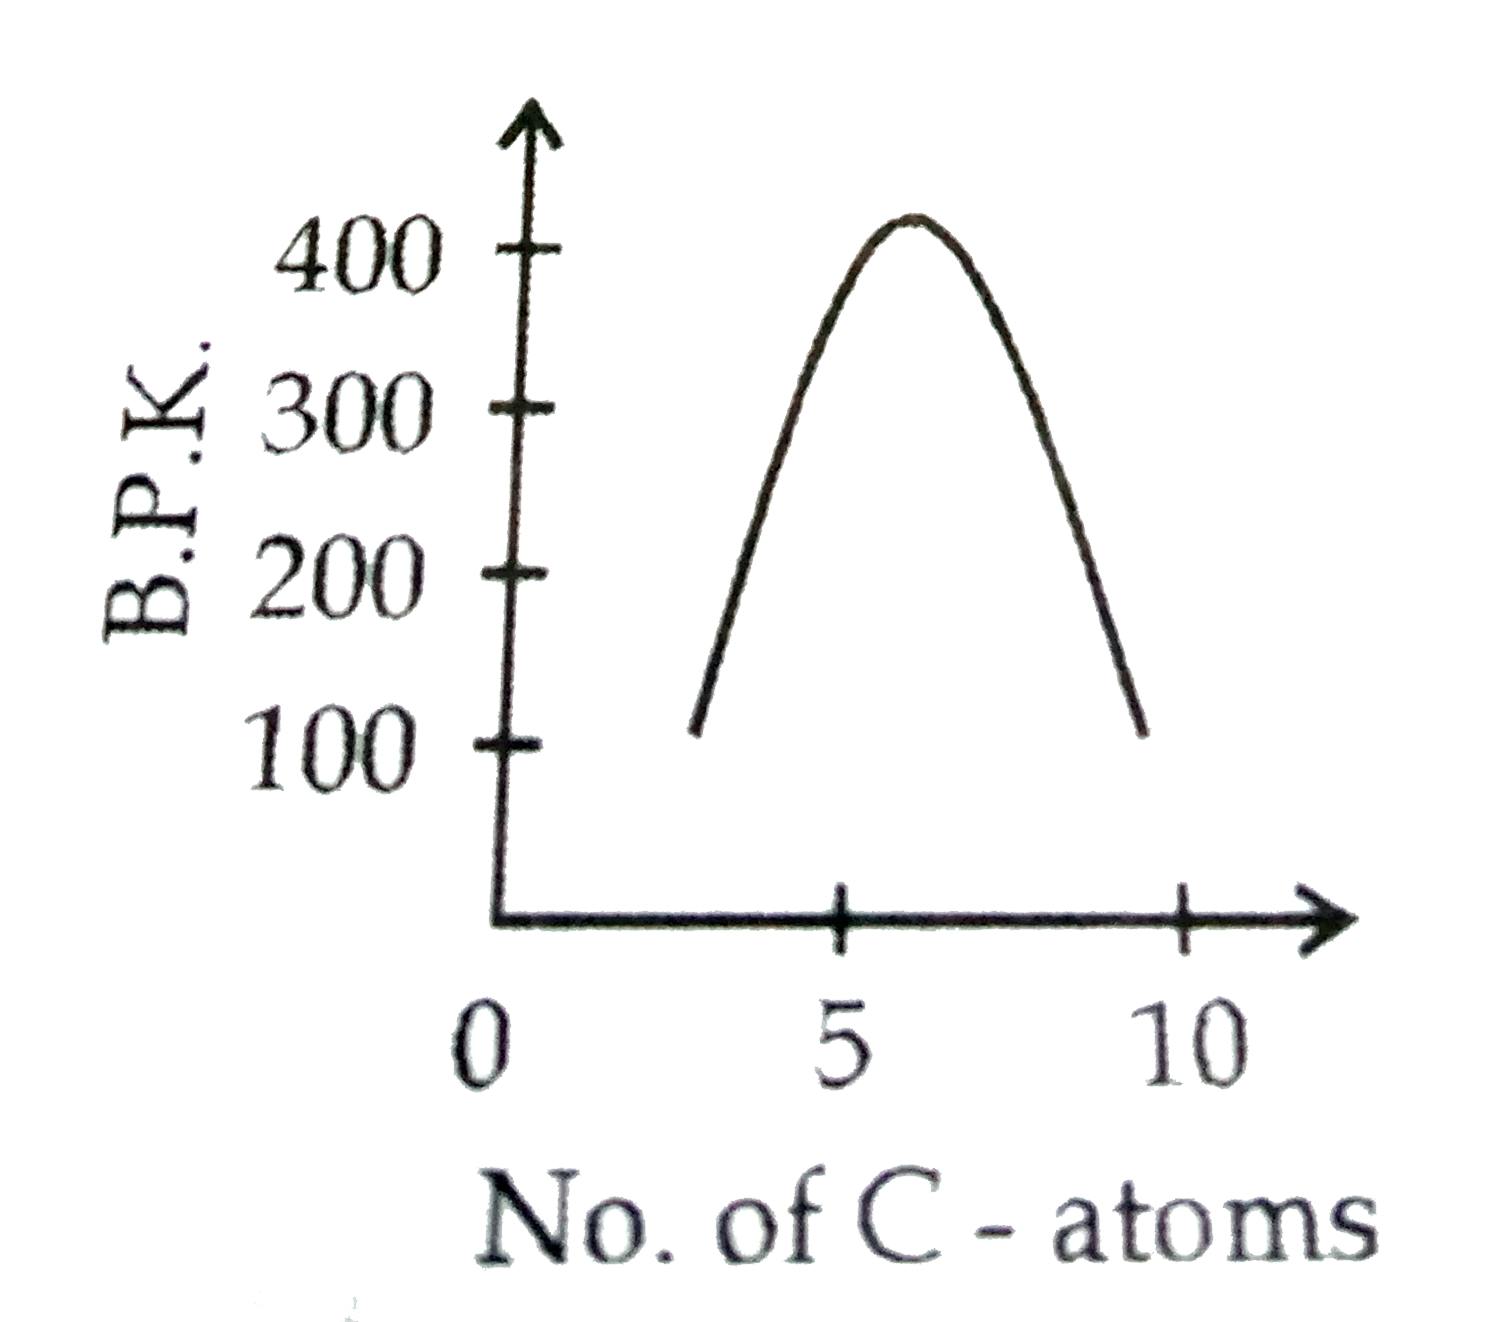
D
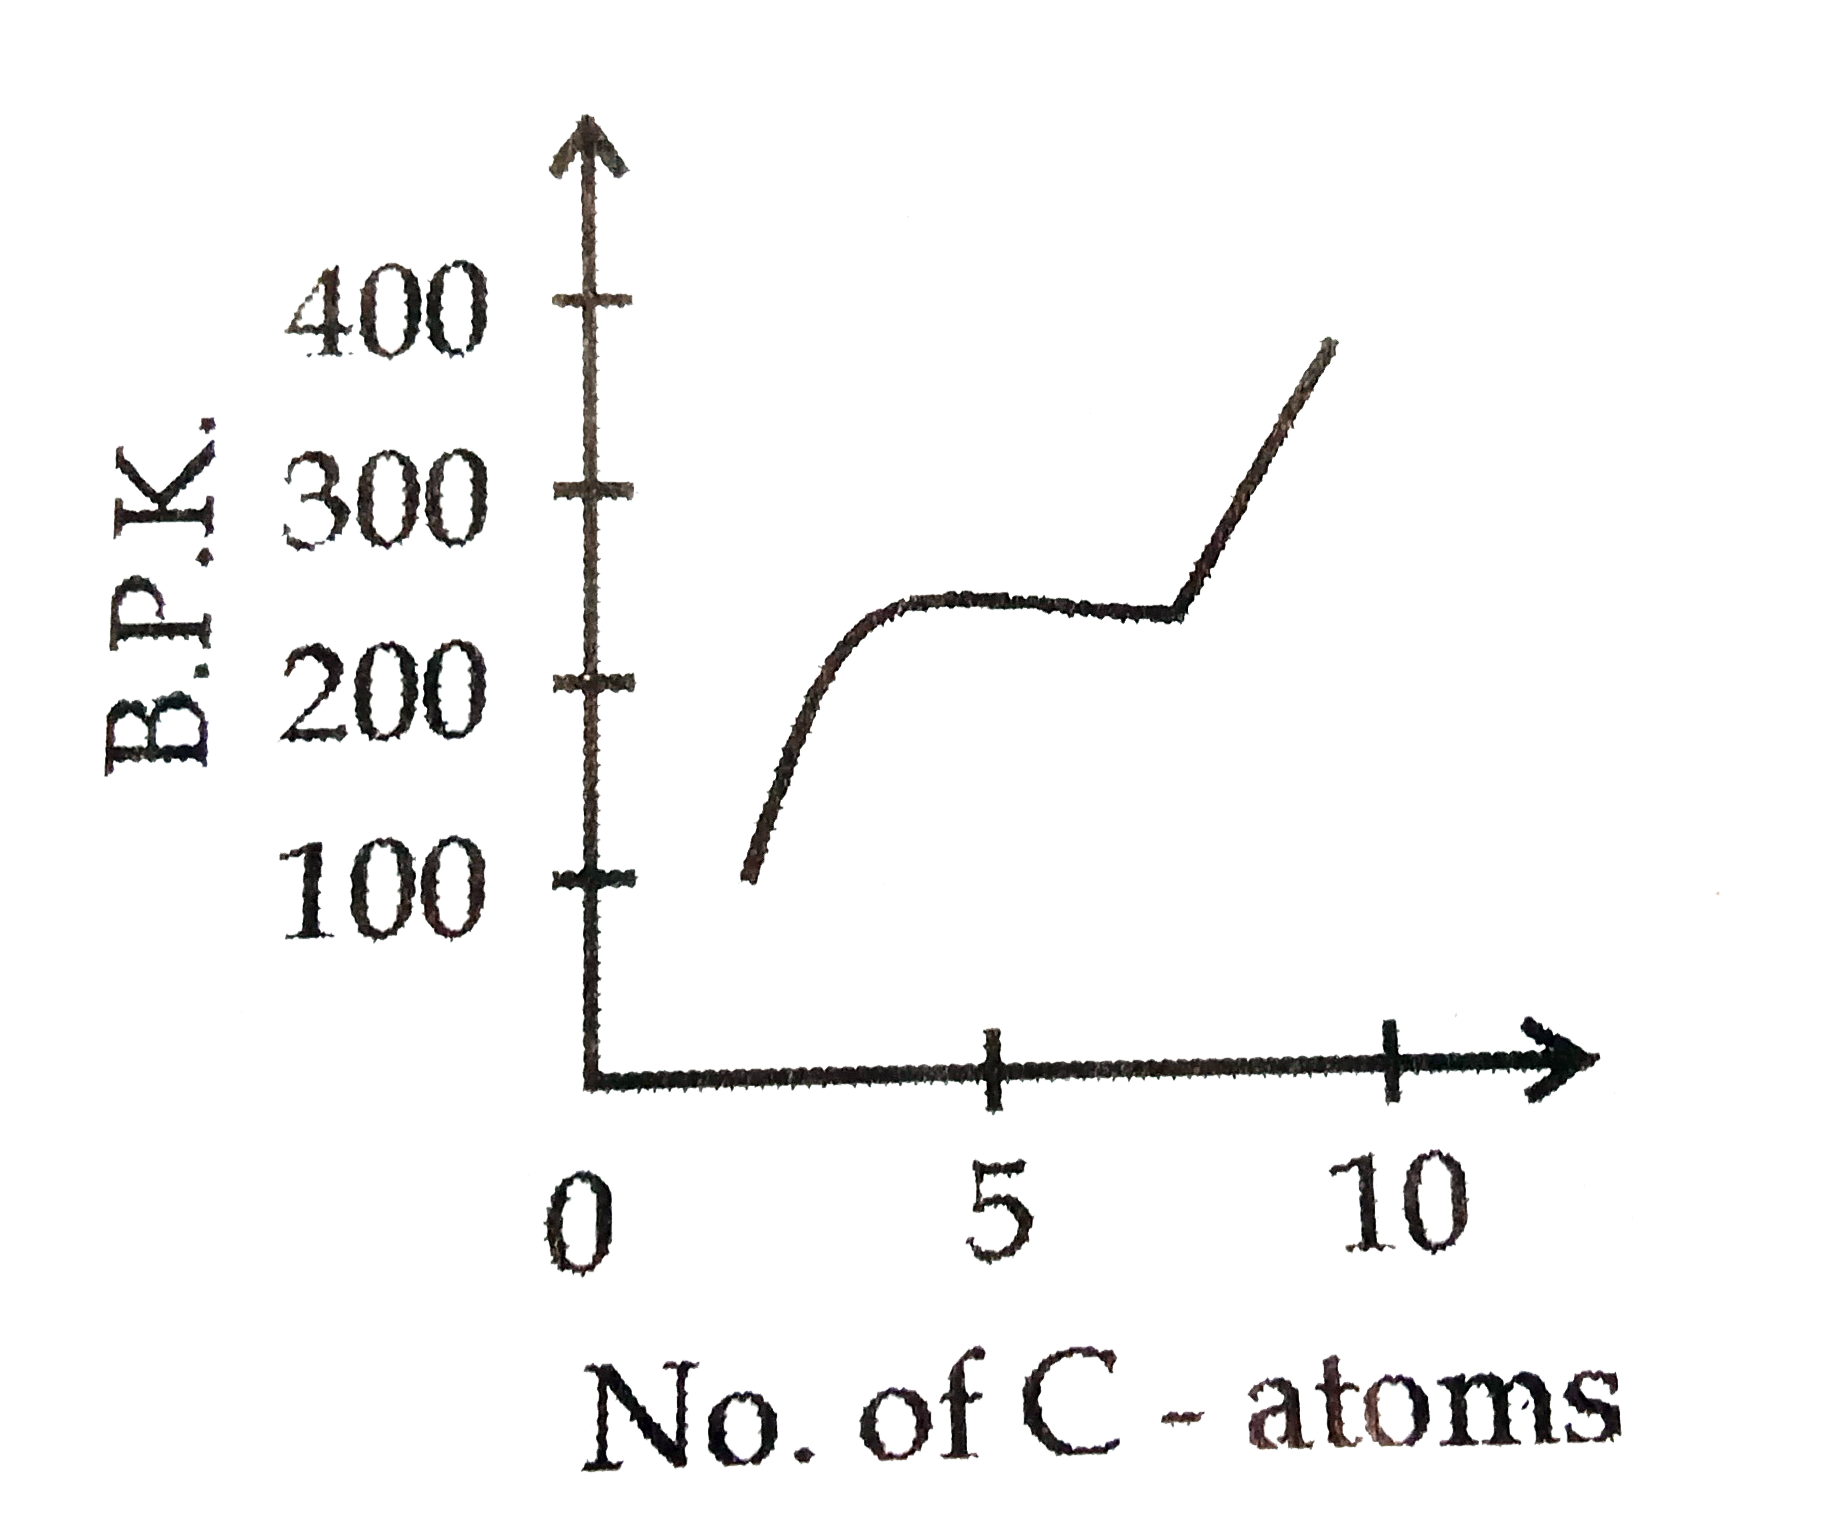
Video Solution
Text Solution
The correct Answer is:A

For first four member b.p. increases linearly. Then the change in b.p. as the isomerism starts form C4H10
|
Topper's Solved these Questions
Similar Questions
Knowledge Check
When the boiling points of the first ten normal alkanes are plotted the graph looks like:
A B
B C
C D
D
When boiling point of water is reached,
Awater exists in liquid state.Bwater exists in gaseous stateCwater exists in liquid and gaseous state.Dwater evaporatesWhen boiling point of water is reached,
Awater exists in liquid state.Bwater exists in gaseous stateCwater exists in liquid and gaseous state.Dwater evaporates
The boiling point of alcohol is much more higher than alkane due to
View SolutionThe normal boiling point of the liquid is approximately
View SolutionWhat is the normal boiling point of the solution represented by the phase diagram ?
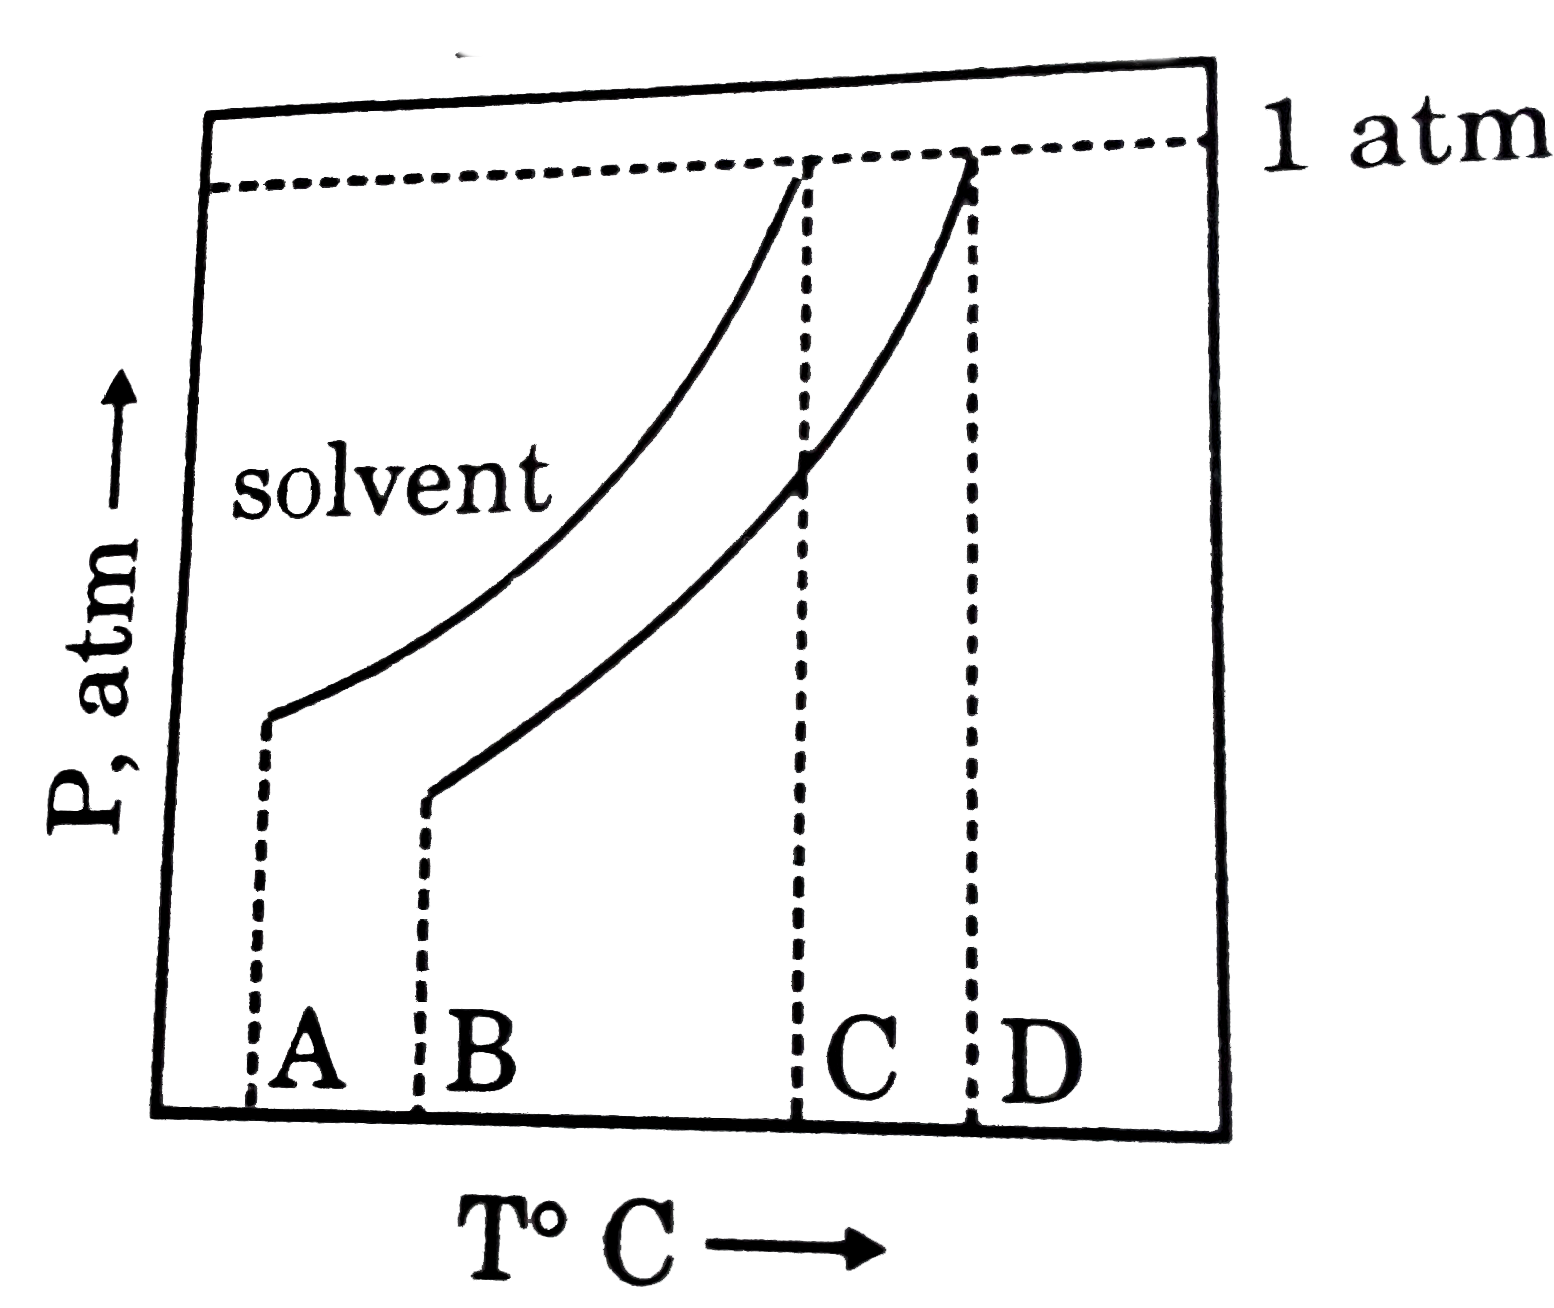
View SolutionWhat is the normal boiling point of the solution represented by the phase diagram ?
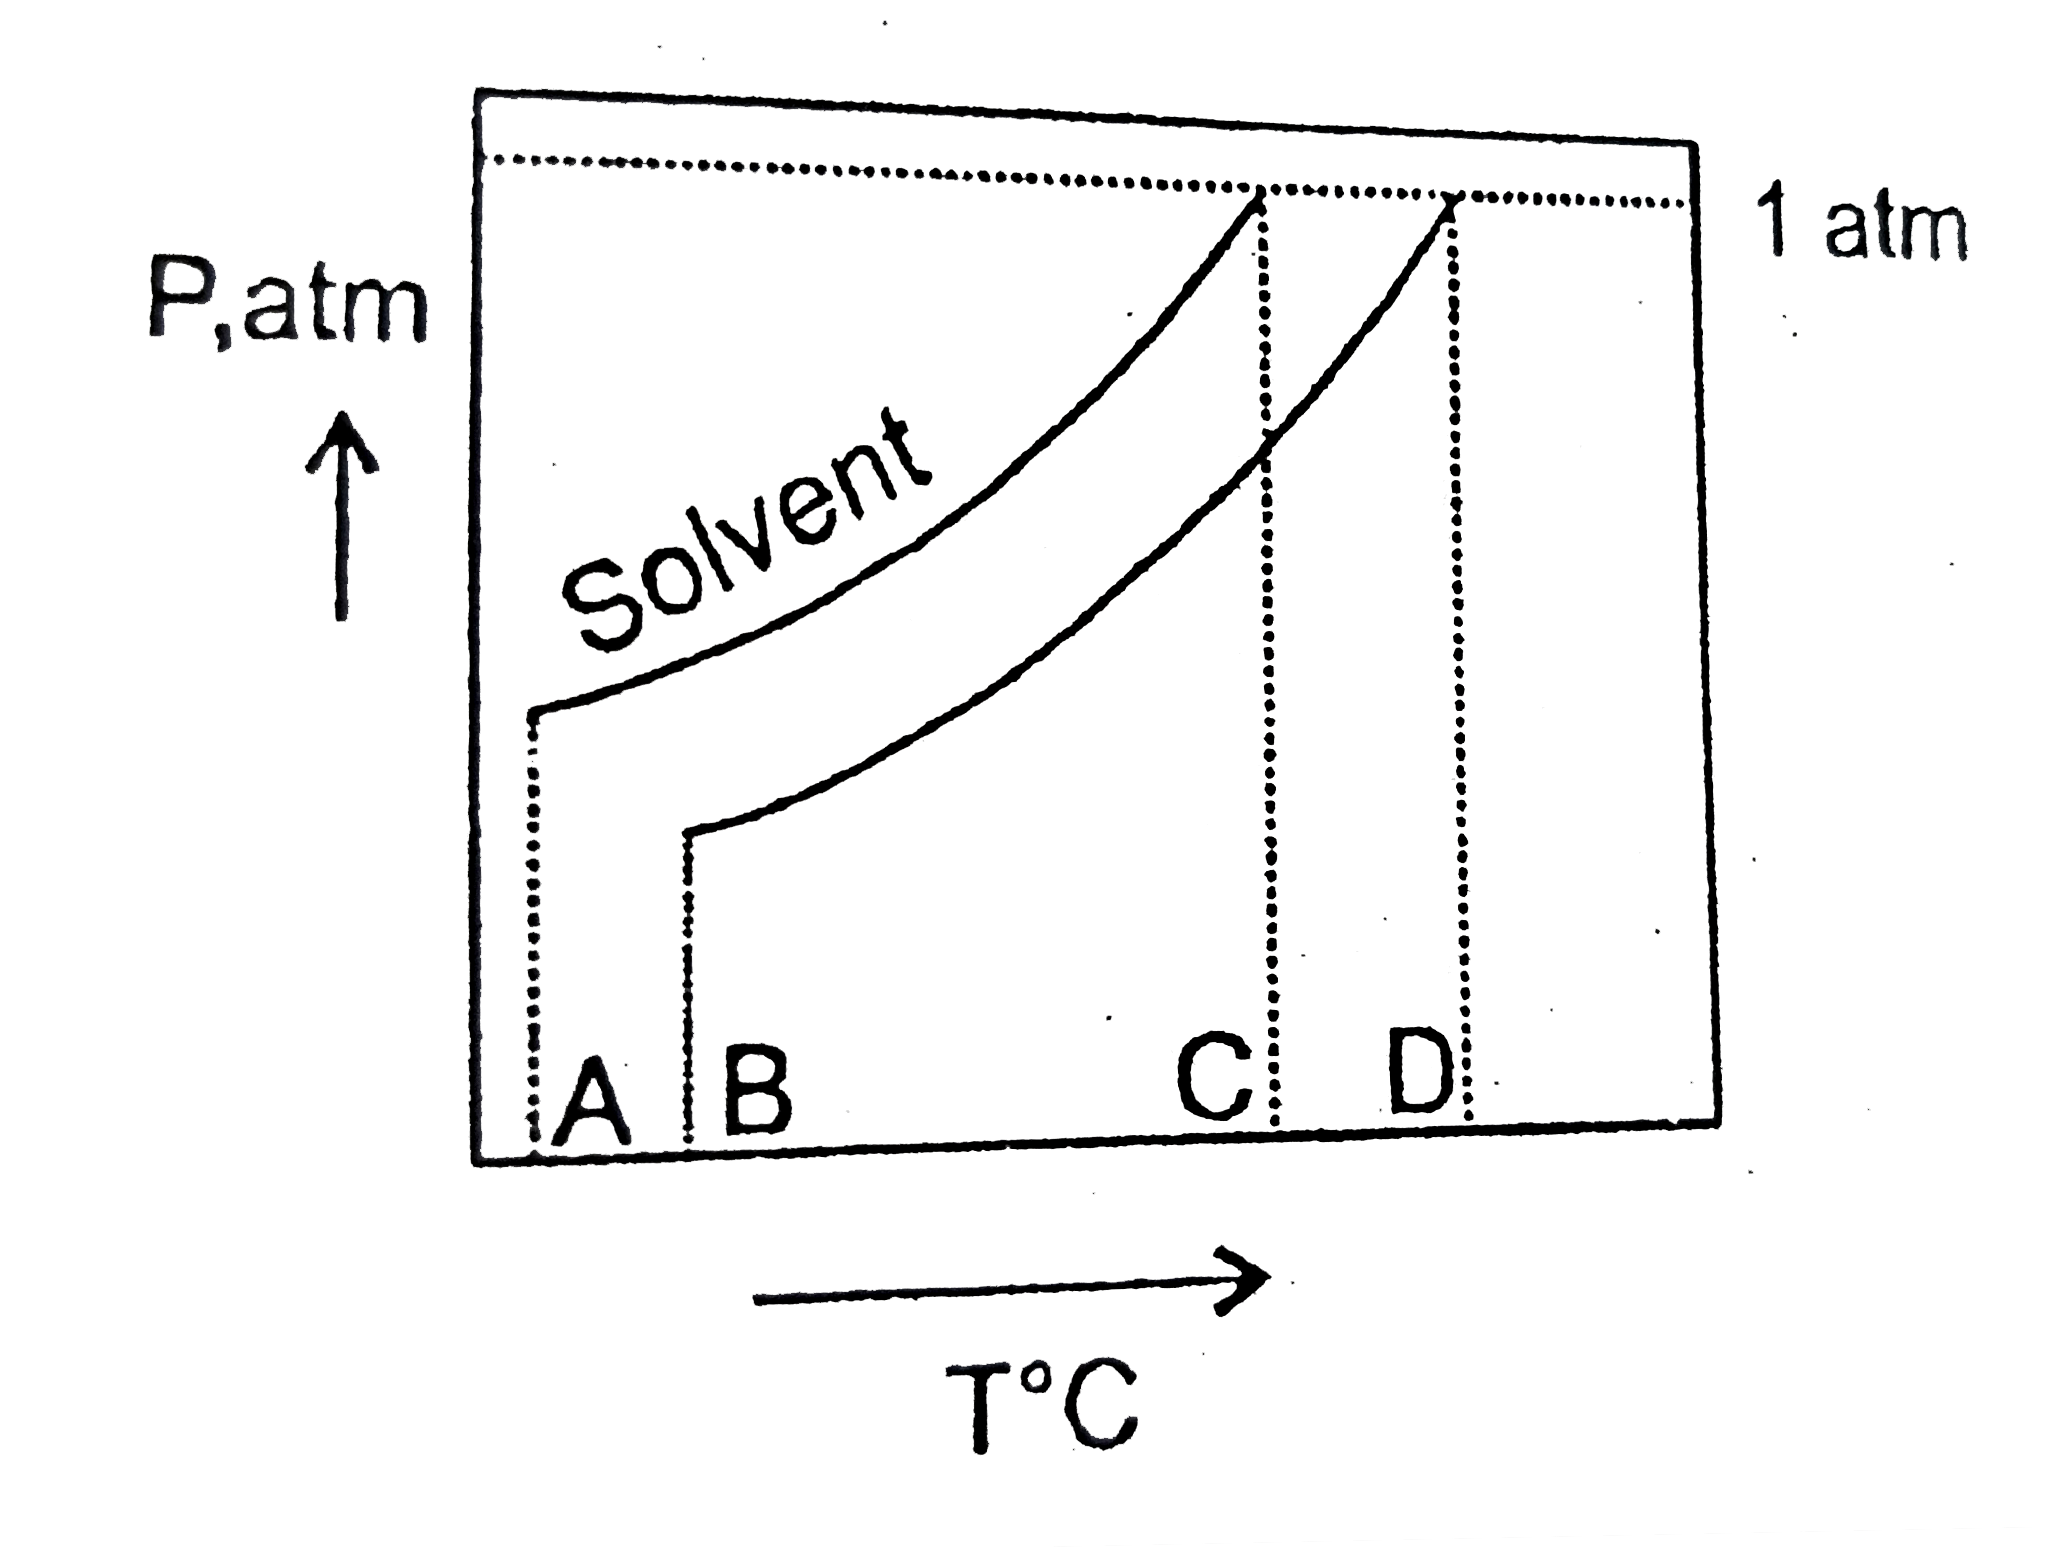
View SolutionA student measures the focal length of a convex lens by putting an object pin at a distance u from the lens and measuring the distance v of the image pin. The graph between u and v plotted by the student should look like
View Solution
