A long solenoid 'S' has 'n' turns per meter, with diameter 'a'. At the centre of this coil, we place a smallar coil of 'N' tunrs and diameter 'b' (where b lt a). If the current in the solenoid increase linearly with time, what is the induced emf apperaing in the smaller coil. Plot graph showing nature of variation in emf, if current varies as a function of mt2+C.
As per data given in the question, magnetic field due to current in solenoid S, B=μ0nI
Magnetic flux linked with the smaller coil due to this field is
ϕ=NBA, where A = area of smaller coil =πb2
∴ emf induced in the smaller coil, e=−dϕdt=−ddt(NBπb2)=−Nπb2ddt(μ0nI)=−Nπb2μ0ndIdt
As current I varies as a function of (t2+C), therefore,
e=−Nnπμ0b2ddt(mt2+C)=−Nnπμ0b2(2mt)
=−μ0Nnπb2(2mt)
Negative sign indicates that emf induced oppose the main current in the long solenoid.
From (i), we find that
Hence, the variation of induced emf |e| with time t is representedd by a straight line graph as shown in Fig.

Topper's Solved these Questions
- ELECTROMAGNETIC INDUCTION & ALTERNATING CURRENTBook:PRADEEPChapter:ELECTROMAGNETIC INDUCTION & ALTERNATING CURRENTExercise:Solved Examples (b)
Explore 1 Video
- ELECTROMAGNETIC INDUCTION & ALTERNATING CURRENTBook:PRADEEPChapter:ELECTROMAGNETIC INDUCTION & ALTERNATING CURRENTExercise:Short Answer Qusetions
Explore 2 Videos
- DUAL NATURE OF RADIATION AND MATTERBook:PRADEEPChapter:DUAL NATURE OF RADIATION AND MATTERExercise:Exercise
Explore 191 Videos
- ELECTROMAGNETIC WAVESBook:PRADEEPChapter:ELECTROMAGNETIC WAVESExercise:II Focus multiple choice question
Explore 5 Videos
Similar Questions
Knowledge Check
An ideal solenoid of cross-sectional area 10−4m2 has 500 turns per metre. At the centre of this solenoid, another coil of 100 turns is wrapped closely around it. If the current in the coil changes from 0 to 2 A in 3.14 ms, the emf developed in the second coil is
A1 mvB2 mvC3 mvD4 mvA long solenoid has n turns per metre and current IA is flowing through it. The magnetic field induciton at the ends of the solenoid is
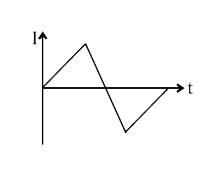
AμonI2BμonICZeroD2μonICurrent through the coil varies according to graph then induced emf v/s time graph is
 A
A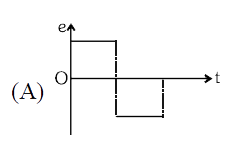 B
B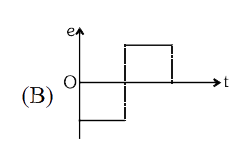 C
C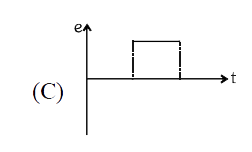 D
D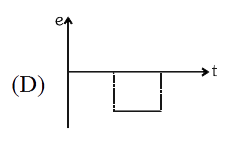
A long solenoid with 15 turns per cm has a small loop of area 2.0 cm2 placed inside the solenoid normal to its axis. If the current carried by the solenoid changes steadily from 2.0 A to 4.0 A in 0.1 s, what is the induced emf in the loop while the current is changing ?
View SolutionThe mutual inductance between two coils is 0.5H.It the current in one coil is changed at the rate of 5A/s,what will be the emf induced in the other coil?
View SolutionThe mutual inductance between two coils is 2.5 H. If the current in one coil is changed at the rate of 1 As^(-1), what will be the emf induced in the other coil?
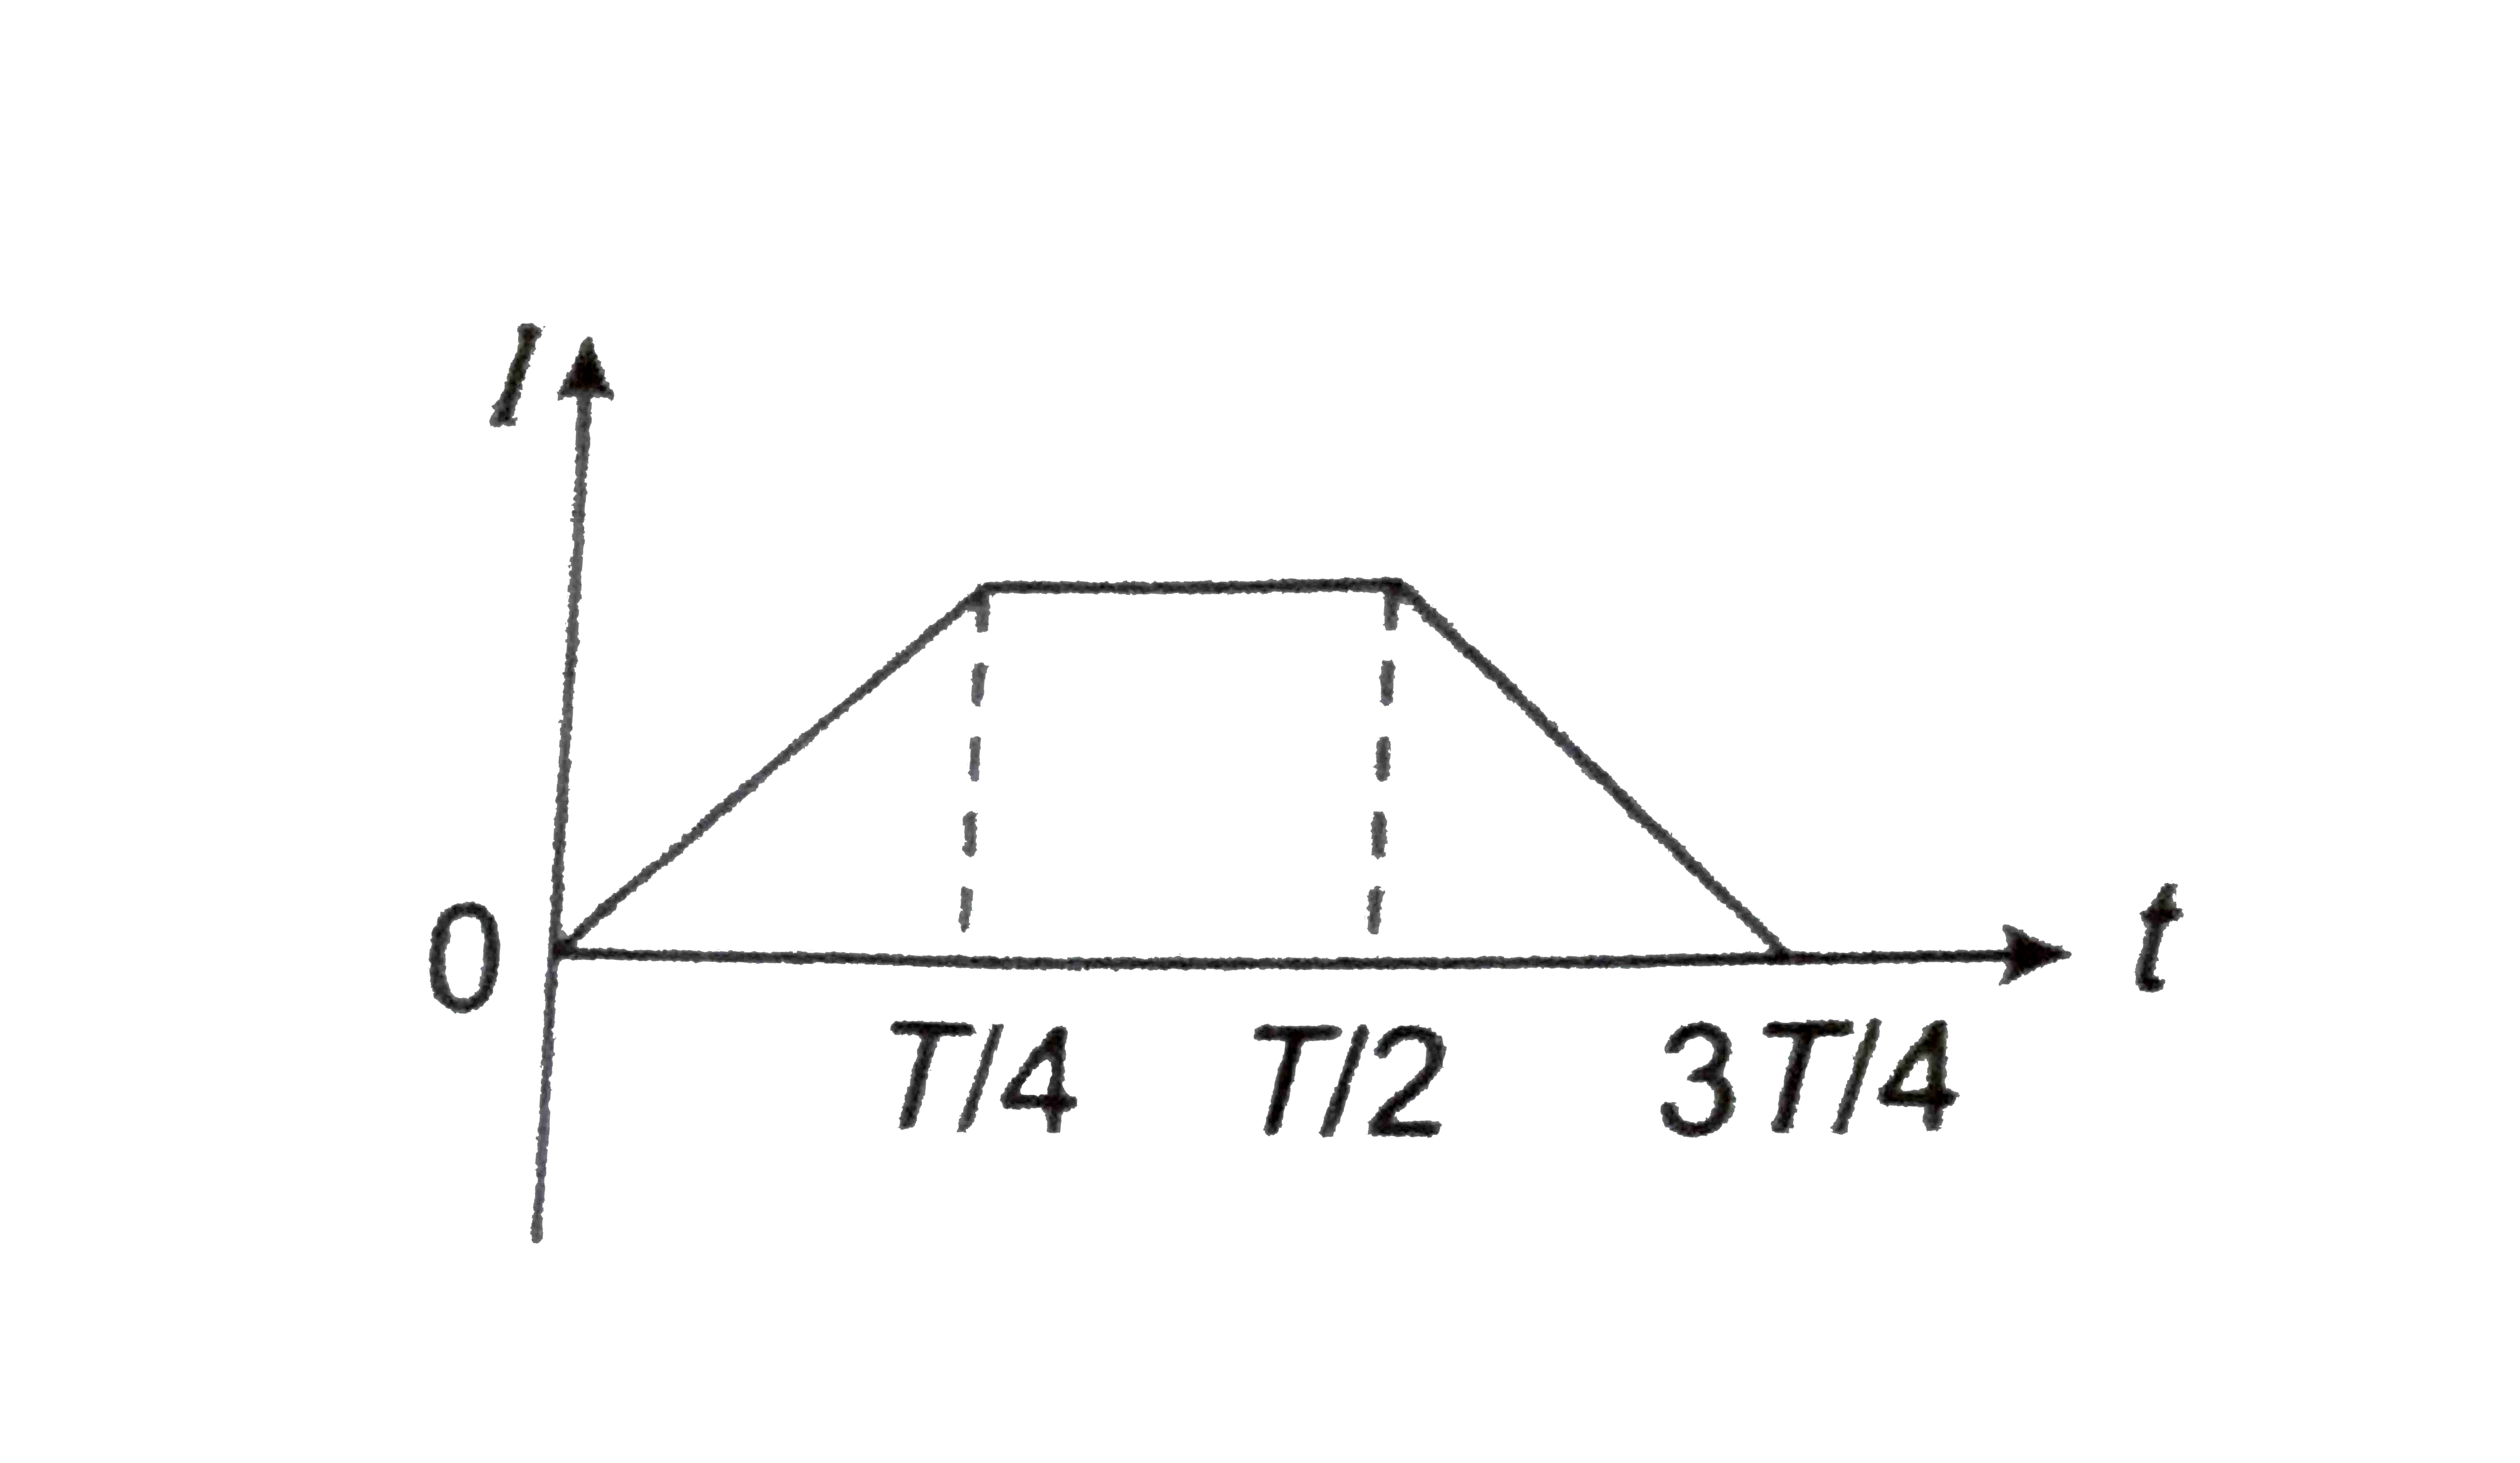
View SolutionThe current i in a coil varies with time as shown in the figure. The variation of induced emf with time would be
View SolutionThe flux linked with a coil is 0.8Wb when a 2 A current is flowing through it. If this current begins to increases at the rate of 400A/s, the induced emf in the coil will be
View Solution

