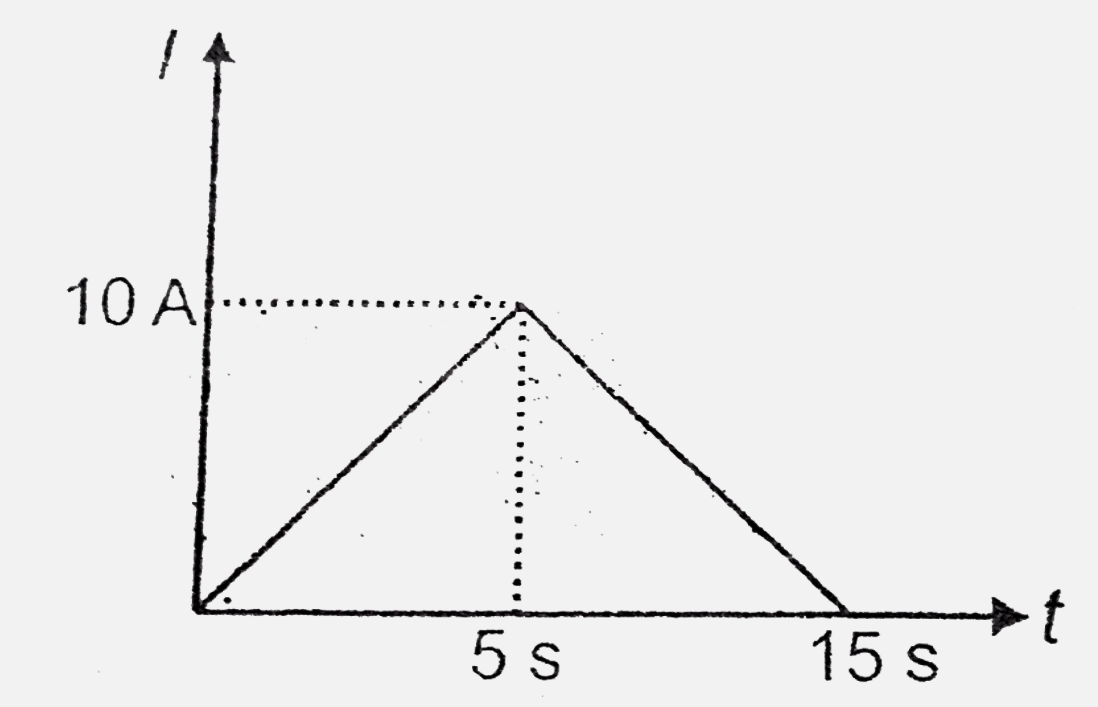
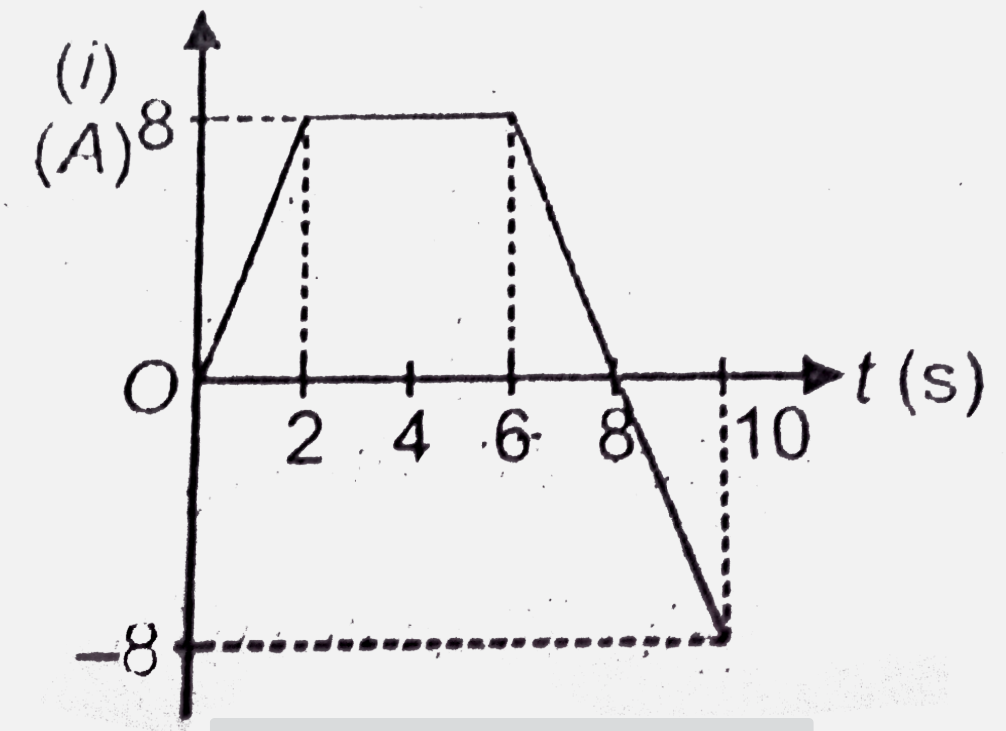
A (current vs time) graph of the current passing through a solenoid is shown in Fig. For which time is the back electromotive force (u) a maximum? If the back emf t = 3 s is e, find the back emf at t = 7 s, 15 s and 40 s OA, AB and BC are straight line segments. 
As back e.m.f. e=LdIdt, e will be maximum when dI/dt = max. The graph in Fig. shows that dI/dt is maximum for 5 x lt 6 lt 10 s.
For 0s<t<5s,dIdt=15 ∴ At t=3sec,e=LdIdt=L5
For 5s<t<10s,dIdt=−2−15=−35∴ At 7s,e=LdIdt=L(−35)=−3e
For 10s<t<30s,dIdt=220=110∴ At t=15s,e=LdIdt=L10=e2
For t>30s,dIdt=0∴ At t=40s,e=0
Topper's Solved these Questions
- ELECTROMAGNETIC INDUCTION & ALTERNATING CURRENTBook:PRADEEPChapter:ELECTROMAGNETIC INDUCTION & ALTERNATING CURRENTExercise:Solved Examples (b)
Explore 1 Video
- ELECTROMAGNETIC INDUCTION & ALTERNATING CURRENTBook:PRADEEPChapter:ELECTROMAGNETIC INDUCTION & ALTERNATING CURRENTExercise:Short Answer Qusetions
Explore 2 Videos
- DUAL NATURE OF RADIATION AND MATTERBook:PRADEEPChapter:DUAL NATURE OF RADIATION AND MATTERExercise:Exercise
Explore 191 Videos
- ELECTROMAGNETIC WAVESBook:PRADEEPChapter:ELECTROMAGNETIC WAVESExercise:II Focus multiple choice question
Explore 5 Videos
Similar Questions
Knowledge Check
The velocity-time graph of a particle moving in a straight line is shown in figure. The mass of the particle is 2kg. Work done by all the forces acting on the particle in time interval between t=0 to t=10s is
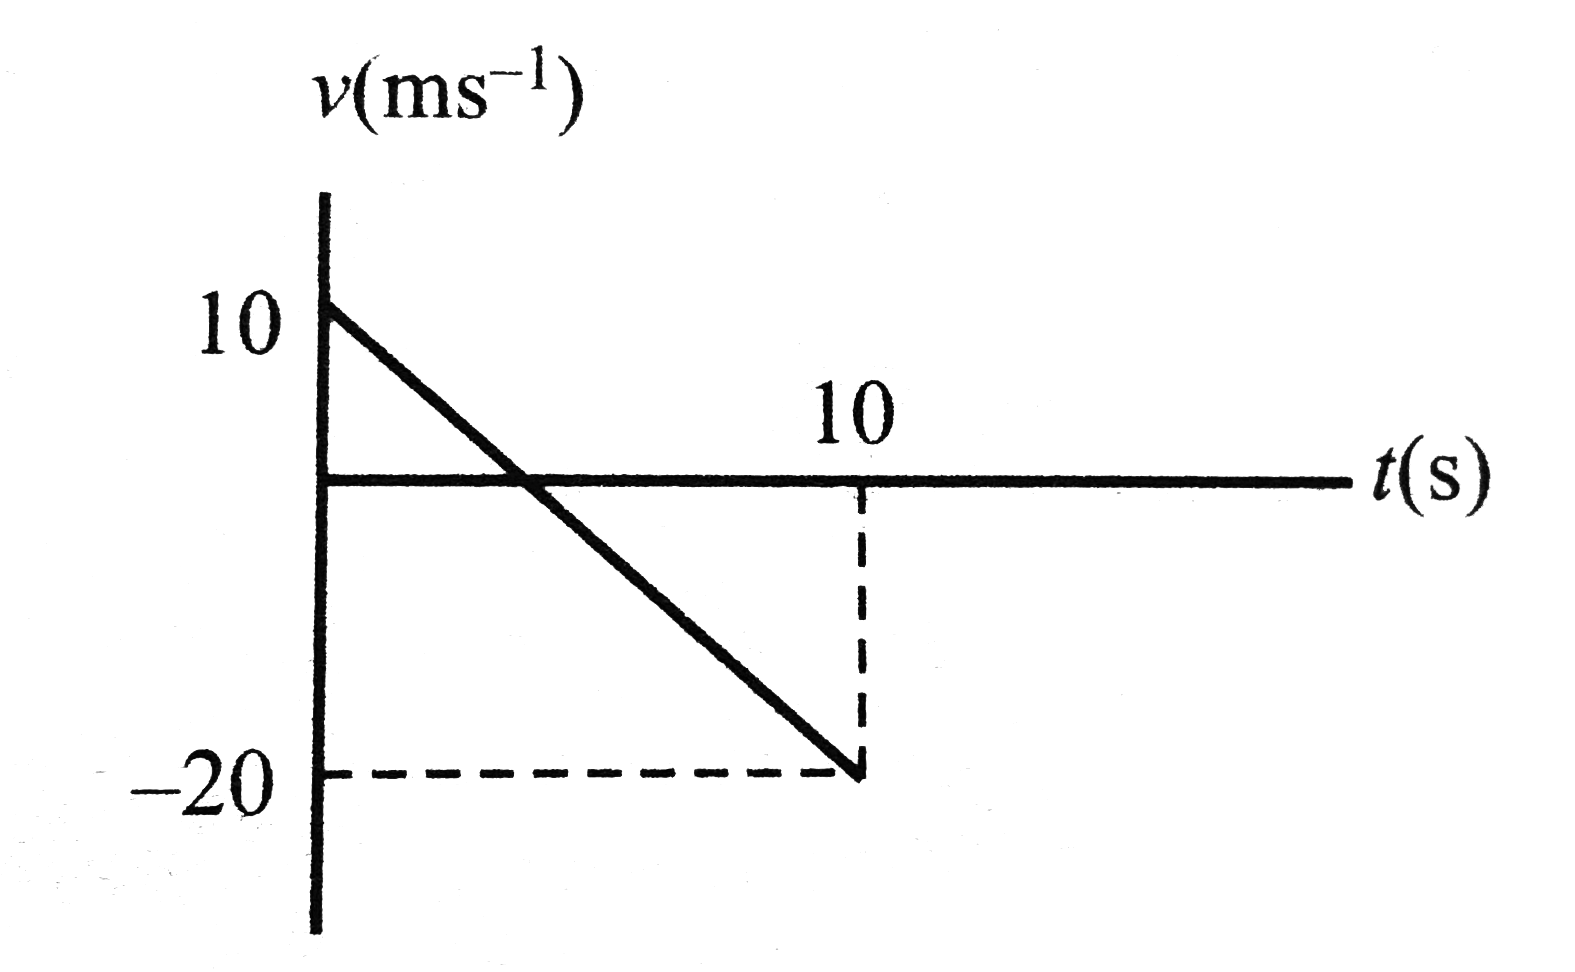 A(a) 300JB(b) −300JC(c) 400JD(d) −400J
Displacement-time graph of a particle moving in a straight line is as shown in figure. s t a o b c
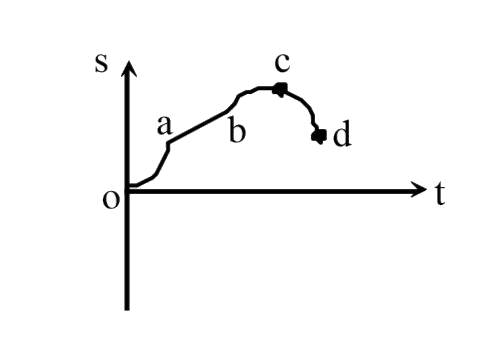
Q. Find the sign of velocity in regions oa, ab, bc and cdAnegative , positive, positive, negativeBpositive , positive, positive, negativeCpositive , negative, positive, positiveDpositive , positive, negative, negativeIn the circuit shown in figure switch S is closed at time t=0
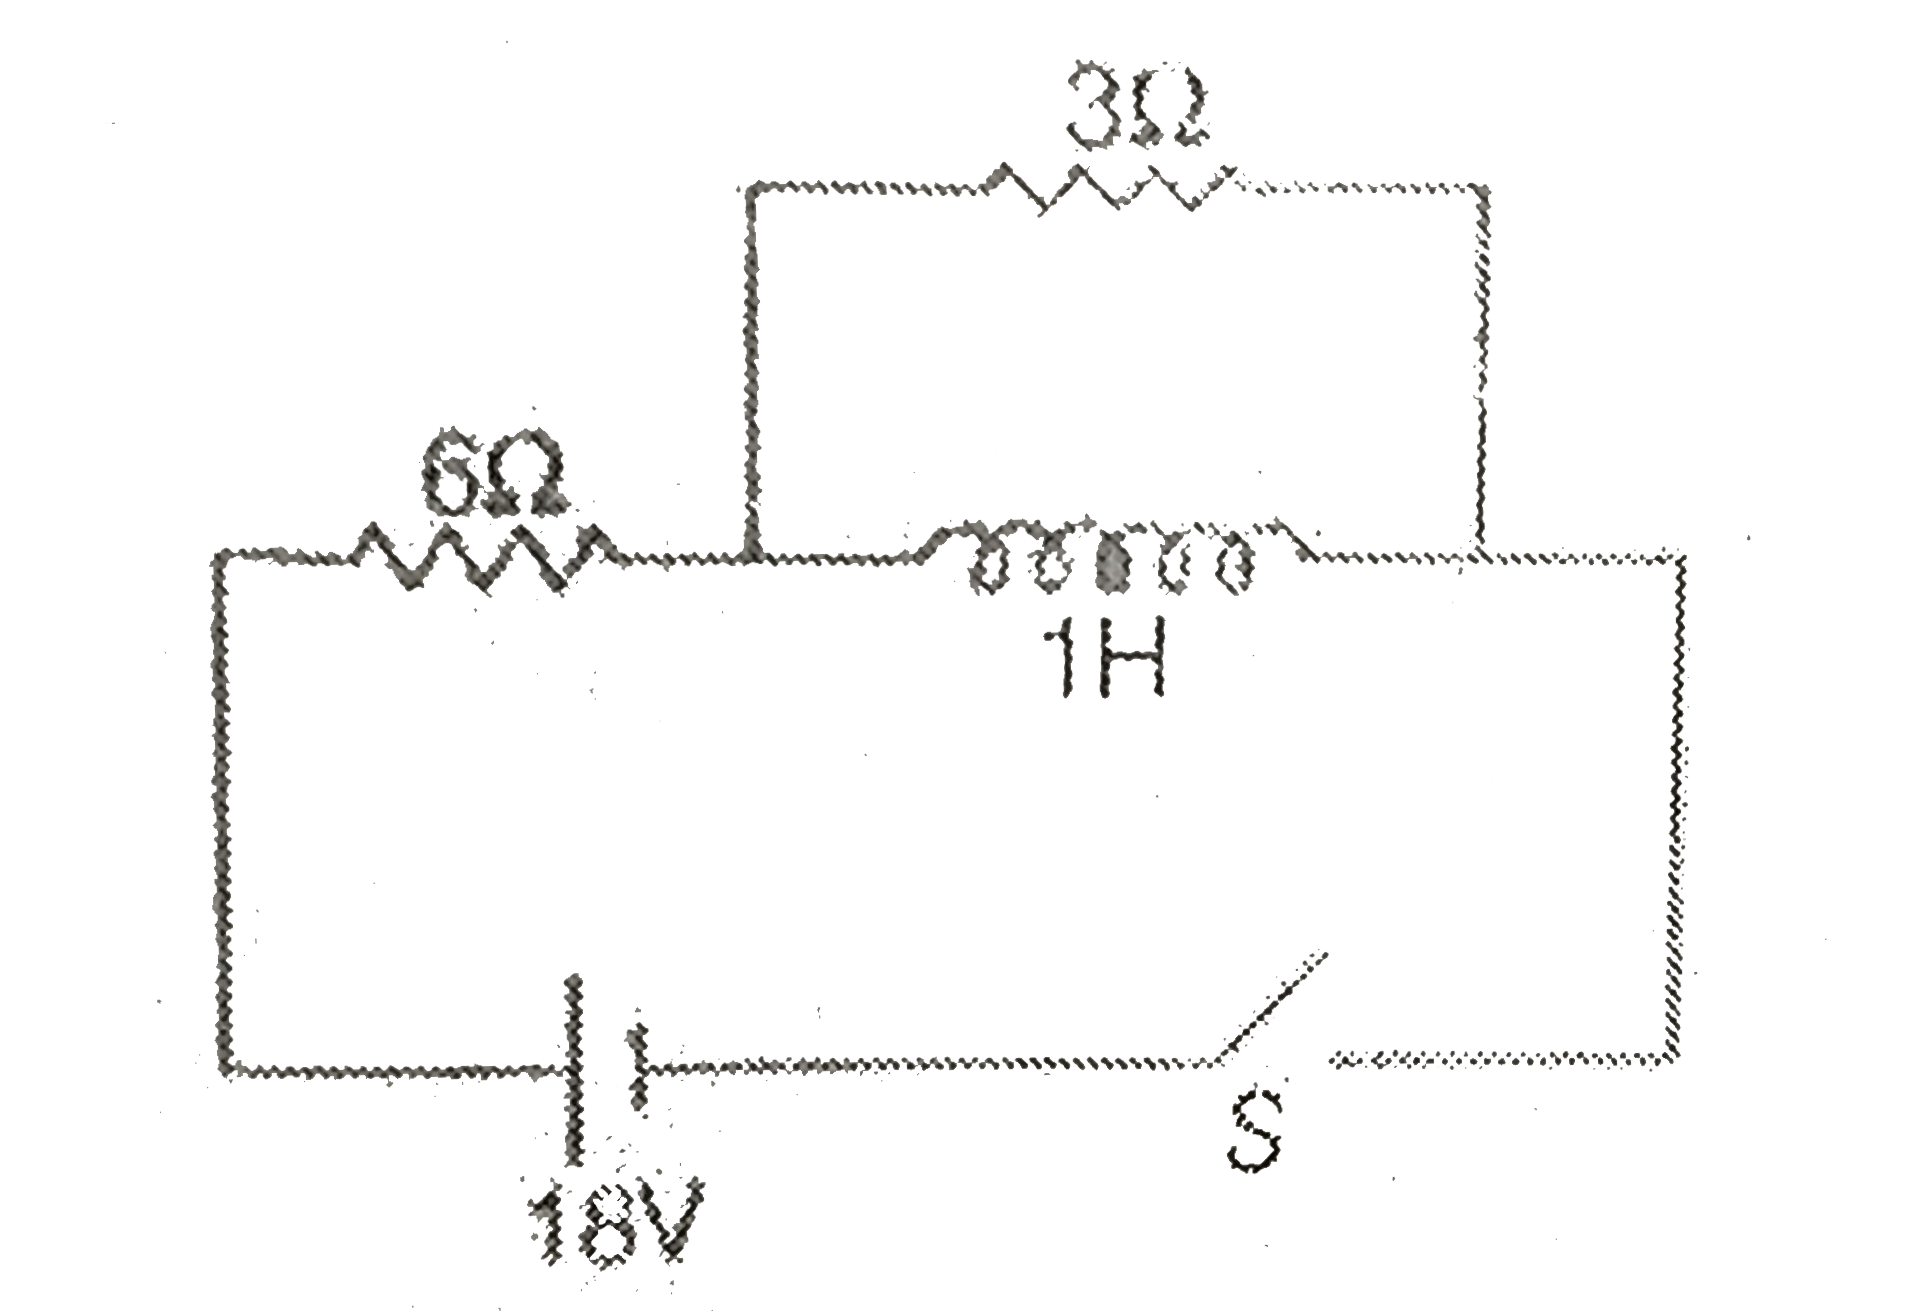
Current I from the battery at time t is given byA3(1−e−2t)B3+e−2t)C3(1-e^(-t/9))D3−e−2t
The velocity (u)-time (t) graph of an object moving along a straight line is as shown is Fig. 2 (b) . 30. Calculate the distance covered by object between (i)t=0→t=5s (ii) t=0→t=10s.
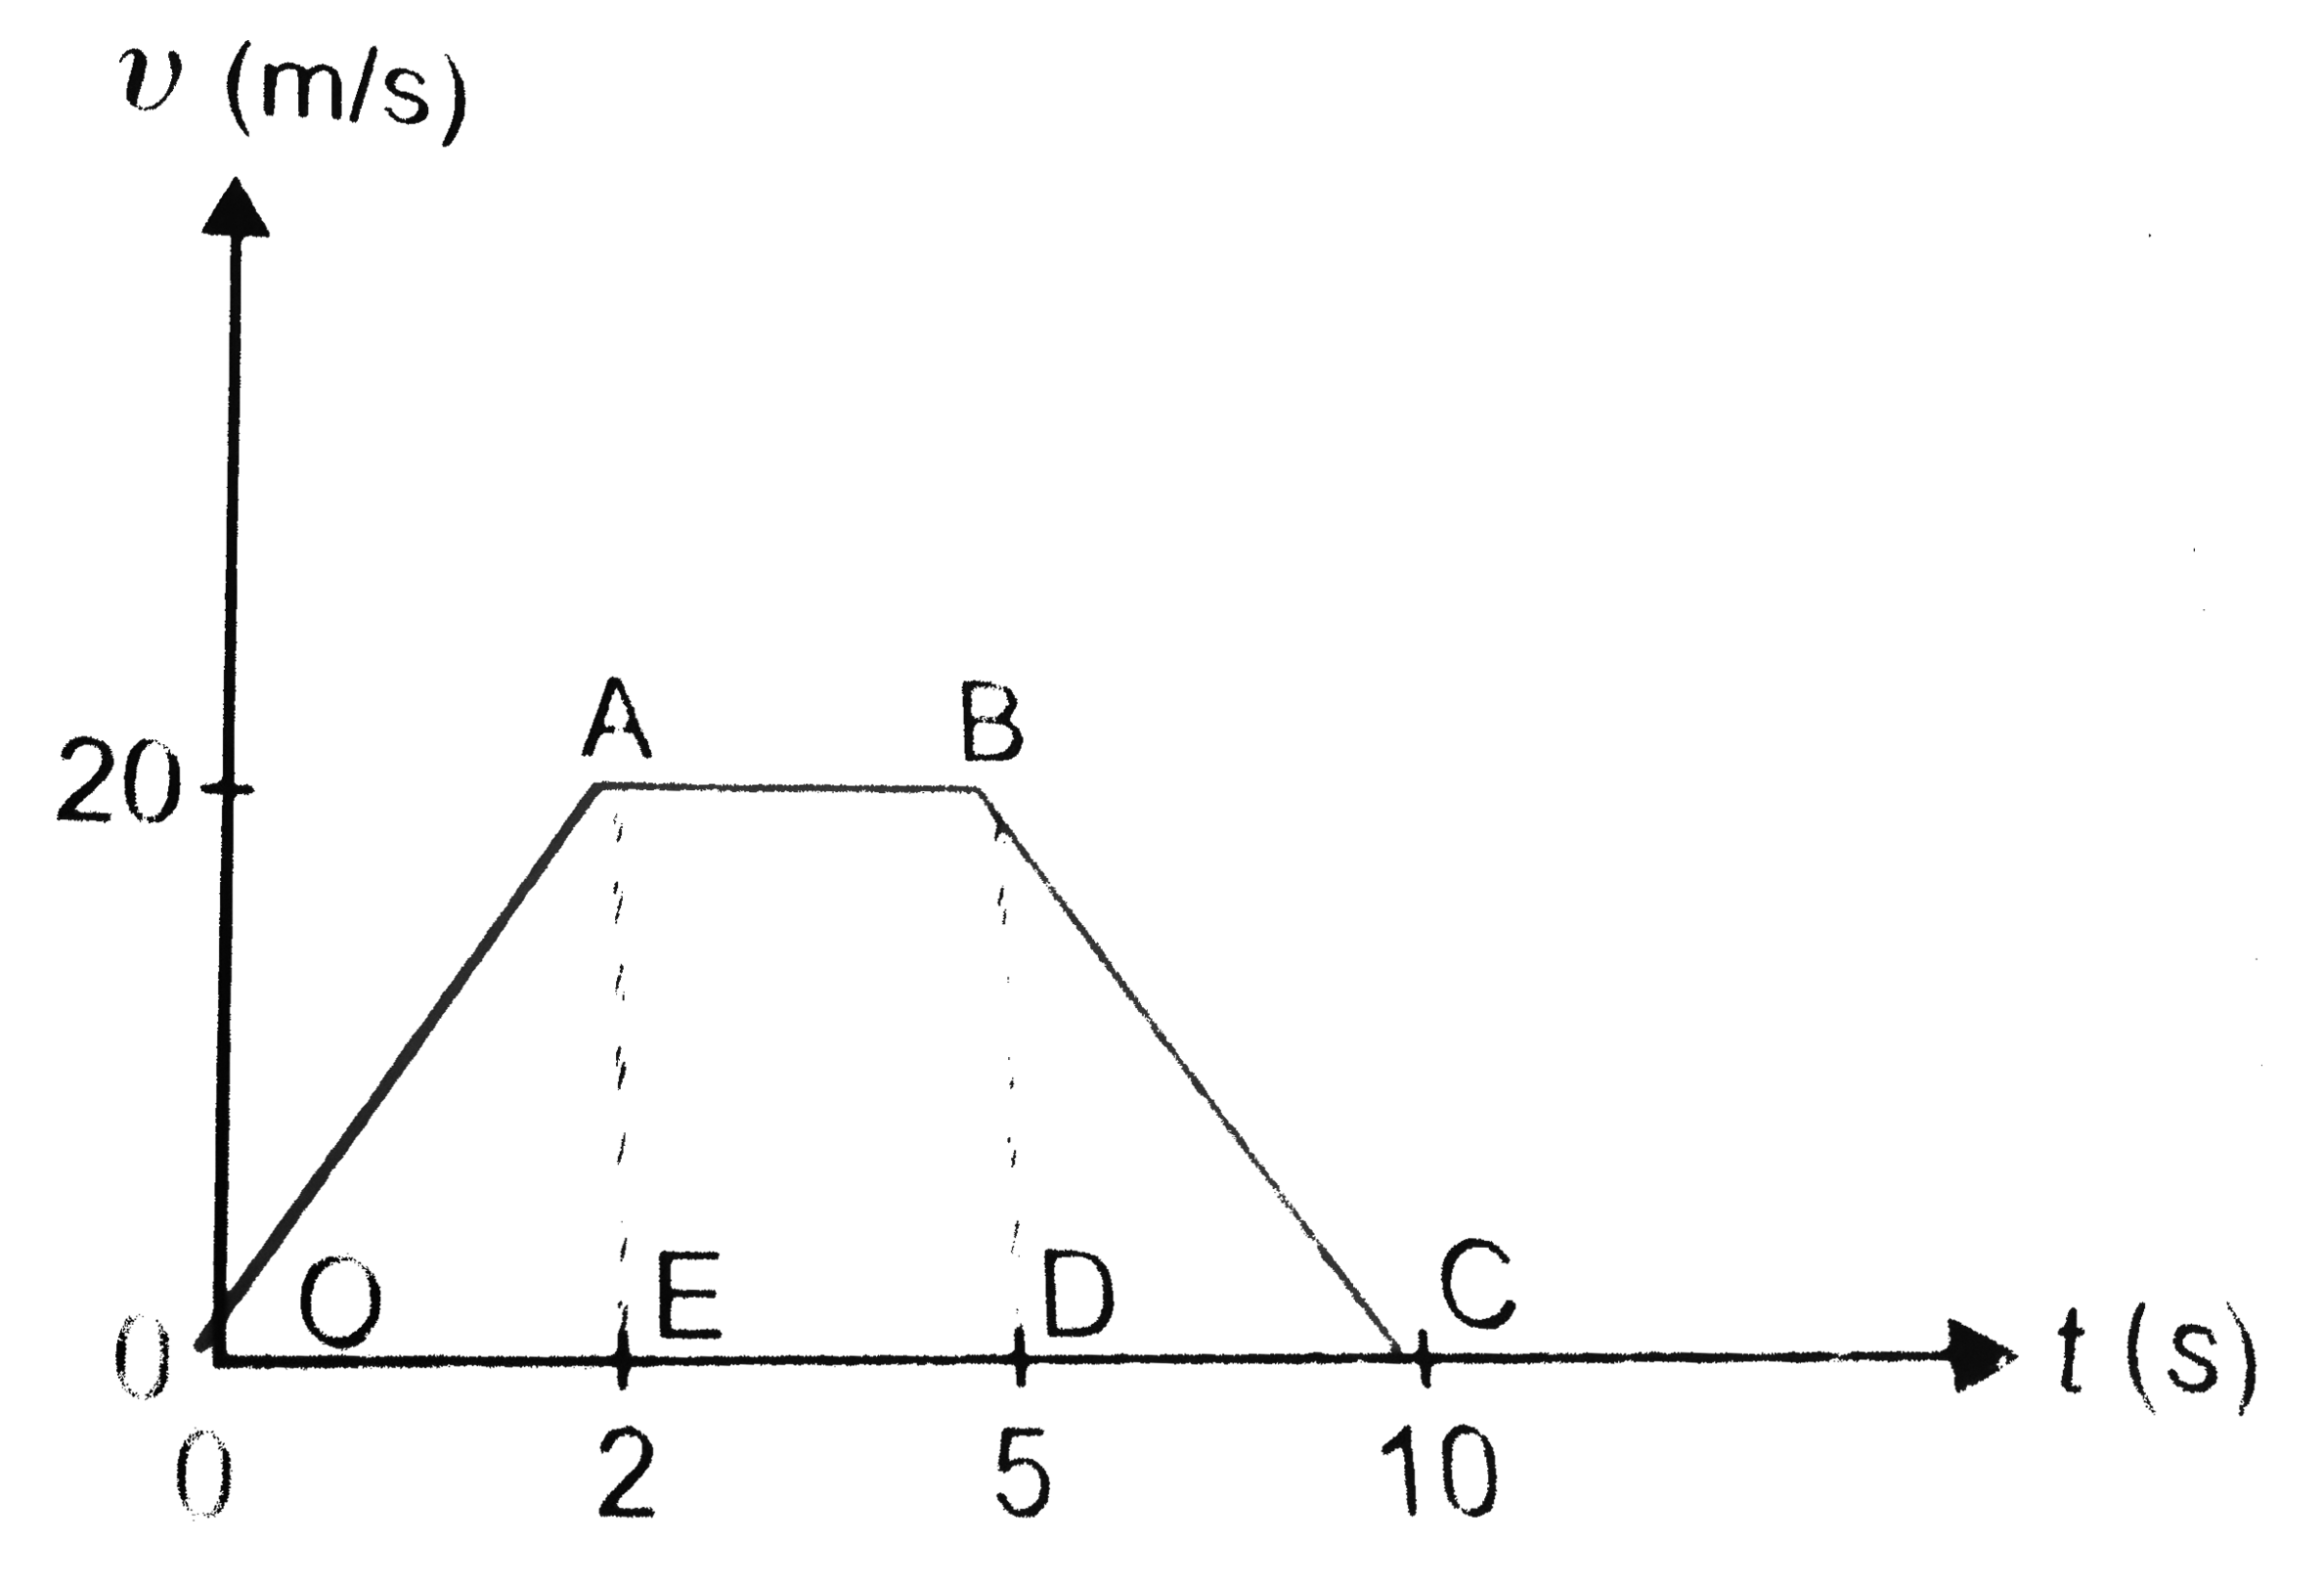 .
.
View SolutionThe velocity-time graph of an object moving along a straight line is as shown in Fig. 3.37. Find the net distance covered by the object in time interval between t=0 to t=10s. Also find the displacement in time 0 to 10 s.
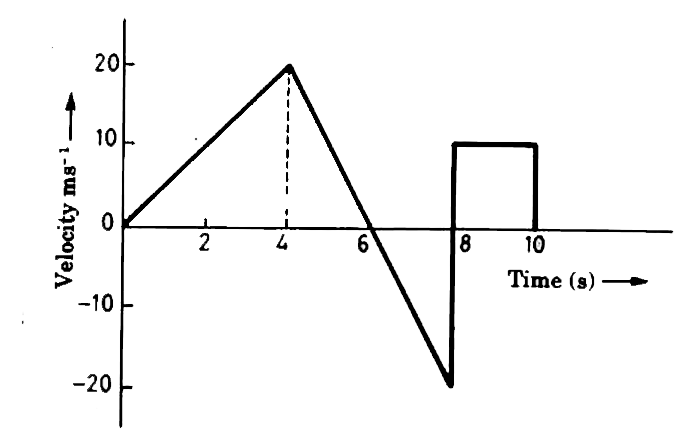
View SolutionThe velocity (u)-time (t) graph of an object moving along a straight line is as shown is Fig. 2 (b) . 30. Calculate the distance covered by object between (i)t=0→t=5s (ii) t=0→t=10s.
 .
.
View SolutionVelocity-time graph of a particle moving in a straight line is shown in figure. At time t=0.s=20m. Plot a-t and s-t graphs of the particle.
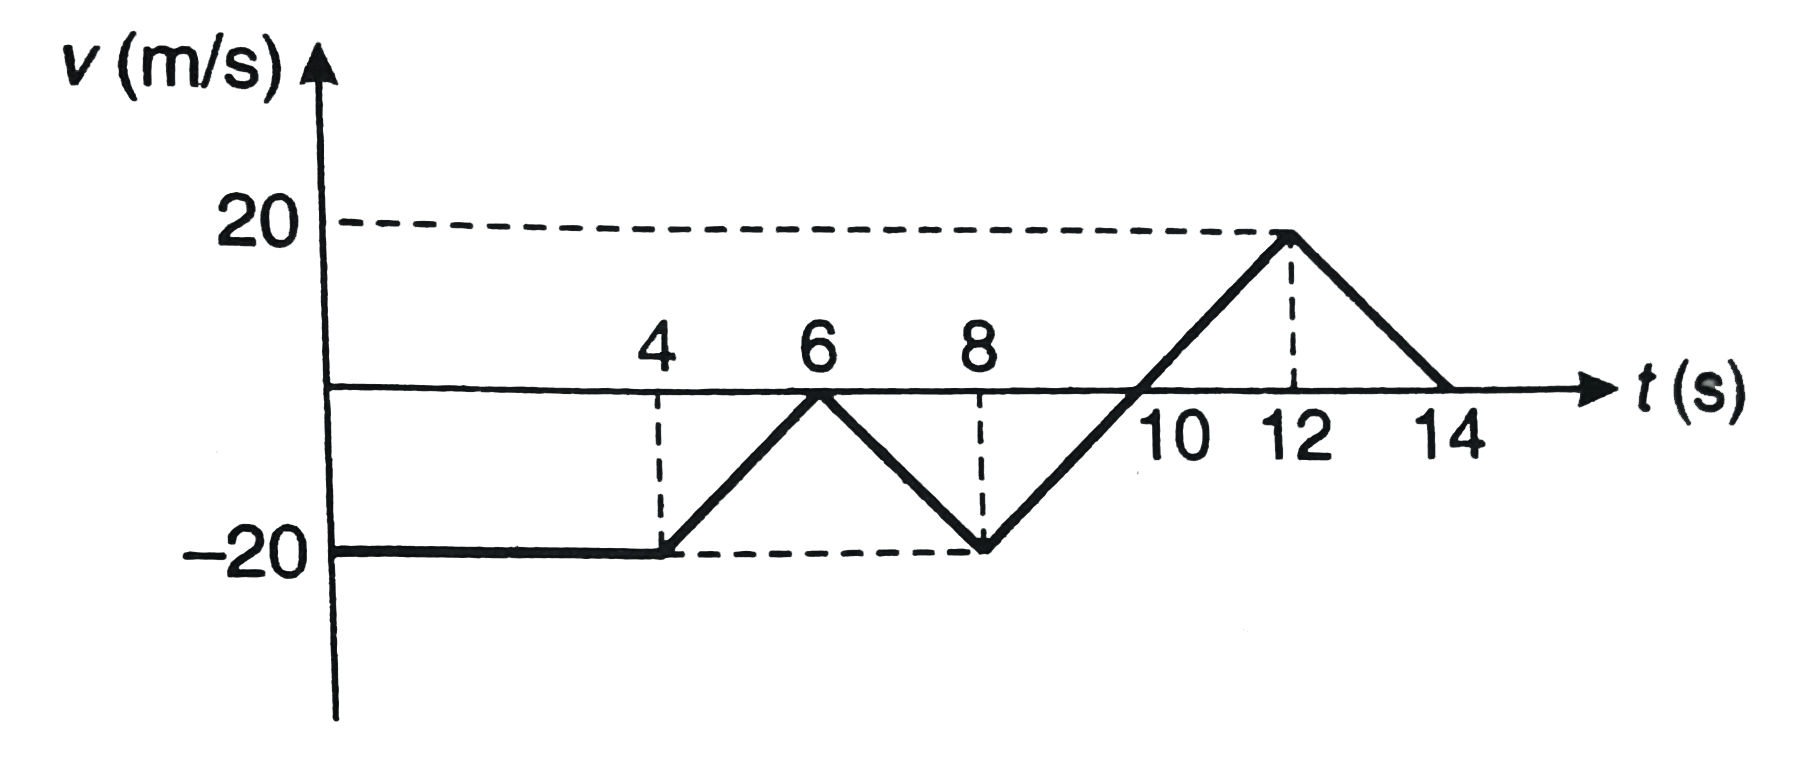
View SolutionVelocity-time graph of a particle moving in a straight line is shown in figure. In the time interval from t = 0 to t = 14 s, find:
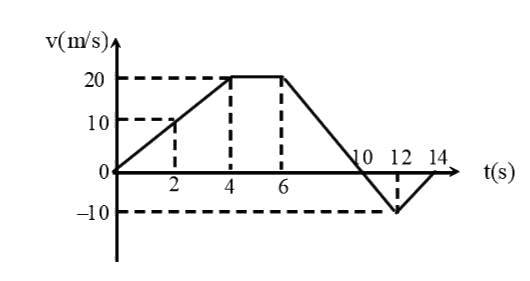
Q. average speed of the particle
View Solution


