The graphs shown in Fig. represent the variation of opposition offered by the circuit element of the flow of a.c. with frequency of applied e.m.f. Iddntify the circuit element .
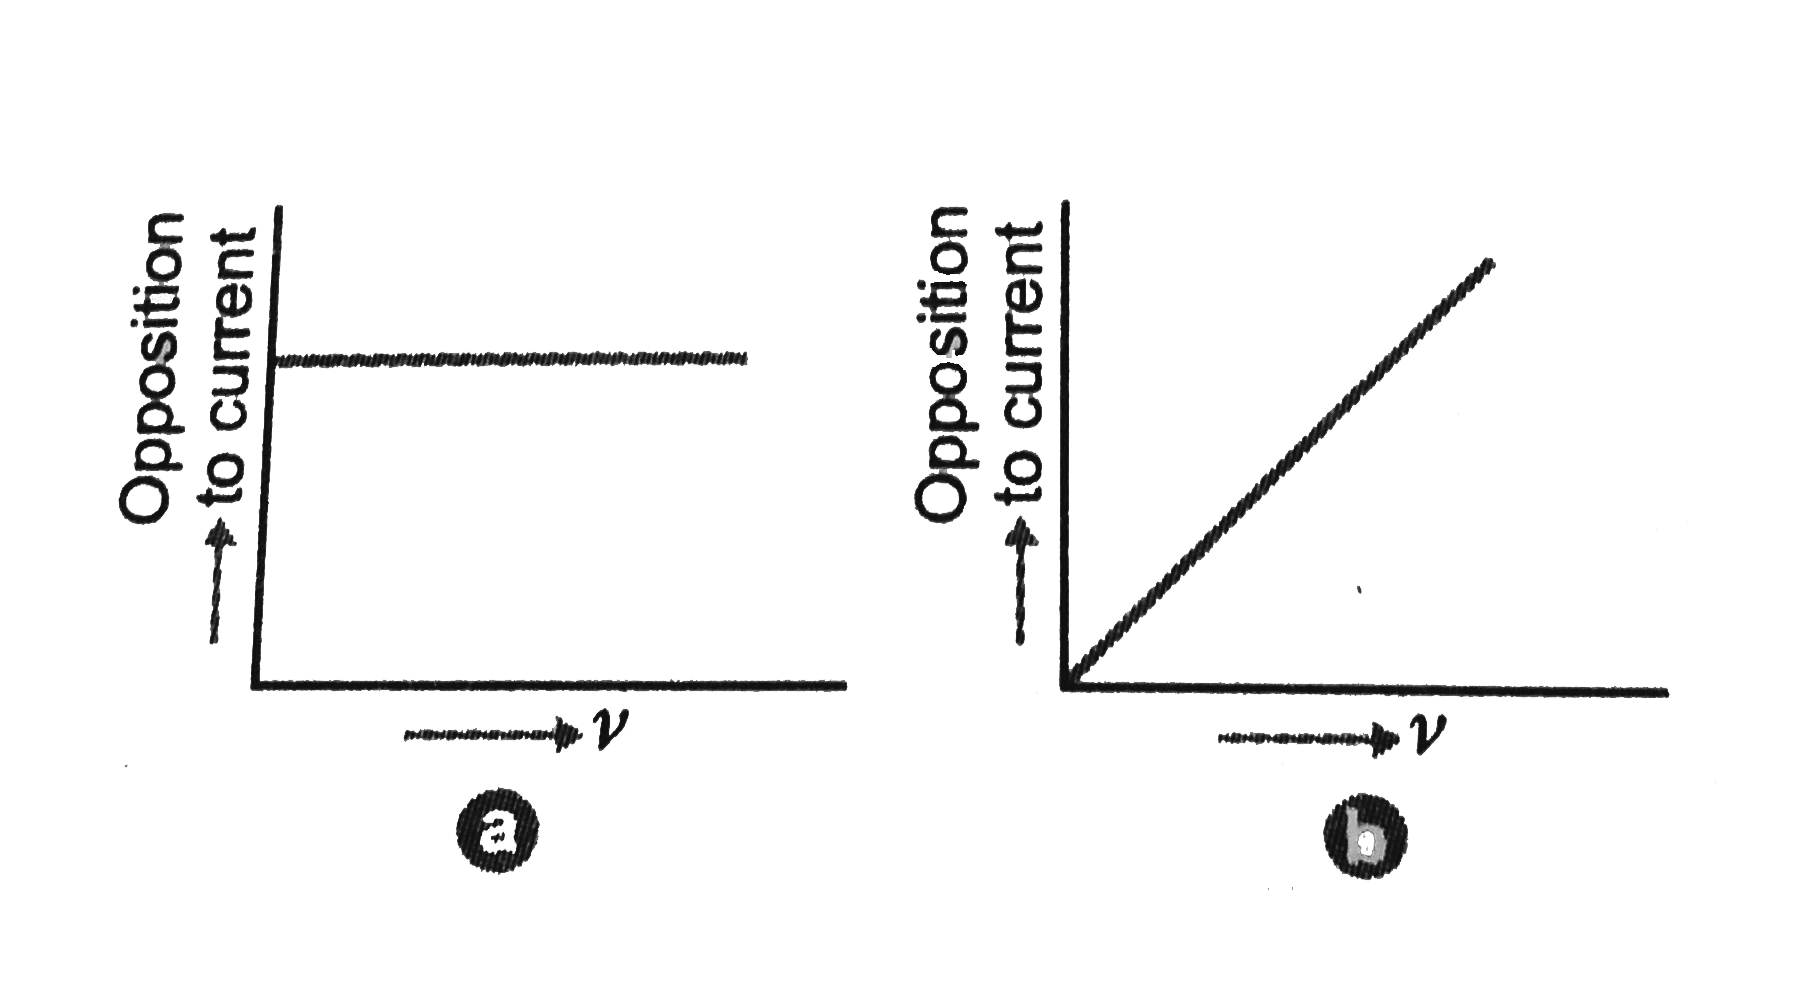
In Fig, opposition to current does not vary with frequency. The circuit element must be a pure resistor. In Fig, opposition to current increses directly with applied frequency. The circuit element must be a pure inductor (XL=ωL=2πvL,XL∝v).
Topper's Solved these Questions
- ELECTROMAGNETIC INDUCTION & ALTERNATING CURRENTBook:PRADEEPChapter:ELECTROMAGNETIC INDUCTION & ALTERNATING CURRENTExercise:Solved Examples (b)
Explore 1 Video
- ELECTROMAGNETIC INDUCTION & ALTERNATING CURRENTBook:PRADEEPChapter:ELECTROMAGNETIC INDUCTION & ALTERNATING CURRENTExercise:Short Answer Qusetions
Explore 2 Videos
- DUAL NATURE OF RADIATION AND MATTERBook:PRADEEPChapter:DUAL NATURE OF RADIATION AND MATTERExercise:Exercise
Explore 191 Videos
- ELECTROMAGNETIC WAVESBook:PRADEEPChapter:ELECTROMAGNETIC WAVESExercise:II Focus multiple choice question
Explore 5 Videos
Similar Questions
(a) The graphs (i) and (ii) represent the variation of the opposition offered by the circuit elements to the flow of alternating current with frequency of the applied emf. Identify the circuit element corresponding to each graph.
(b) Write the expression for the impedance offered by the series combination of above two elements connected across the a.c. source. Which will be ahead in phase in this circuit, voltage or current ?
View SolutionSketch a graph showing the variation of impedance of LCR circuit the frequency of applied voltage.
View Solution
Knowledge Check
If the frequency of the source e.m.f. in an AC circuit is n, the power varies with a frequency:
AnB2nCn/2DzeroWhich of the following curves represents the variation of impedance (Z) with frequency f in series LCR circuit?
A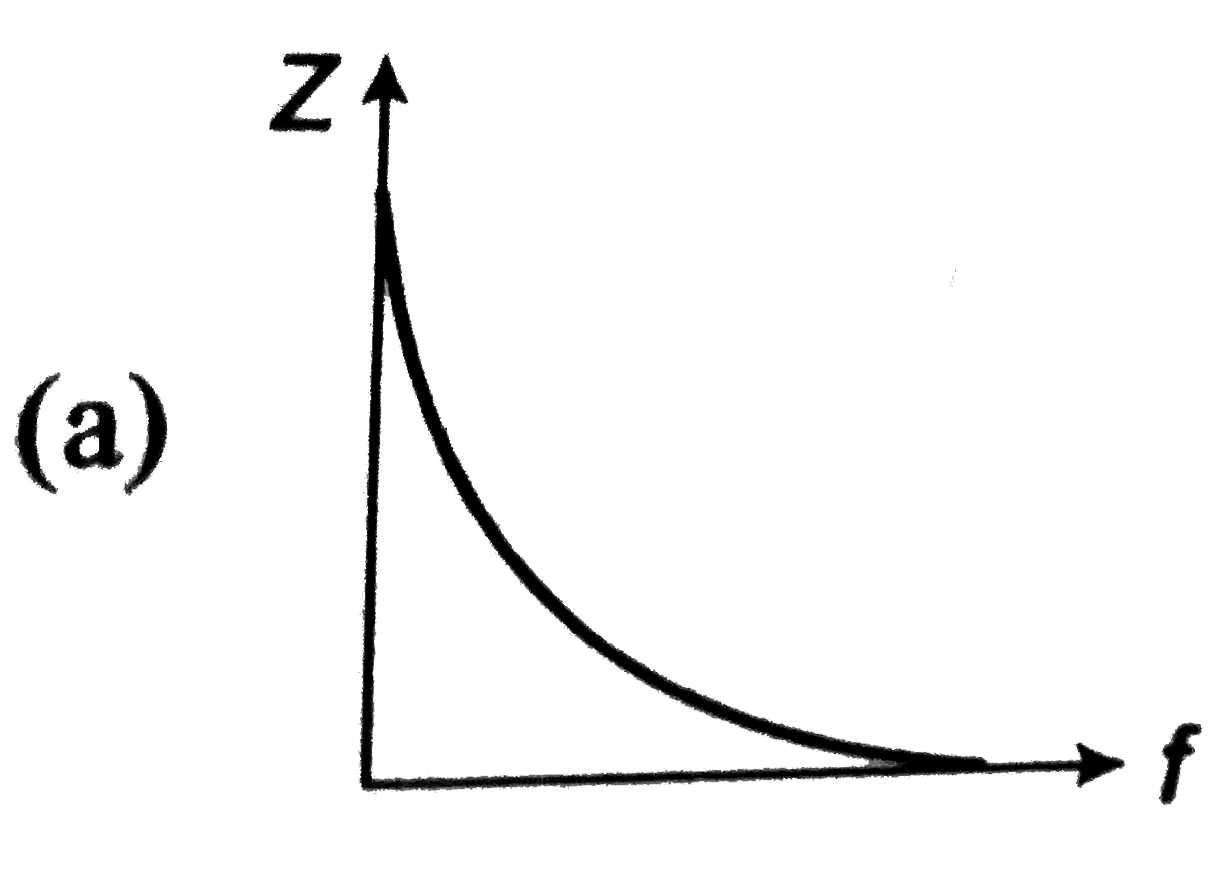 B
B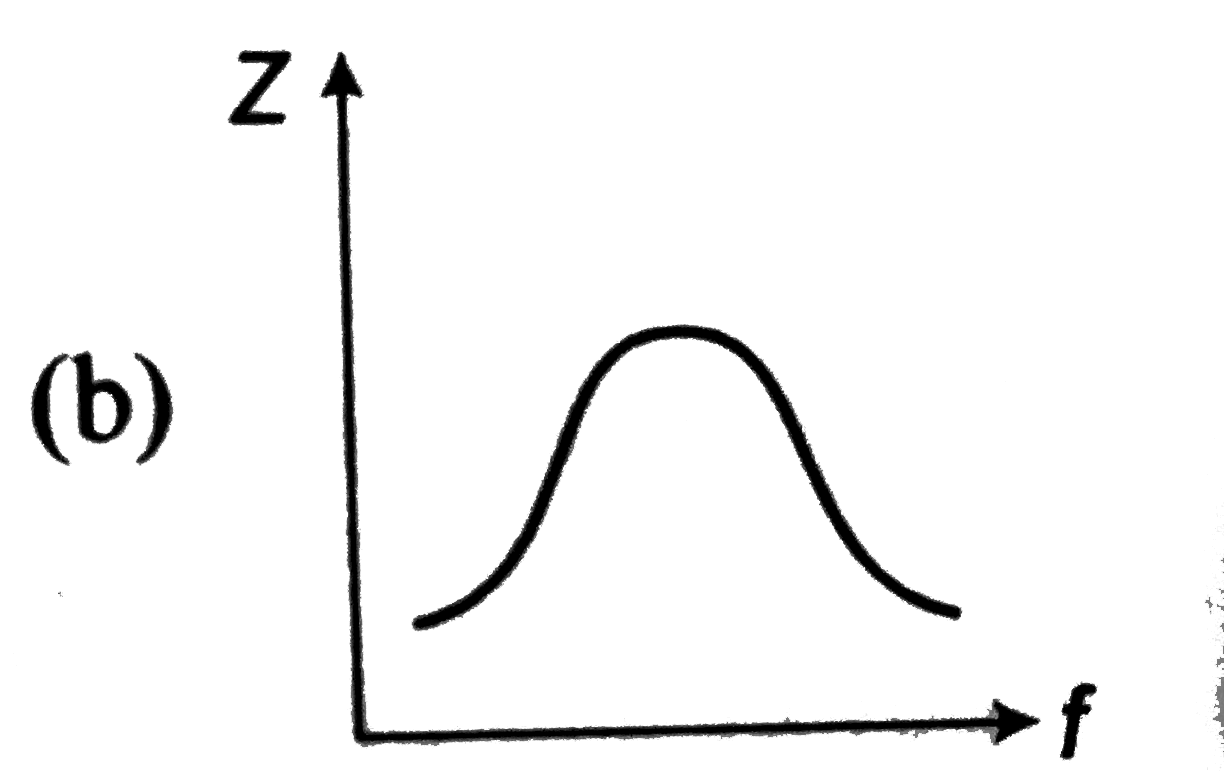 C
C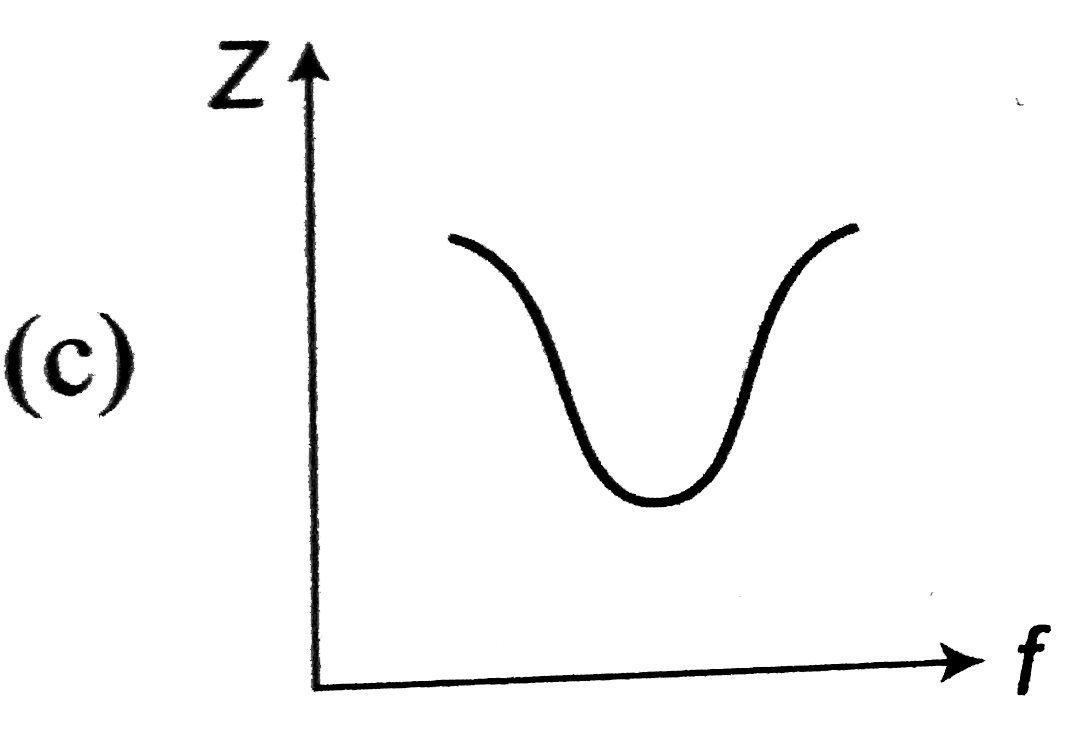 D
D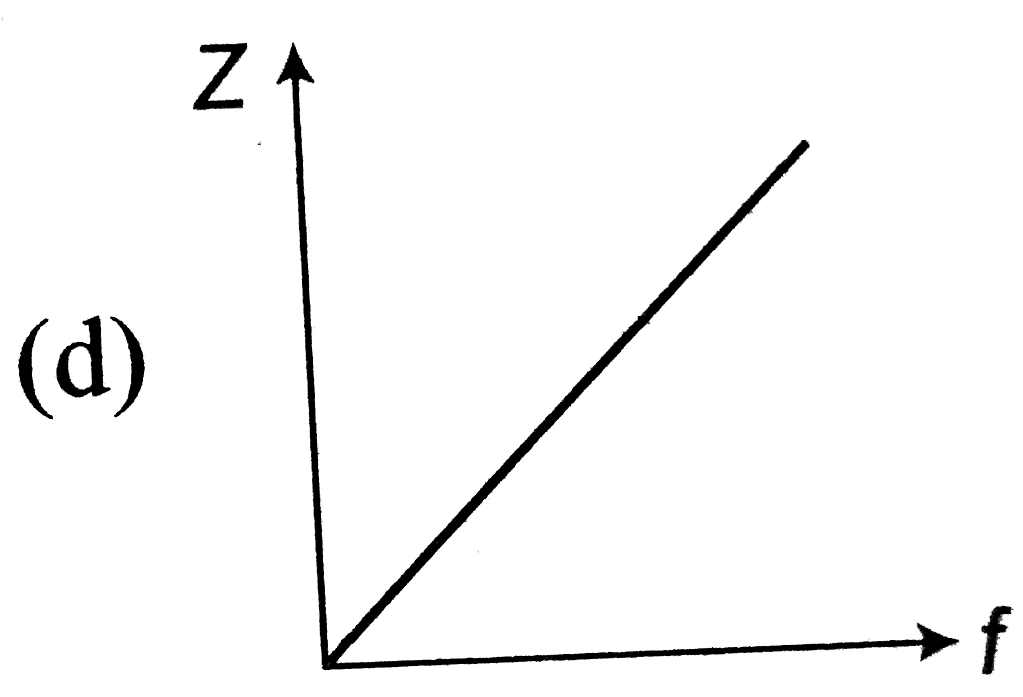
If the frequency of the source e.m.f. in an AC circuit is n, the power varies with a frequency:
AnB2nCn/2Dzero
(i) Draw the graphs showing variation of inductive reactance and capacitive reactance with frequency of applied a.c. source.
(ii) Can the voltage drop across the inductor or the capacitor in a series LCR circuit be greater than the applied voltage of the a.c. source ? Justify your answer.
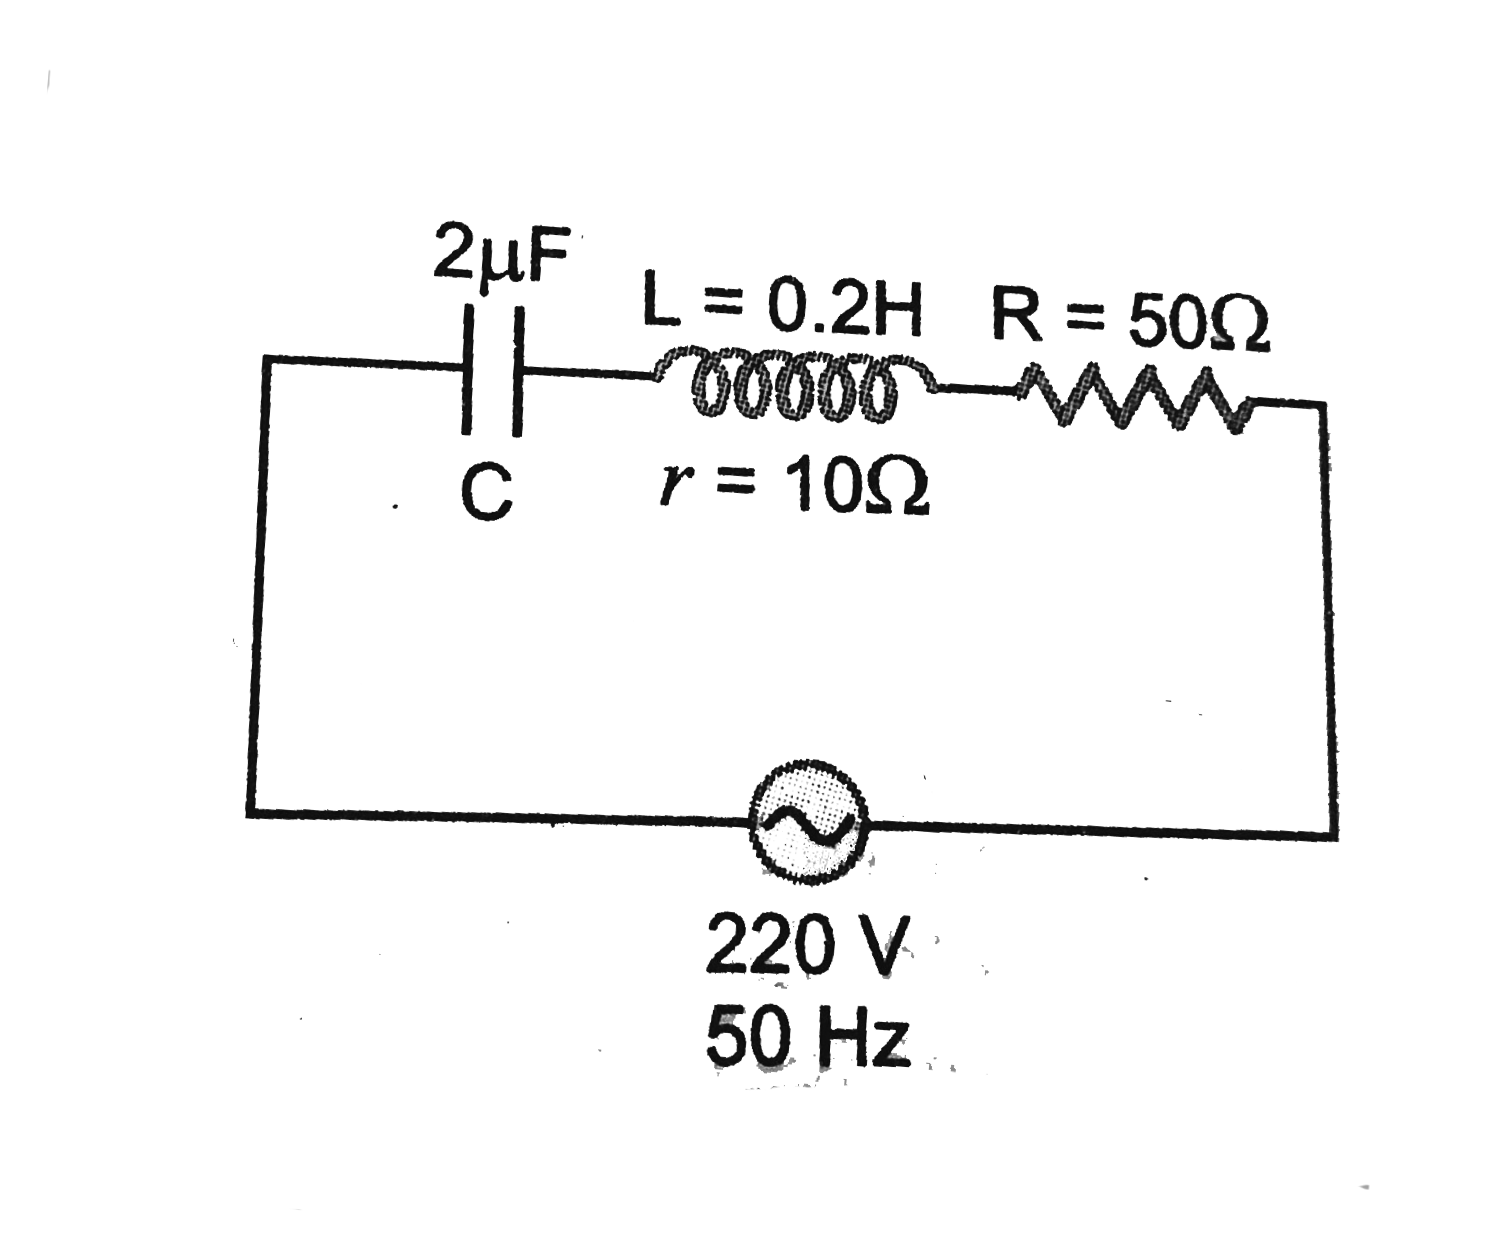
View SolutionIn the circuit shown in Fig. calculate
(i) current in the circuit
(ii) Potential difference across each element.
View SolutionAlternating current lead the applied e.m.f. by π/2 when the circuit consists of –
View SolutionAlternating current lead the applied e.m.f. by π2 when the circuit consists of –
View SolutionAn alternating e.m.f. is applied to a series L-C-R circuit. If the frequency of the applied e.m.f. is more than the resonant frequency of the circuit then the circuit will act as
View Solution

