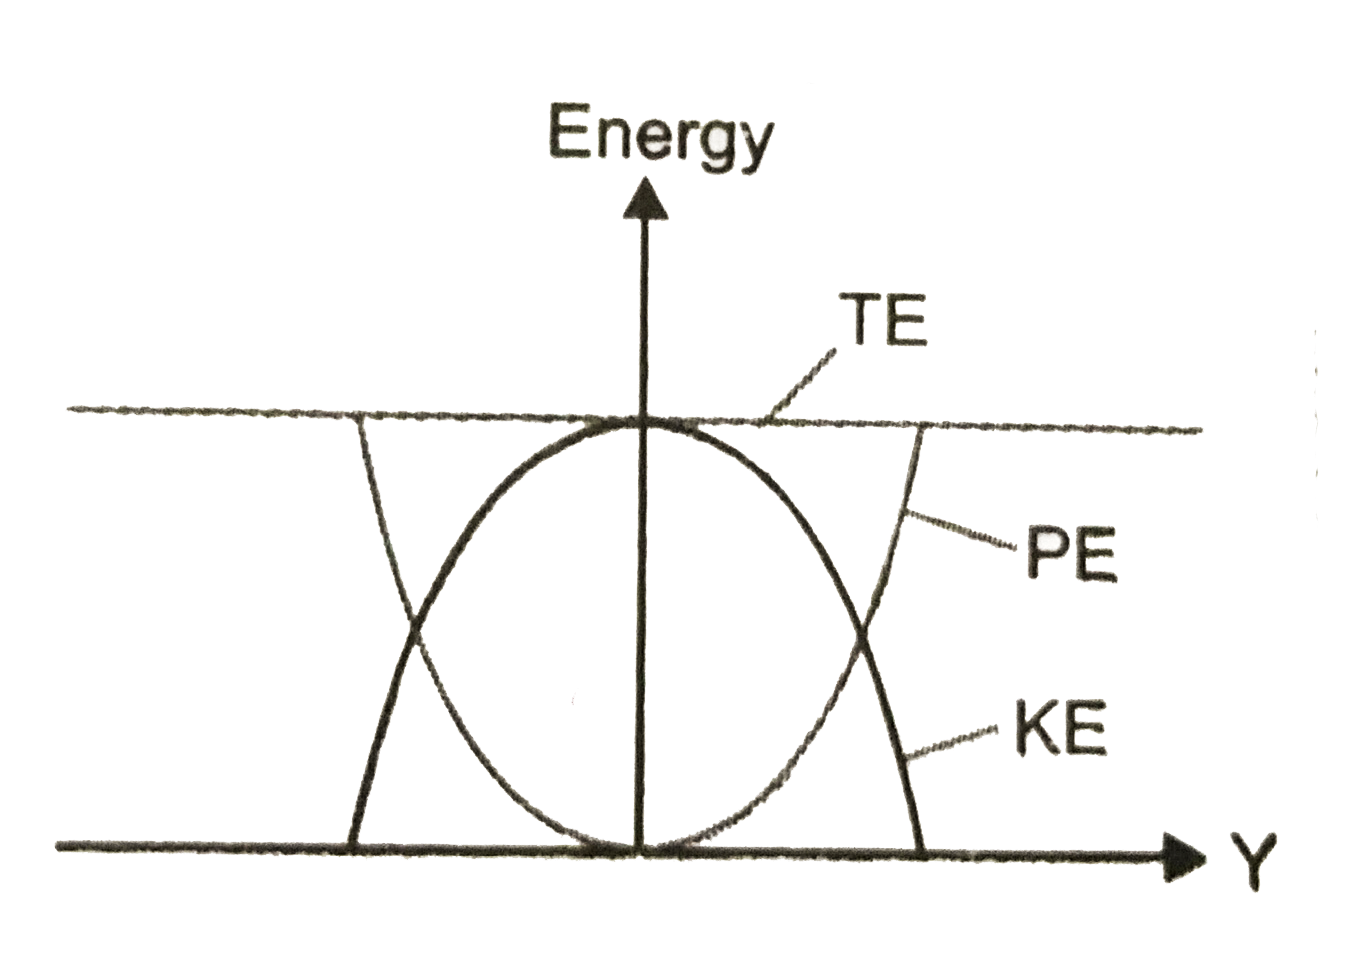
Draw a graph to show the the variation of P.E., K.E. and total eneryg of a simple harmonic oscillator with displacement .
Let y be the displacement of a particle in SHM at an instant t, starting from the mean position when . If r is the amplitude of oscillation and is the angular frequency of the oscillating particle in SHM, then
The variation of PE, KE and TE with displacement y is shown in figure .

Topper's Solved these Questions
- OSCILLATIONS AND WAVESBook:PRADEEPChapter:OSCILLATIONS AND WAVESExercise:Short Answer Questions
Explore 104 Videos
- OSCILLATIONS AND WAVESBook:PRADEEPChapter:OSCILLATIONS AND WAVESExercise:Long Answer Questions
Explore 33 Videos
- OSCILLATIONS AND WAVESBook:PRADEEPChapter:OSCILLATIONS AND WAVESExercise:conceptual problems
Explore 84 Videos
- MATHEMATICAL TOOLSBook:PRADEEPChapter:MATHEMATICAL TOOLSExercise:Fill in the blanks
Explore 5 Videos
- PHYSICAL WORLD AND MEASUREMENTBook:PRADEEPChapter:PHYSICAL WORLD AND MEASUREMENTExercise:Competiton Focus Jee Medical Entrance
Explore 18 Videos
Similar Questions
Draw a graph to show the variation of PE, KE and total energy of a simple harmonic oscillator with displacement.
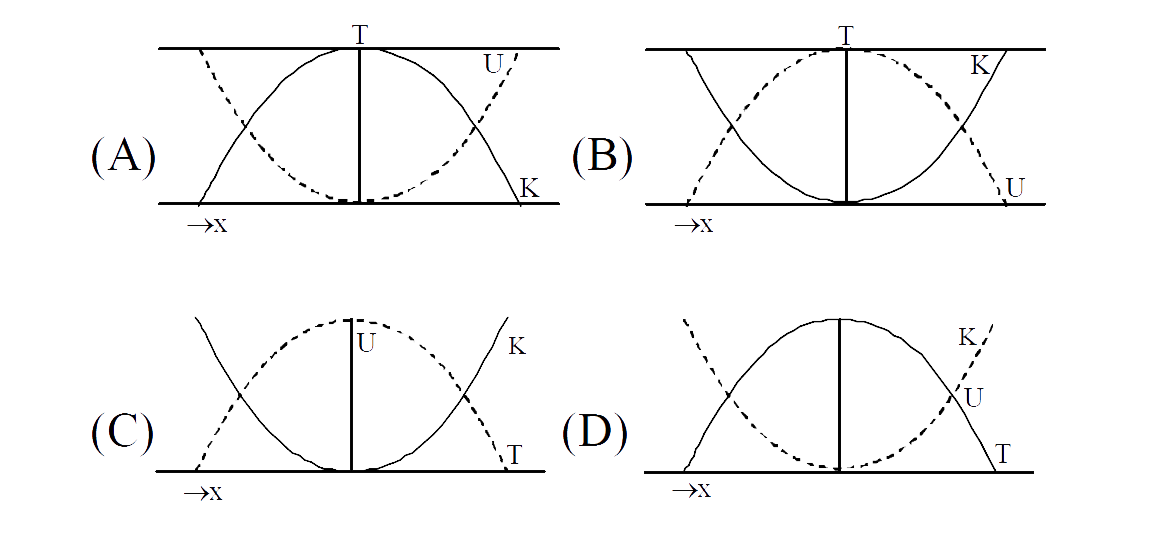
View SolutionA particle is executing S.H.M. along a straight line. The graph showing the variation of kinetic, potential and total energy K, U and T respectively with displacement is -

View Solution
Knowledge Check
A particle is executing S.H.M. along a straight line. The graph showing the variation of kinetic, potential and total energy K, U and T respectively with displacement is -
 A
A B
B C
C D
D
A particle executes a S.H.M. Its P.E., K.E. and total energy are measured as function of displacement of x. Then its
AK.E. is maximum, when x is maximumBTotal energy is maximum, when x=0CP.E. is maximum, when x=0DK.E. is maximum, when x =0For a simple harmonic oscillator moving along a straight line, the graphs which represent the variation of kinetic energy K, potential energy U and total energy T with displacement are
A B
B C
C D
D
Draw a graph to show the variation of E with perpendicular distance r from line of charge.
View SolutionDraw a graph showing the variation of decay rate with number of active nuclei.
View SolutionDraw a graph showing the variation of decay rate with number of active nuclei.
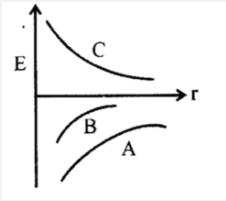
View SolutionAn artificial satellite is made to move in circular orbits of different radii around the earth. The variations of its K.E., P.E. and total energy (E) in different orbits is shown in the figure by different curves. Then for the satellites

View SolutionDraw the graphical representation of simple harmonic motion, showing the displacement-time curve.
View Solution