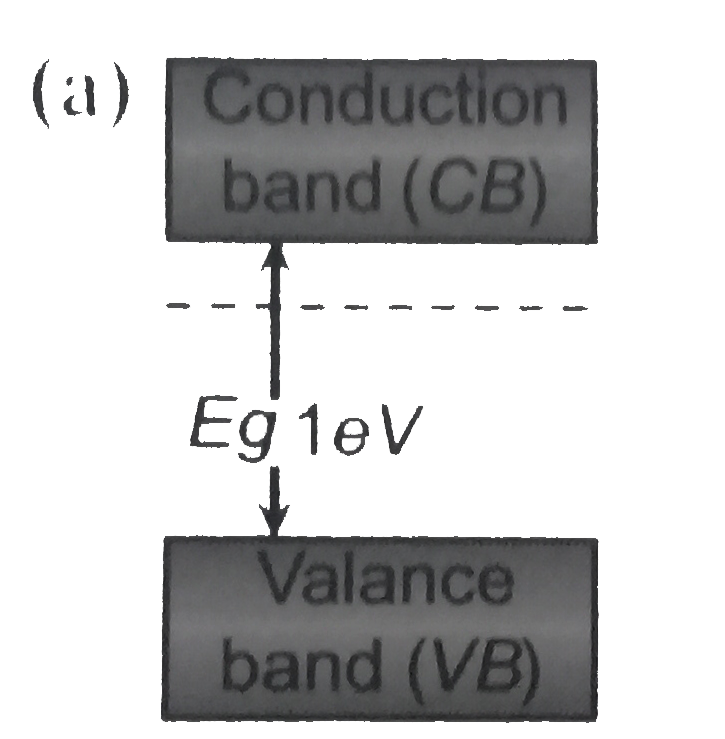
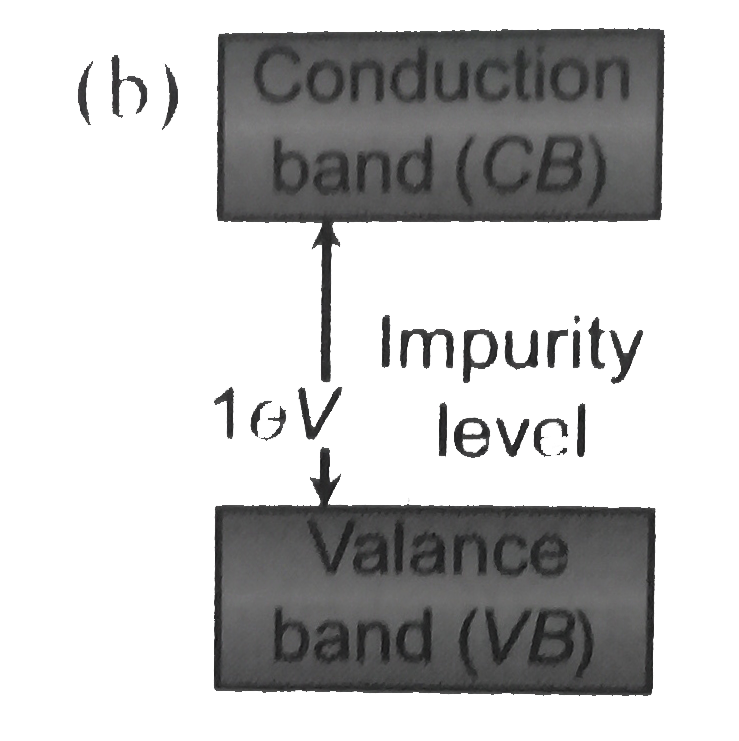
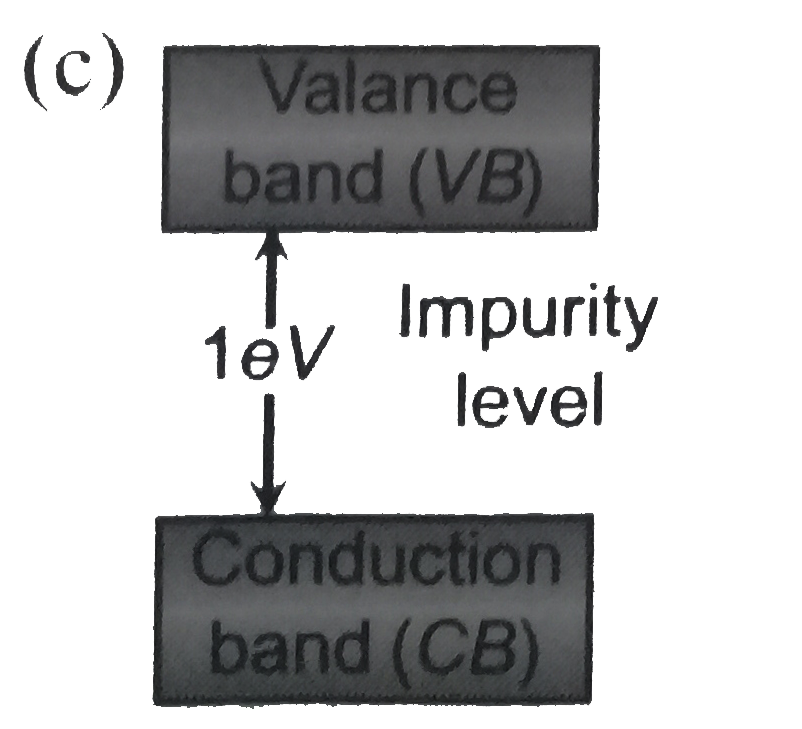
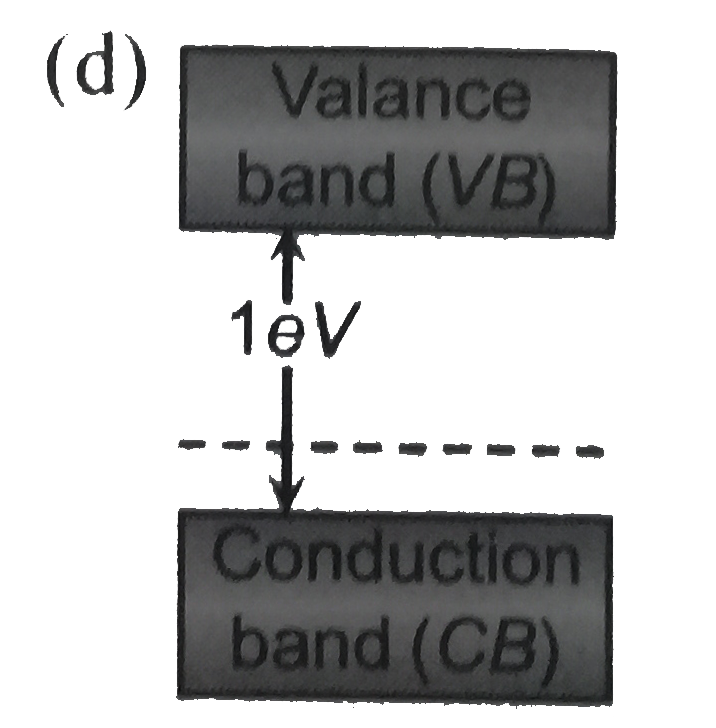
Which of the following energy band diagrams shows the N-type semiconductor?


The correct Answer is:B
To determine which energy band diagram represents an N-type semiconductor, we need to understand the characteristics of N-type semiconductors and how they are depicted in energy band diagrams. Here’s a step-by-step solution:
Step 1: Understand the Structure of Energy Bands
In semiconductors, there are two main energy bands: the valence band and the conduction band. The valence band is filled with electrons, while the conduction band is where electrons can move freely and conduct electricity.
Hint: Remember that the conduction band is always above the valence band in energy diagrams.
Step 2: Identify the Donor Level
In N-type semiconductors, impurities (donors) are added to the semiconductor material. These donor atoms have extra electrons that can be easily excited into the conduction band. The energy level of these donor electrons is typically just below the conduction band.
Hint: Look for a level close to the conduction band that represents the donor electrons.
Step 3: Analyze the Given Options
We have four options (A, B, C, D). We need to check each one for the following:
- The conduction band should be above the valence band.
- There should be a donor level present, which is close to the conduction band.
Hint: Disregard any options where the conduction band is below the valence band, as they cannot represent an N-type semiconductor.
Step 4: Evaluate Each Option
- Options C and D: Both have the valence band above the conduction band, which is incorrect for any semiconductor, including N-type.
- Options A and B: Both have the correct order of bands (conduction band above valence band). However, only option A shows a defined donor level near the conduction band.
Hint: Focus on the presence of the donor level in options A and B.
Step 5: Conclusion
Since option A is the only one that shows the donor level near the conduction band, it is the correct representation of an N-type semiconductor.
Final Answer: Option A is the correct energy band diagram for an N-type semiconductor.
In semiconductors, there are two main energy bands: the valence band and the conduction band. The valence band is filled with electrons, while the conduction band is where electrons can move freely and conduct electricity.
In N-type semiconductors, impurities (donors) are added to the semiconductor material. These donor atoms have extra electrons that can be easily excited into the conduction band. The energy level of these donor electrons is typically just below the conduction band.
We have four options (A, B, C, D). We need to check each one for the following:
- The conduction band should be above the valence band.
- There should be a donor level present, which is close to the conduction band.
- Options C and D: Both have the valence band above the conduction band, which is incorrect for any semiconductor, including N-type.
- Options A and B: Both have the correct order of bands (conduction band above valence band). However, only option A shows a defined donor level near the conduction band.
Since option A is the only one that shows the donor level near the conduction band, it is the correct representation of an N-type semiconductor.
Topper's Solved these Questions
- SEMICONDUCTOR ELECTRONICSBOOK - A2ZCHAPTER - SEMICONDUCTOR ELECTRONICSEXERCISE - Junction Diode
57 Videos
- SEMICONDUCTOR ELECTRONICSBOOK - A2ZCHAPTER - SEMICONDUCTOR ELECTRONICSEXERCISE - Diode In Circuits
40 Videos
- SEMICONDUCTOR ELECTRONICSBOOK - A2ZCHAPTER - SEMICONDUCTOR ELECTRONICSEXERCISE - EXERCISE
29 Videos
- NUCLEAR PHYSICSBOOK - A2ZCHAPTER - NUCLEAR PHYSICSEXERCISE - Section D - Chapter End Test
29 Videos
- SOURCE AND EFFECT OF MAGNETIC FIELDBOOK - A2ZCHAPTER - SOURCE AND EFFECT OF MAGNETIC FIELDEXERCISE - Section D - Chapter End Test
30 Videos
Similar Questions
Knowledge Check
A N - type semiconductor is
Apositively chargedBnegatively chargedCpositively charged at low temperature and negative charged at high temperatureDelectrically neutraln-type semiconductor is
Apositive chargedBnegatively chargedCneutralDpositive or negative depending upon doping materialAN-type semiconductor is
ANegatively chargedBPositevely chargedCNeutralDNone of these
