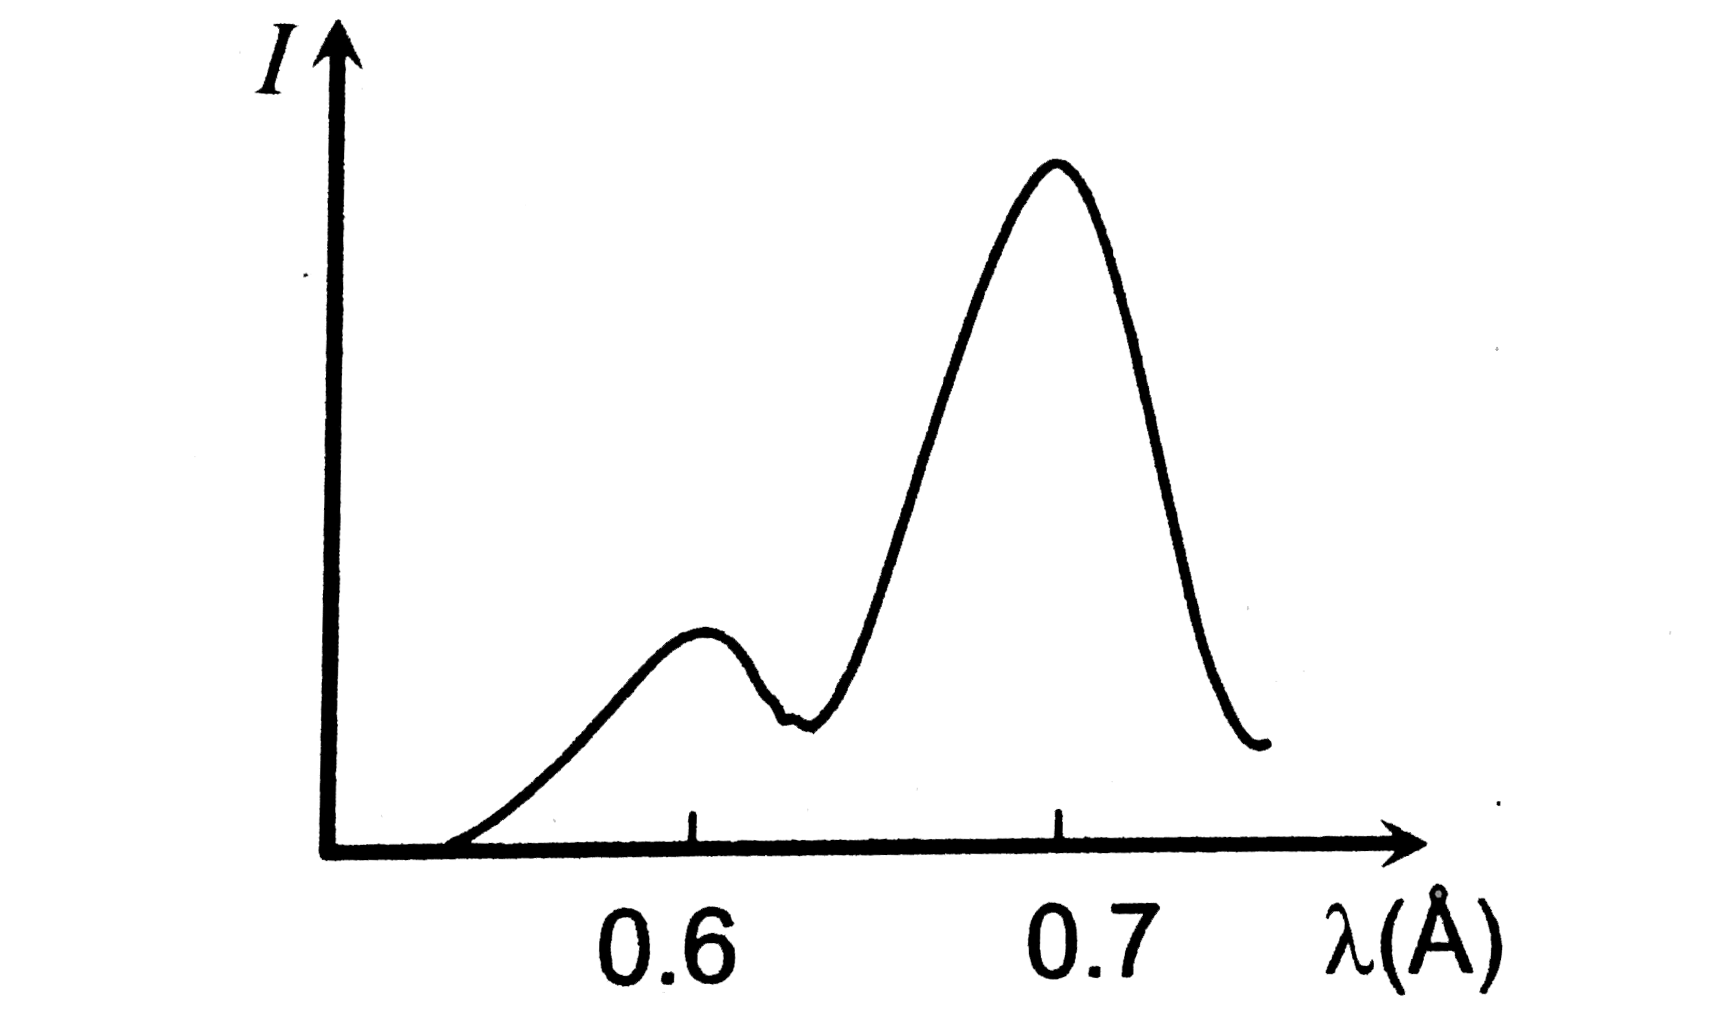
In the diagram a graph between the intensity of X-rays emitted by a molybdenum target and the wavelength is shown , when electrons of 30keV are incident on the target. In th egraph one peak is of Kα line and the other peak is of Kβ line

First peak is of Kα line at 0.6Å
Highest peak is of Kα line at 0.7Å
If the energy of incident particles is increased , then the peaks will shift towards left
If the energy of incident particles is increased , then the peaks will shift towards right
The correct Answer is:B
Peak of Kα is greater than peak of Kβ line.
Topper's Solved these Questions
- DUAL NATURE OF RADIATION AND MATTERBOOK - A2ZCHAPTER - DUAL NATURE OF RADIATION AND MATTEREXERCISE - Assertion Reason
14 Videos
- CURRENT ELECTRICITYBOOK - A2ZCHAPTER - CURRENT ELECTRICITYEXERCISE - Section D - Chapter End Test
29 Videos
- ELECTRIC CHARGE, FIELD & FLUXBOOK - A2ZCHAPTER - ELECTRIC CHARGE, FIELD & FLUXEXERCISE - Section D - Chapter End Test
29 Videos
Similar Questions
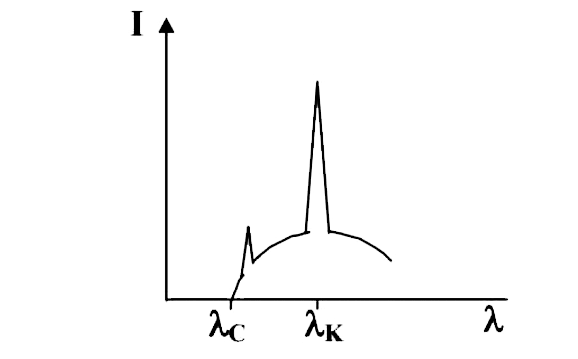
The intensity of X-rays from a coolidge tube is plotted against wavelength as shown in figure. The minimum wavelength found is λc and the wavelength of the kα line is λk. As the accelerating voltage is increased.

View SolutionCalculate the wavelength of Kα line for the target made of tungsten (Z=74).
View Solution
Knowledge Check
In an x-ray tube, electrons with energy 35 keV are incident on a cobalt (Z=27) target. Determine the cutoff wavelength for x-ray production.
A1.4×10−11mB3.6×10−11mC1.8×10−11mD3.2×10−11mThe intensity of X- ray from a coolidge tube is plotted againest wavelength λ as shown in the figure . The minimum wavelength found λc and the wavelength of theka line is λλ, As the accelerating voliage is increase
 Aλλ−λc increaseBλλ−λc decreaseCλλ increaseDλλdecrease
A beam of 350 keV electrons a molybdenum target, generating the X-rays. What is the cut-off wavelength?
A3.55 pmB400 pmC1595 pmD182 pm
The intensity of X - rays from a Coolidge tube is plotted against wavelength λ as shown in figure -3.8 . The minimum wavelength as found is λC and wavelength of the Kα- line is λK' . As the accelerating voltage is increased :

View SolutionA beam of 35.0keV electrons strikes a molybdenum target, generating the X-rays. What is the cutoff wavelength ?
View SolutionThe wavelength of Kα –line characteristic X–rays emitted by an element is 0.32Å. The wavelength of Kβ–line emitted by the same element will be :–
View SolutionThe wavelength of the most energetic X–ray emitted when a metal target is bombarded by 100 KeV electrons is approximately
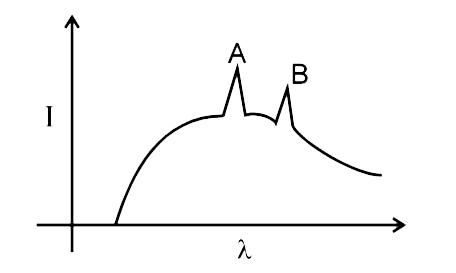
View SolutionFollowing diagram shows relation between emitted X-rays intensity and wavelength obtained X-ray tube its sharp peaks A and B shows

View Solution