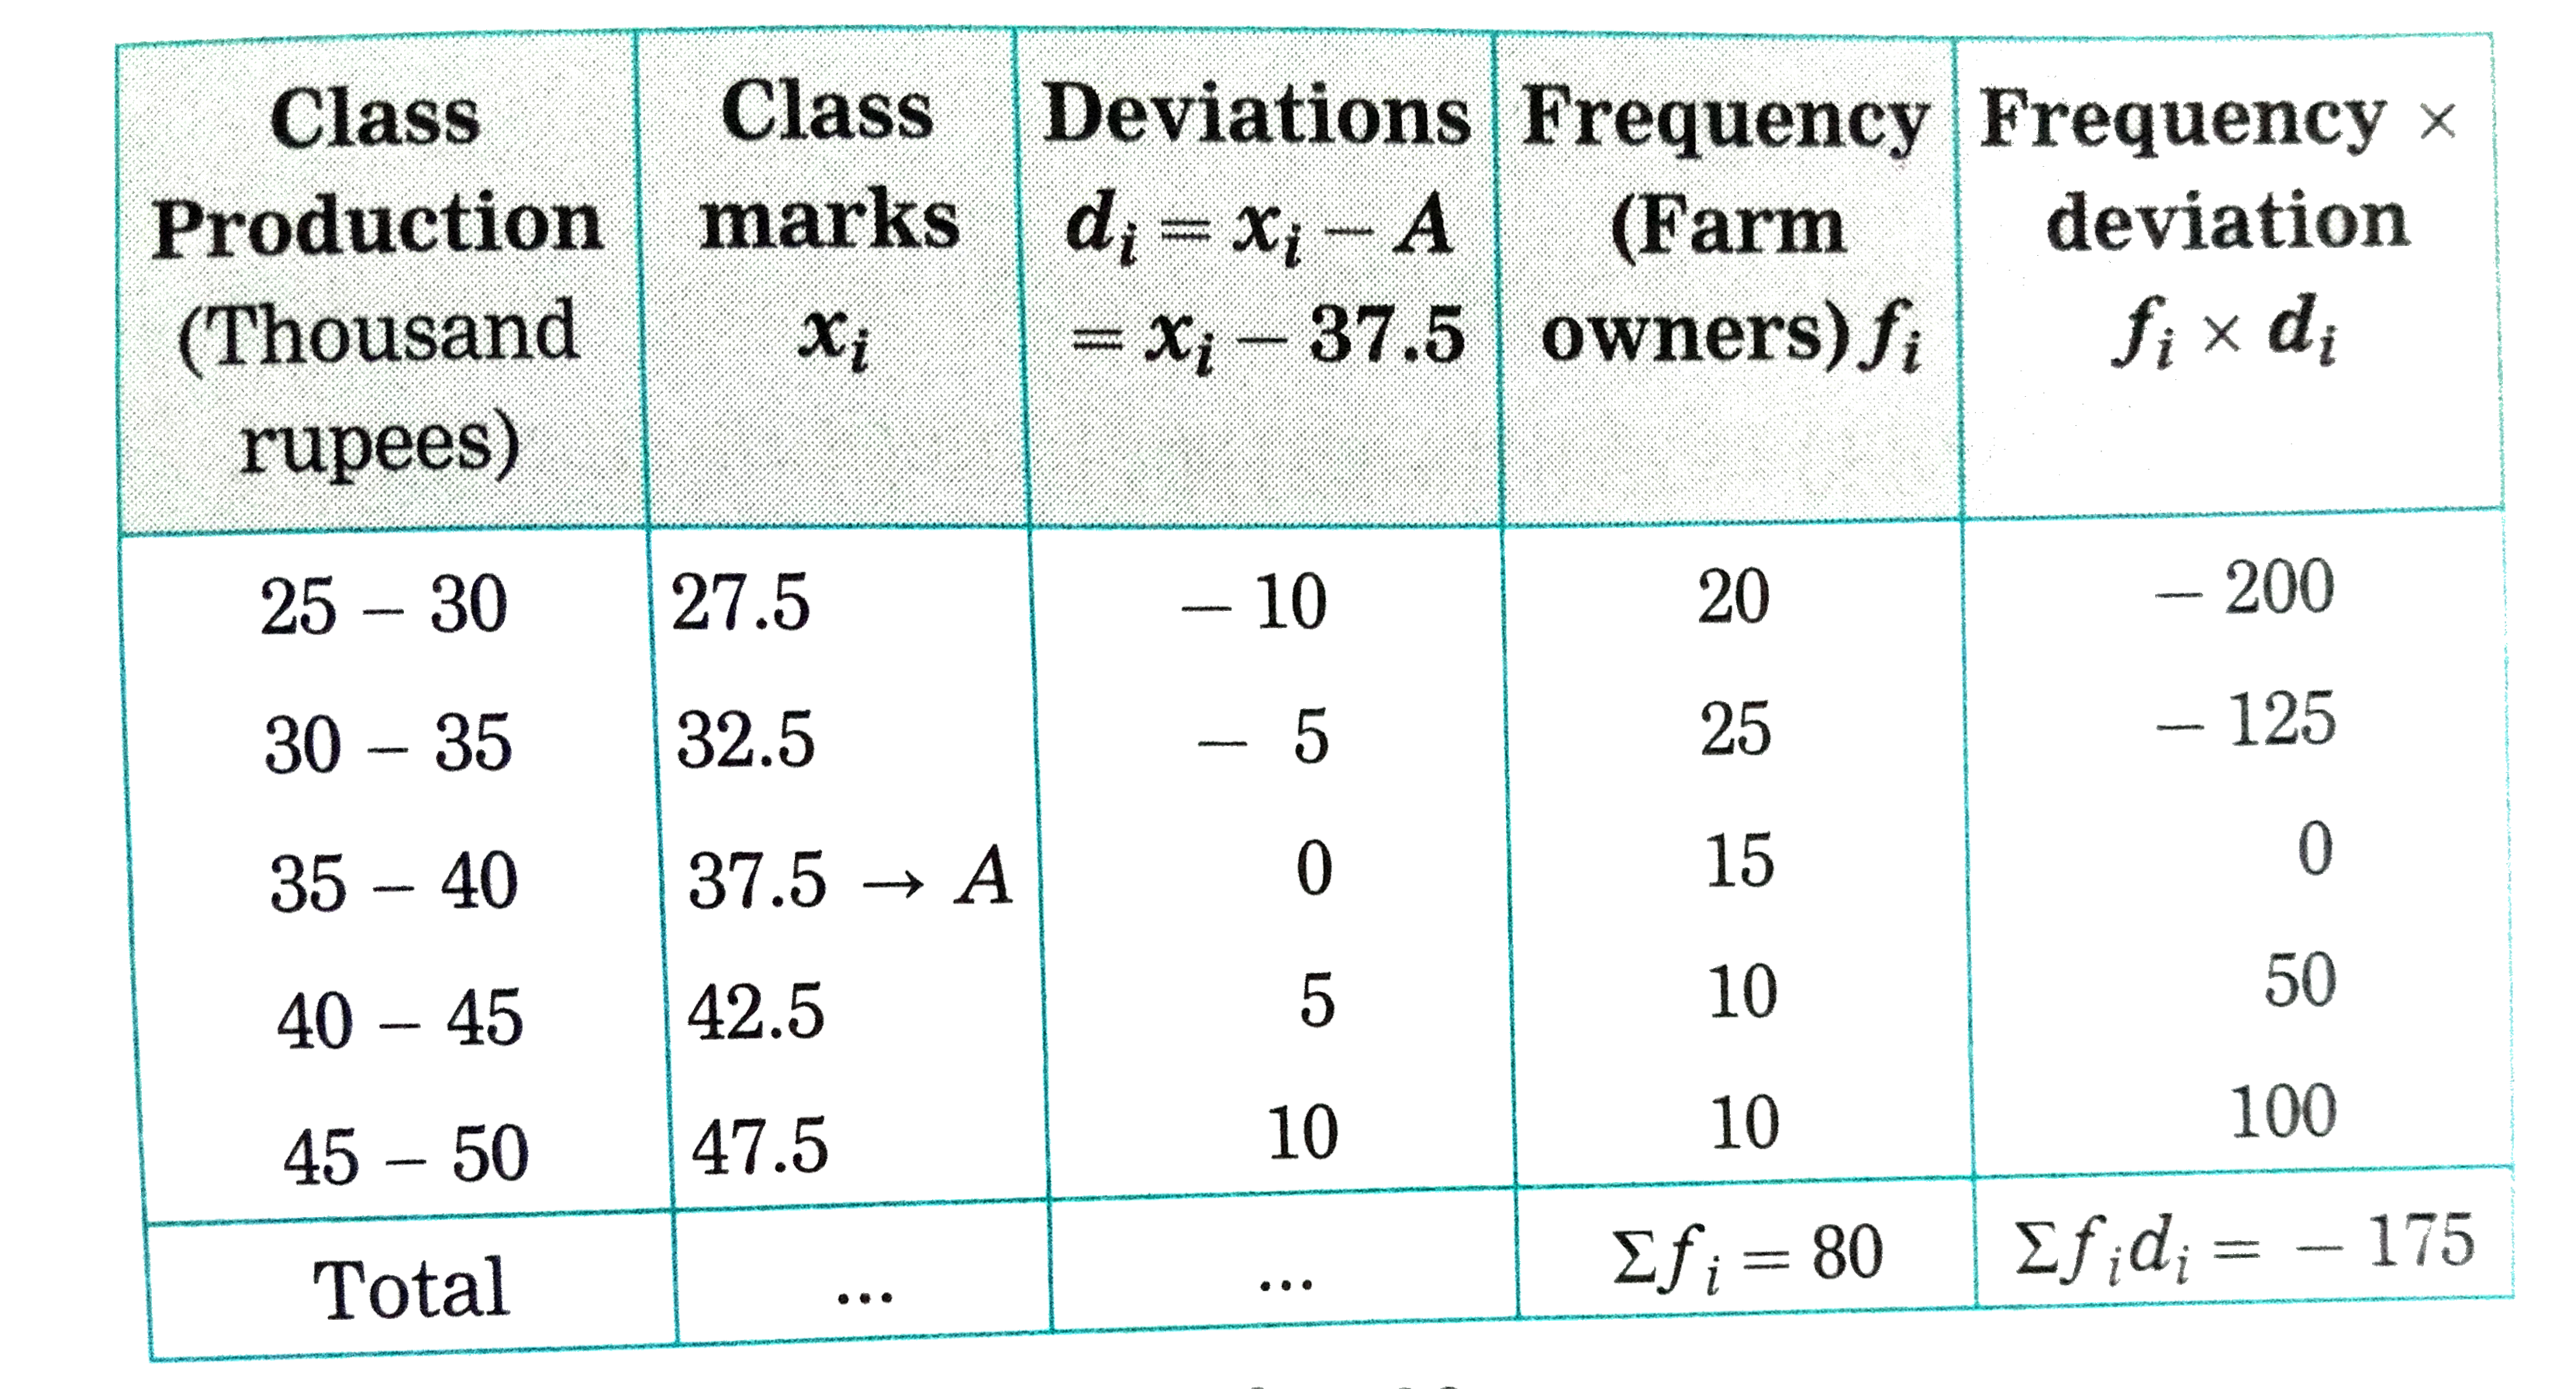
A frequency distribution table for the production of oranges of some farm owners is given below.
Find the mean production of oranges by ' assumed mean ' method .

The correct Answer is:The mean of production of oranges is Rs. 35,310.
Let us take 37.5 as the assumed mean. Them A=37.5 and deviation di=xi−A=xi−37.5

Here, Σfidi=−175,Σfi=80
¯d=ΣfidiΣfi=−17580=−2.1875≈−2.19
Mean ¯¯¯X=A+¯d
=37.5+(−2.19)
=37.5−2.19=35.31 thousands = 35310.
Topper's Solved these Questions
- STATISTICSBOOK - NAVNEET PUBLICATION - MAHARASHTRA BOARDCHAPTER - STATISTICSEXERCISE - PRACTICE SET 6.2
4 Videos
- STATISTICSBOOK - NAVNEET PUBLICATION - MAHARASHTRA BOARDCHAPTER - STATISTICSEXERCISE - PRACTICE SET 6.3
4 Videos
- STATISTICSBOOK - NAVNEET PUBLICATION - MAHARASHTRA BOARDCHAPTER - STATISTICSEXERCISE - MISCELLANEOUS
24 Videos
- SIMILARITYBOOK - NAVNEET PUBLICATION - MAHARASHTRA BOARDCHAPTER - SIMILARITYEXERCISE - SUBJECTIVE TYPE
20 Videos
- THEOREMS BOOK - NAVNEET PUBLICATION - MAHARASHTRA BOARDCHAPTER - THEOREMS EXERCISE - CIRCLE
15 Videos
Similar Questions
Find the mean by assumed mean method.

View SolutionFind the mean by assumed mean method.

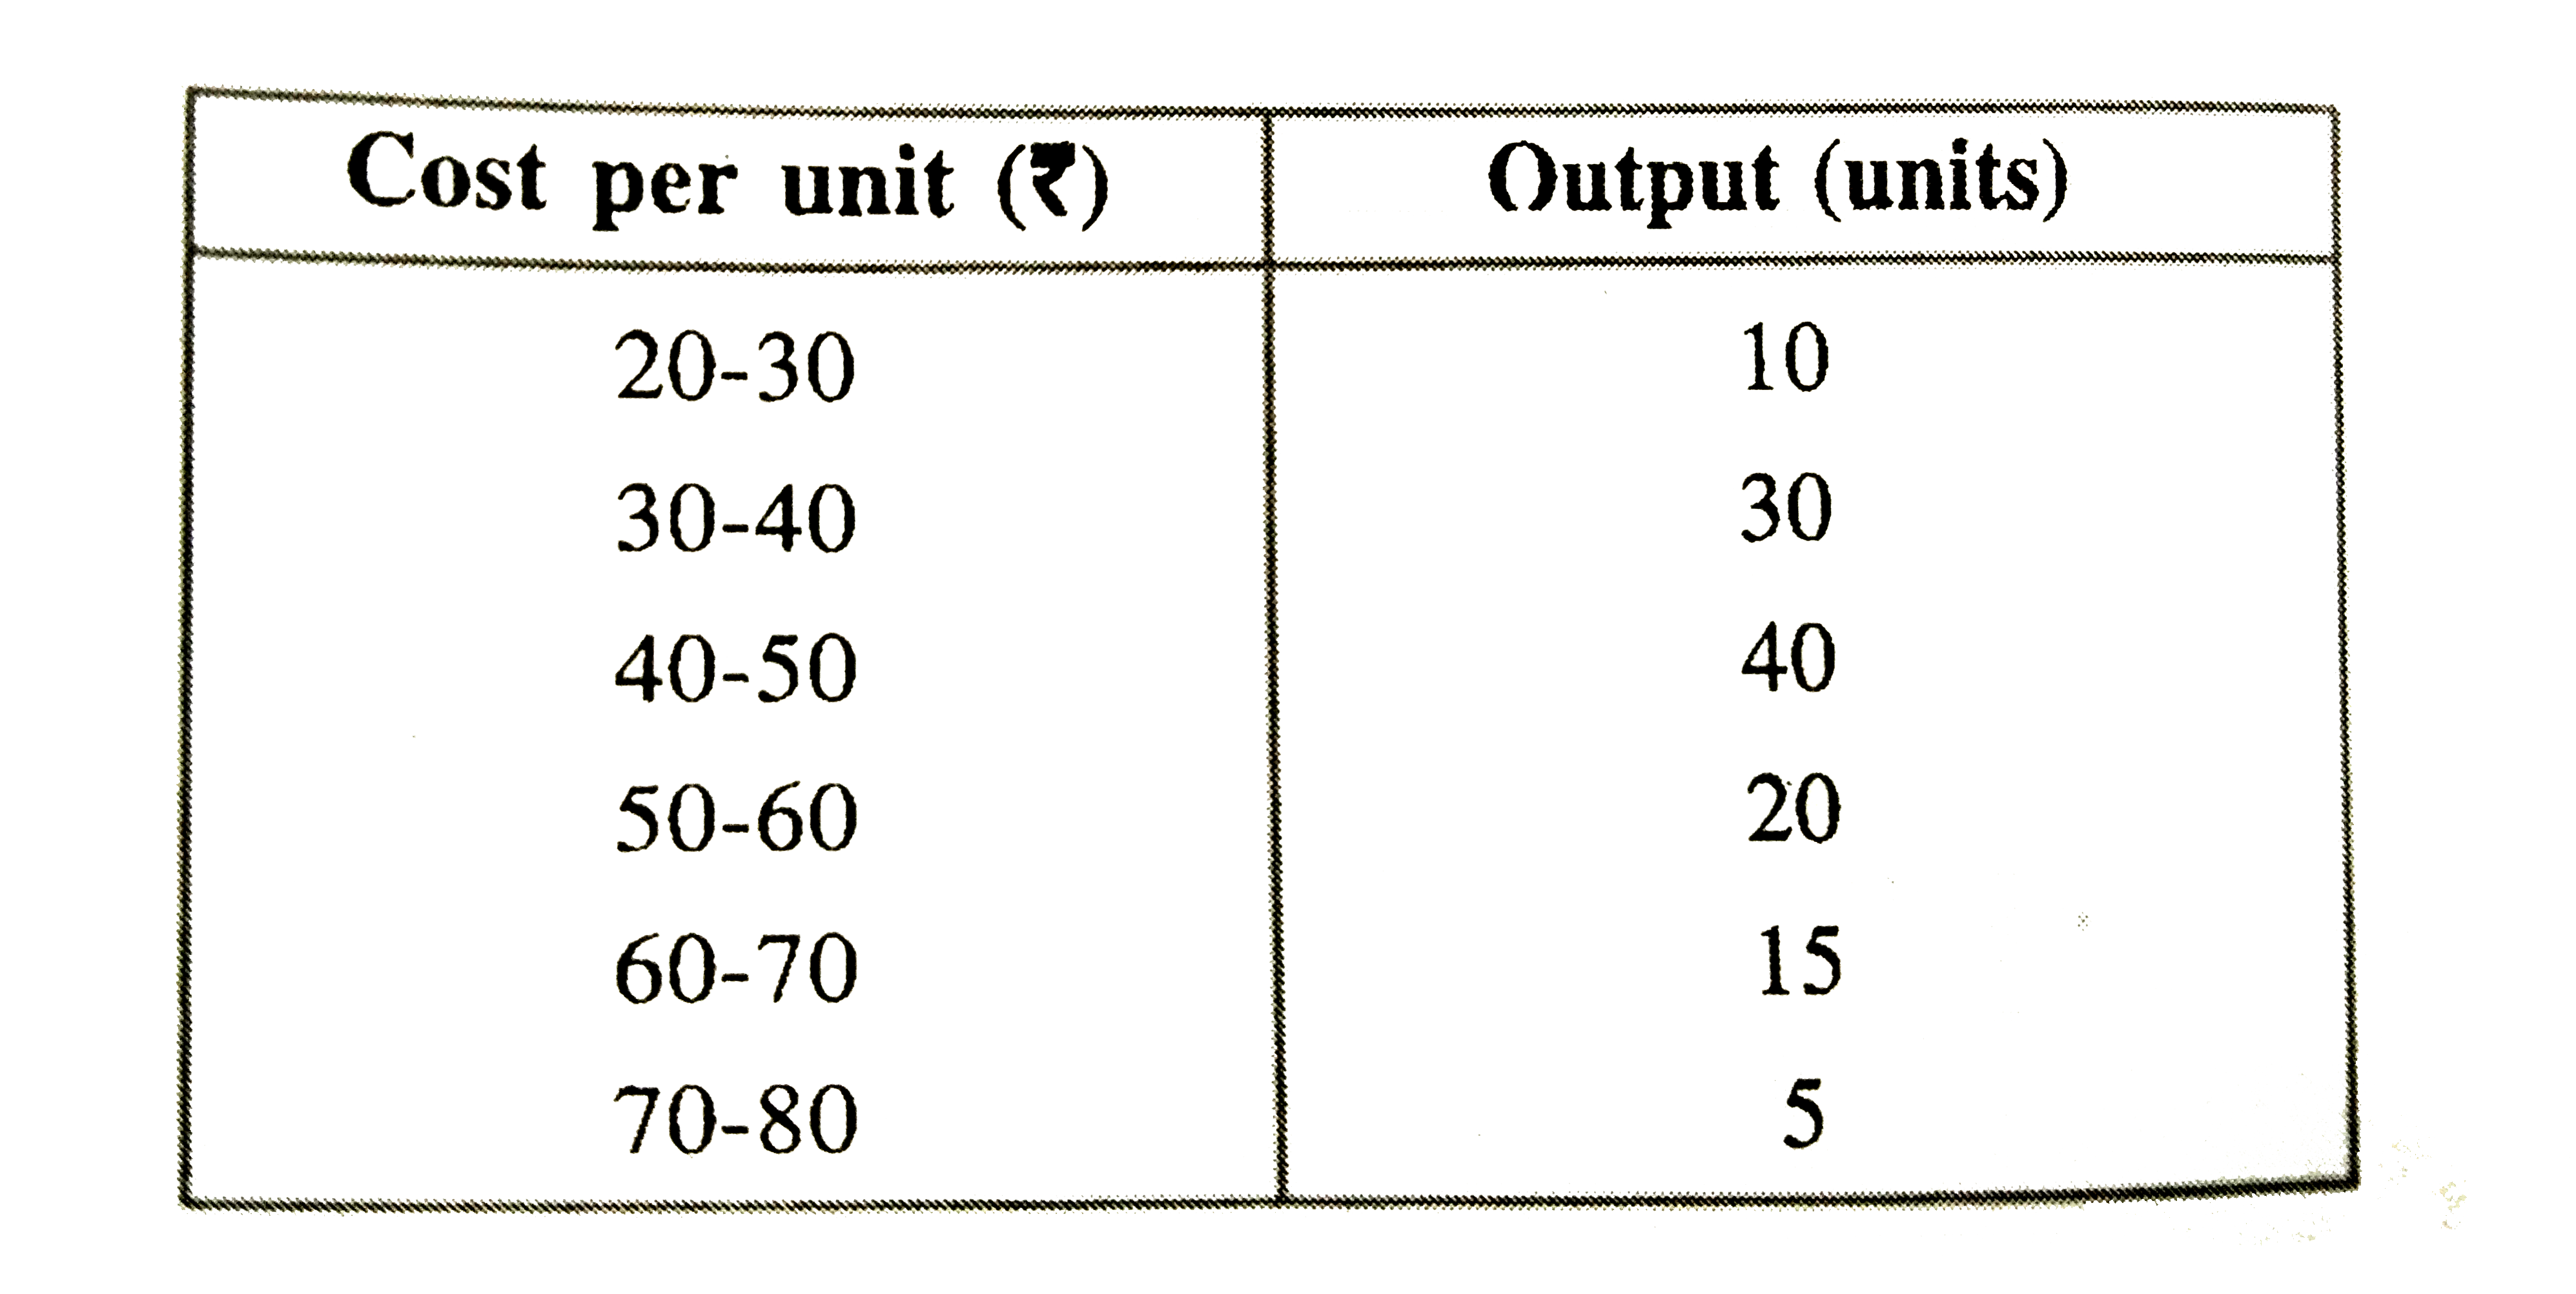
View SolutionFrequency distribution of cost of production per unit of a good is given below. Find the average cost.

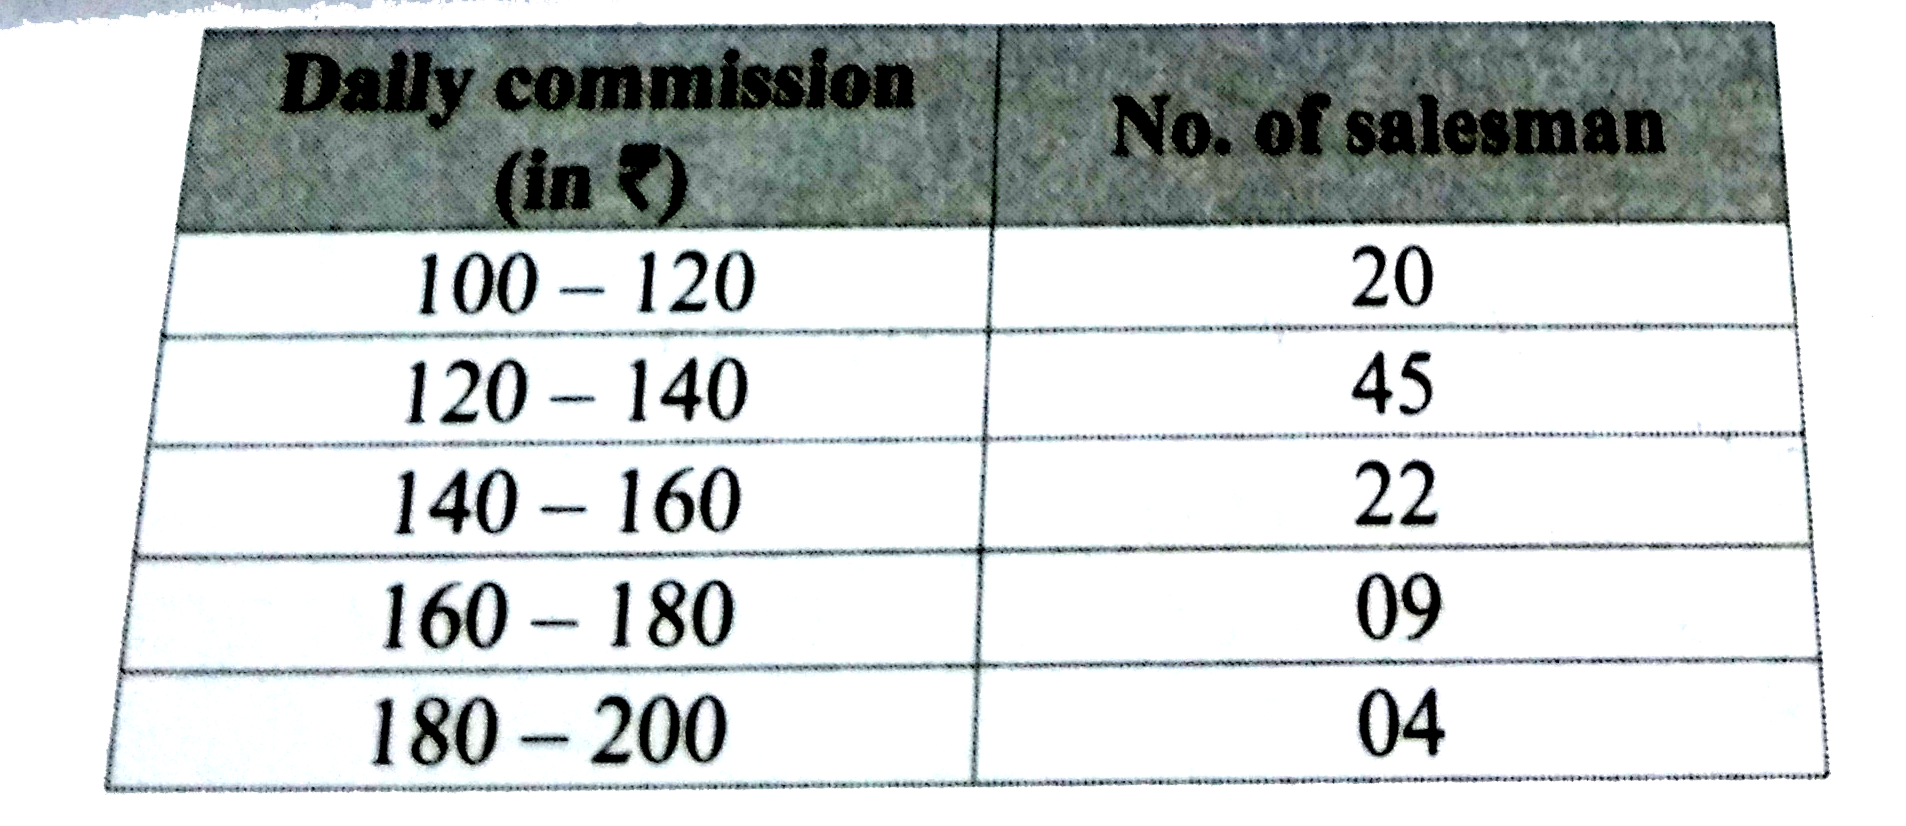
View SolutionFrequency distribution of daily commission received by 100 salesman is given below:

Find mean daily commission received by salesman, by assumed mean method.
View SolutionFind the mean of the following table by step deviation method :

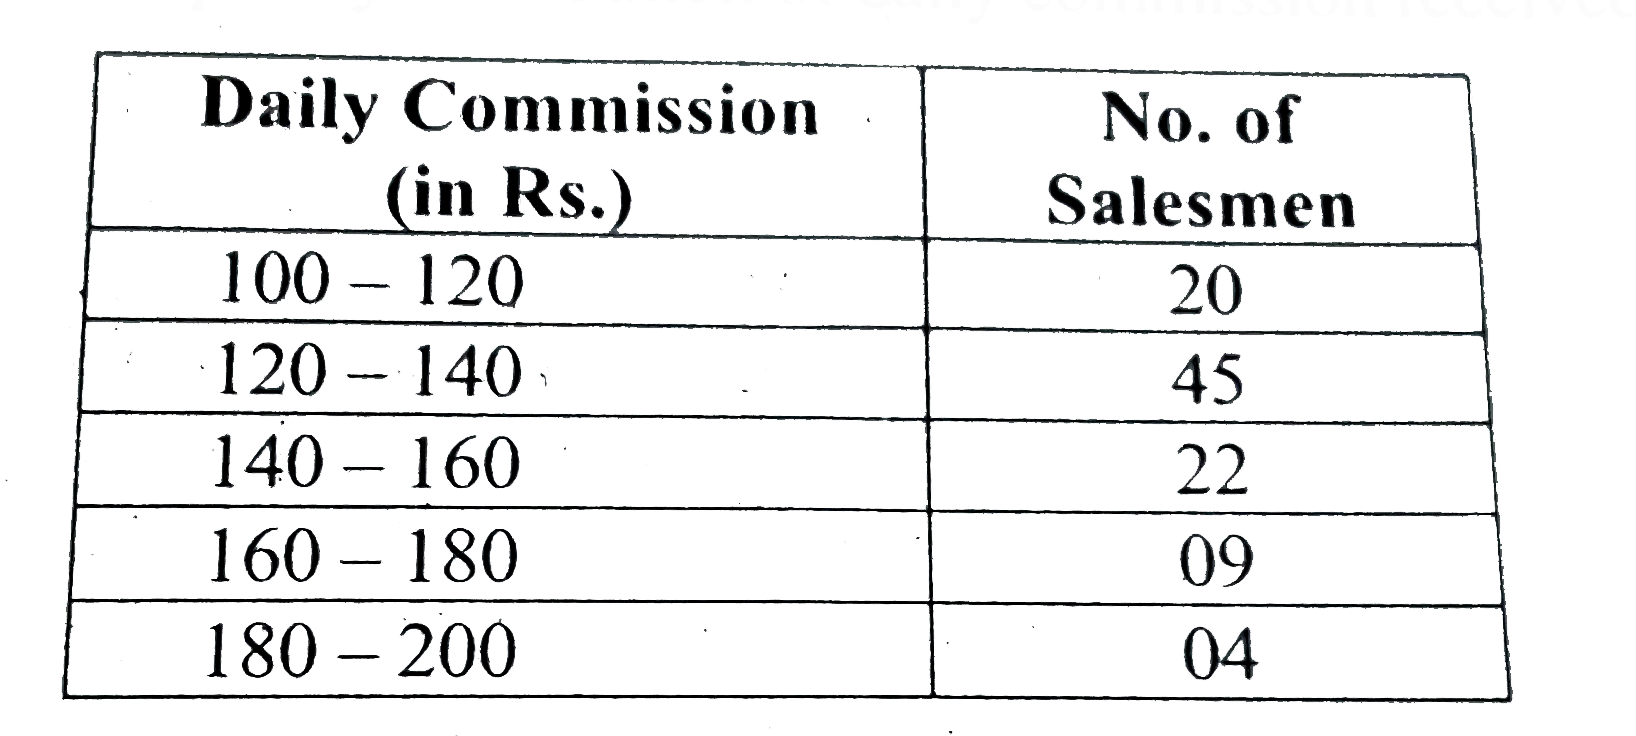
View SolutionFrequency distribution of daily commission received by 100 salemen is given below:

Find mean daily commission received by salesmen, by assumed mean method.
View SolutionThe following table gives production yield per hectare of wheat of 100 farms of a village.

Find the mean production.
View SolutionThe following frequency distribution table shows the amount of aid given to 50 flood affected families. Find the mean of the amount of aid.

View SolutionFind the mean of the following table by step dcviation method :

View SolutionThe following table shows the frequency table of daily wages of 50 workers in a trading company. Find the mean wages of a worker, by assumed mean method.

View Solution
