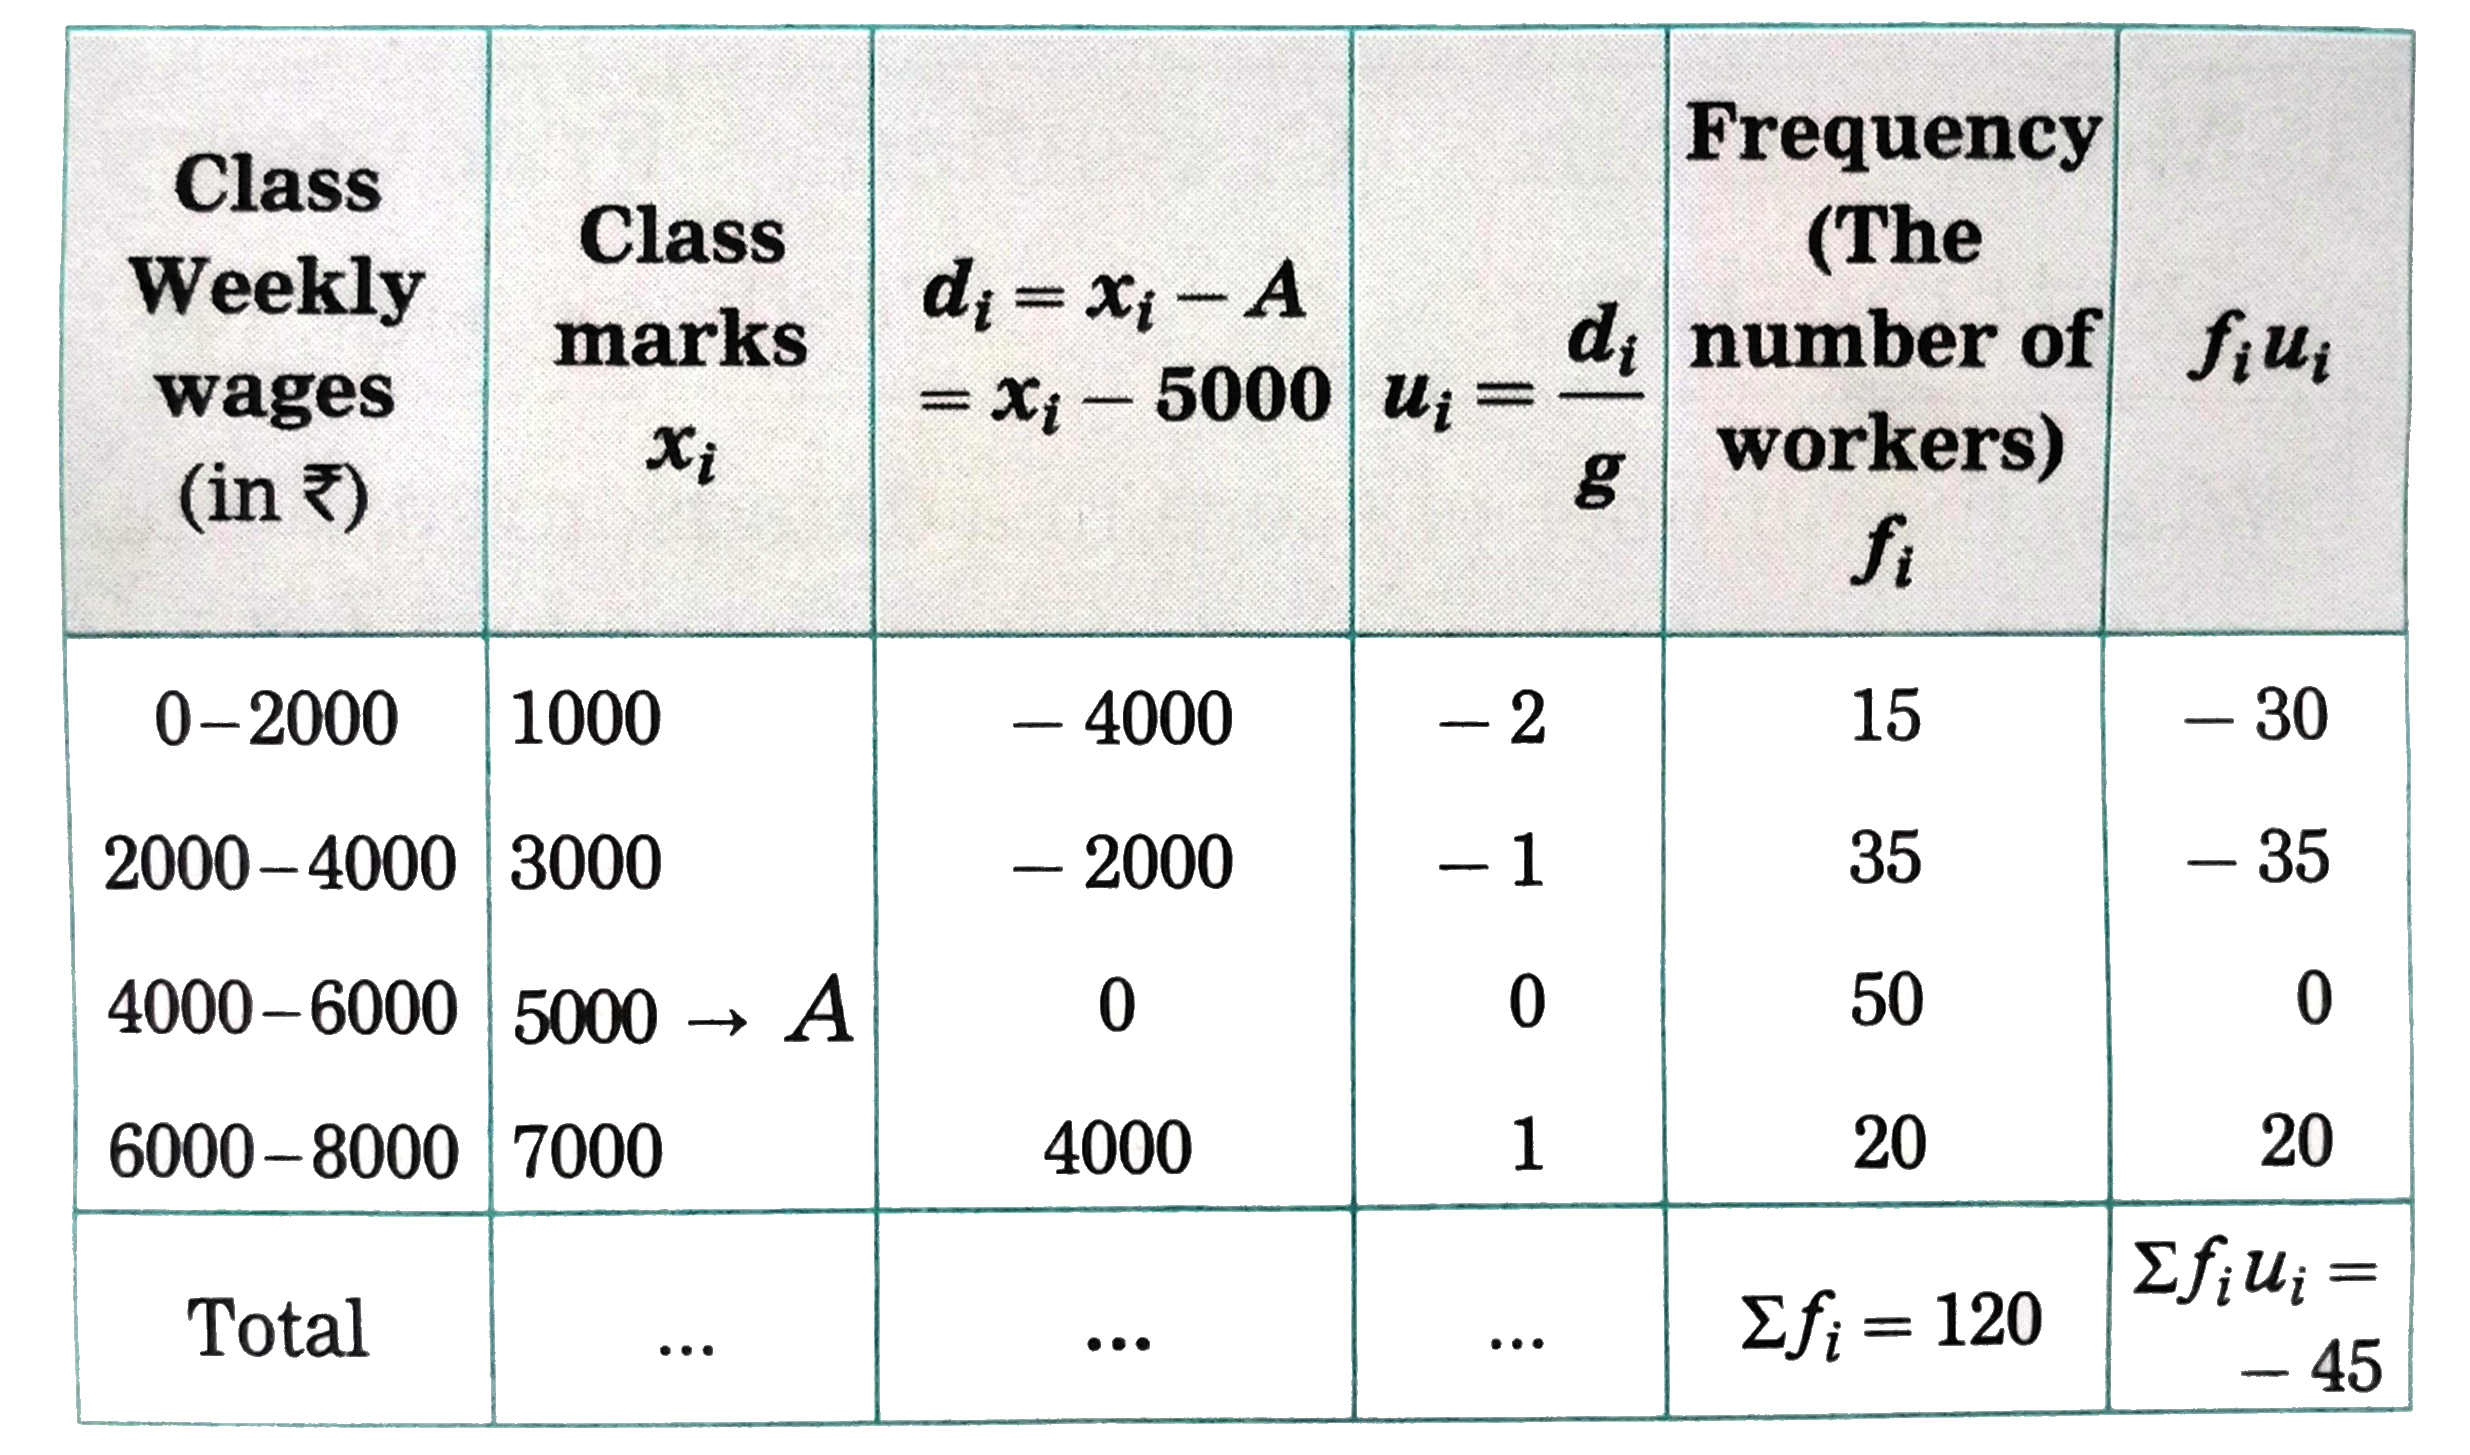
The weekly wages of 120 workers in a factory are shown in the following frequency distribution table. Find the mean of the weekly wages.
(Use Step deviation method)

The correct Answer is:The mean of the weekly wages is Rs. 4250.

Here, Σfiui=−45,Σfi=120,g=2000
(the GCD of 4000, 2000 and 2000)
¯u=ΣfiuiΣfi ...(Formula)
=−45120=−0.375
Mean ¯¯¯X=A+¯ug
=5000+(−0.375)×2000
=5000−750=4250
Topper's Solved these Questions
- STATISTICSBook:NAVNEET PUBLICATION - MAHARASHTRA BOARDChapter:STATISTICSExercise:MISCELLANEOUS
Explore 24 Videos
- STATISTICSBook:NAVNEET PUBLICATION - MAHARASHTRA BOARDChapter:STATISTICSExercise:PRACTICE SET 6.1
Explore 6 Videos
- STATISTICSBook:NAVNEET PUBLICATION - MAHARASHTRA BOARDChapter:STATISTICSExercise:Assignment 6.4
Explore 9 Videos
- SIMILARITYBook:NAVNEET PUBLICATION - MAHARASHTRA BOARDChapter:SIMILARITYExercise:SUBJECTIVE TYPE
Explore 20 Videos
- THEOREMS Book:NAVNEET PUBLICATION - MAHARASHTRA BOARDChapter:THEOREMS Exercise:CIRCLE
Explore 15 Videos
Similar Questions
Find the mean of the following table by step deviation method :

View SolutionFind the mean of the following table by step dcviation method :

View SolutionFind the mean from the following table using step deviation method :

View SolutionFind the mean from the following table using step deviation method :

View SolutionFind the mean from the following table using step deviation method :

View SolutionFind the mean of the following frequency distribution by direct method.

View SolutionFind the mean of the following frequency distribution using assumed mean method:

View SolutionFind the mean from the following table using step devitaion method :

View SolutionFind the mean from the following table using step devitaion method :

View SolutionFind the mean of the following distribution by step-deviation method.

View Solution