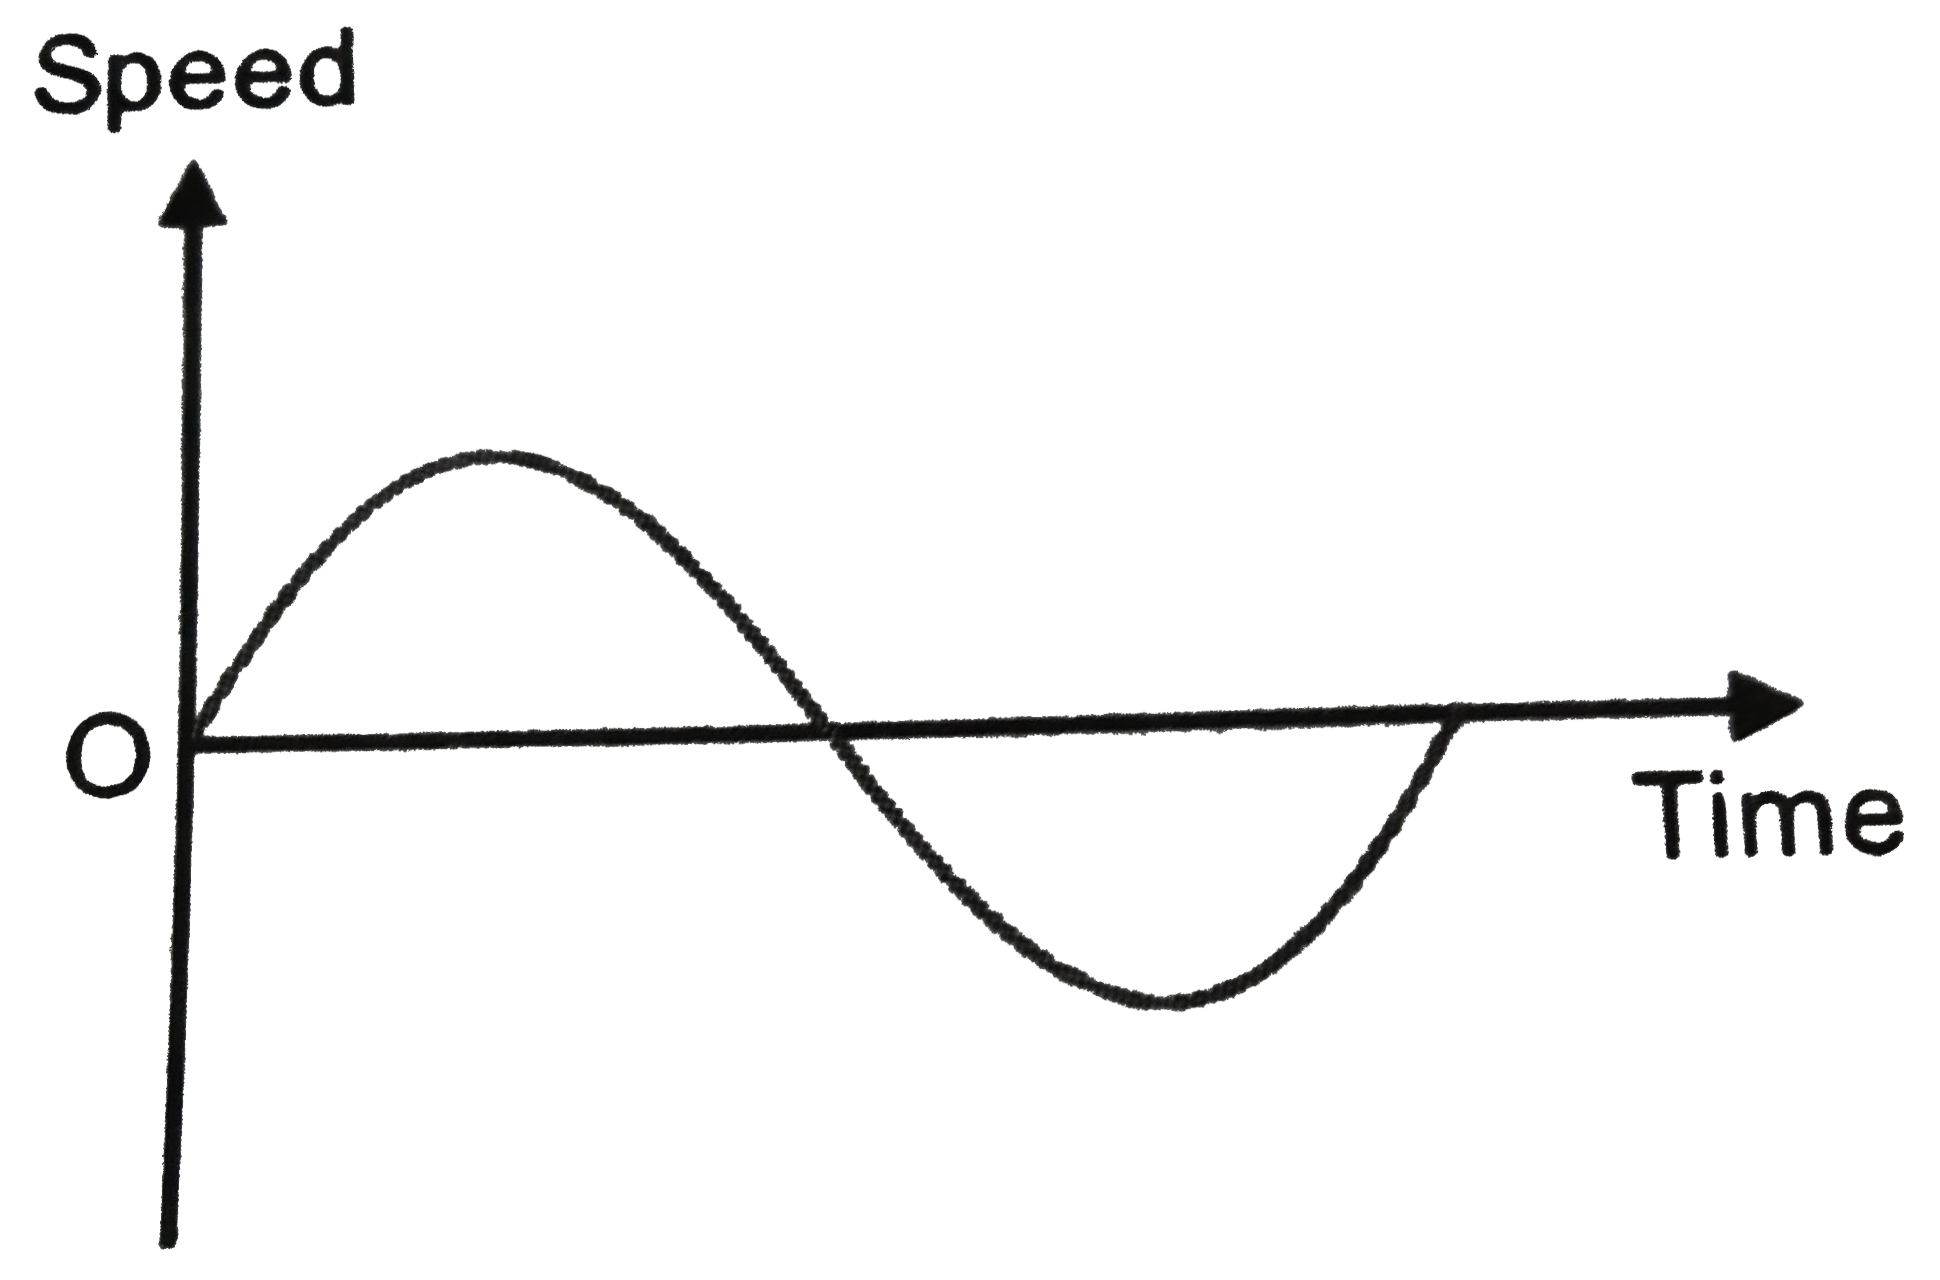
What is wrong with the speed time graph as shown in Fig.2 (b) .25.
Speed being scalar can not have begative balue.
 .
.
Topper's Solved these Questions
- KINEMATICSBook:PRADEEPChapter:KINEMATICSExercise:3 Very short
Explore 46 Videos
- KINEMATICSBook:PRADEEPChapter:KINEMATICSExercise:4 Very short
Explore 24 Videos
- KINEMATICSBook:PRADEEPChapter:KINEMATICSExercise:1 Very short
Explore 23 Videos
- GRAVIATIONBook:PRADEEPChapter:GRAVIATIONExercise:Assertion-Reason Type Questions
Explore 19 Videos
- LAWS OF MOTIONBook:PRADEEPChapter:LAWS OF MOTIONExercise:Assertion- Reason Type Questions
Explore 17 Videos
Similar Questions
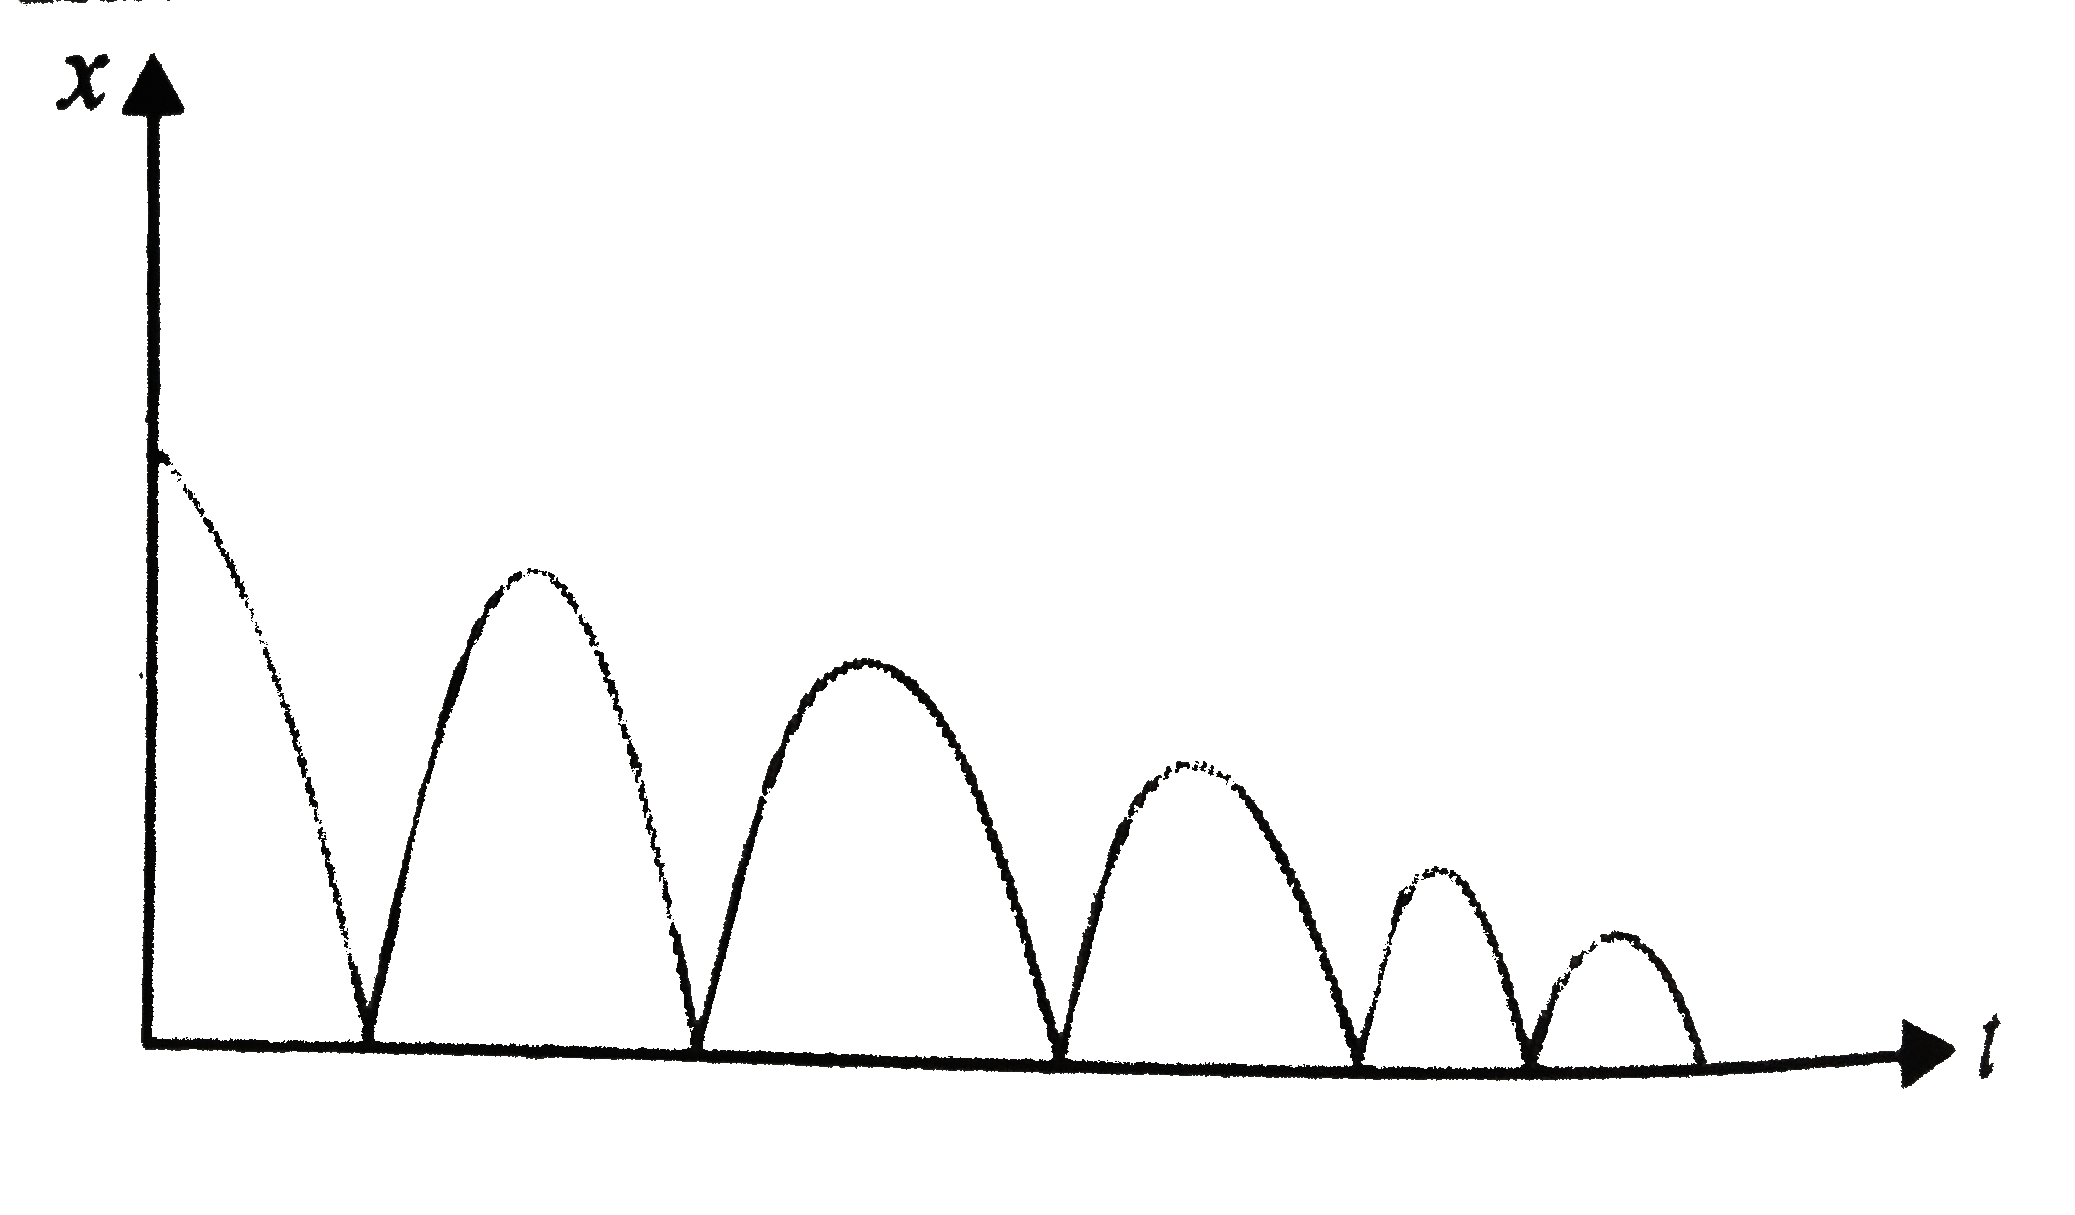
A ball is dropped and its displacement vs time graph is as shown in Fig. 2 (EP) .7 (displacement (x) is grom ground and all quantities are +ve upwards). (a) Plot qualitvely velocity vs time graph). (b) plot qualitatively acceleration vs time graph .
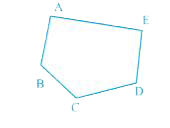
View SolutionName the line segments shown in Fig. 2.25.
View Solution
Knowledge Check
A block is hanging with a light string in a lift as shown in the figure (a). The lift is moving in upward direction and its speed time graph is plotted as shown in the figure (b) : (take g=10m/s2)
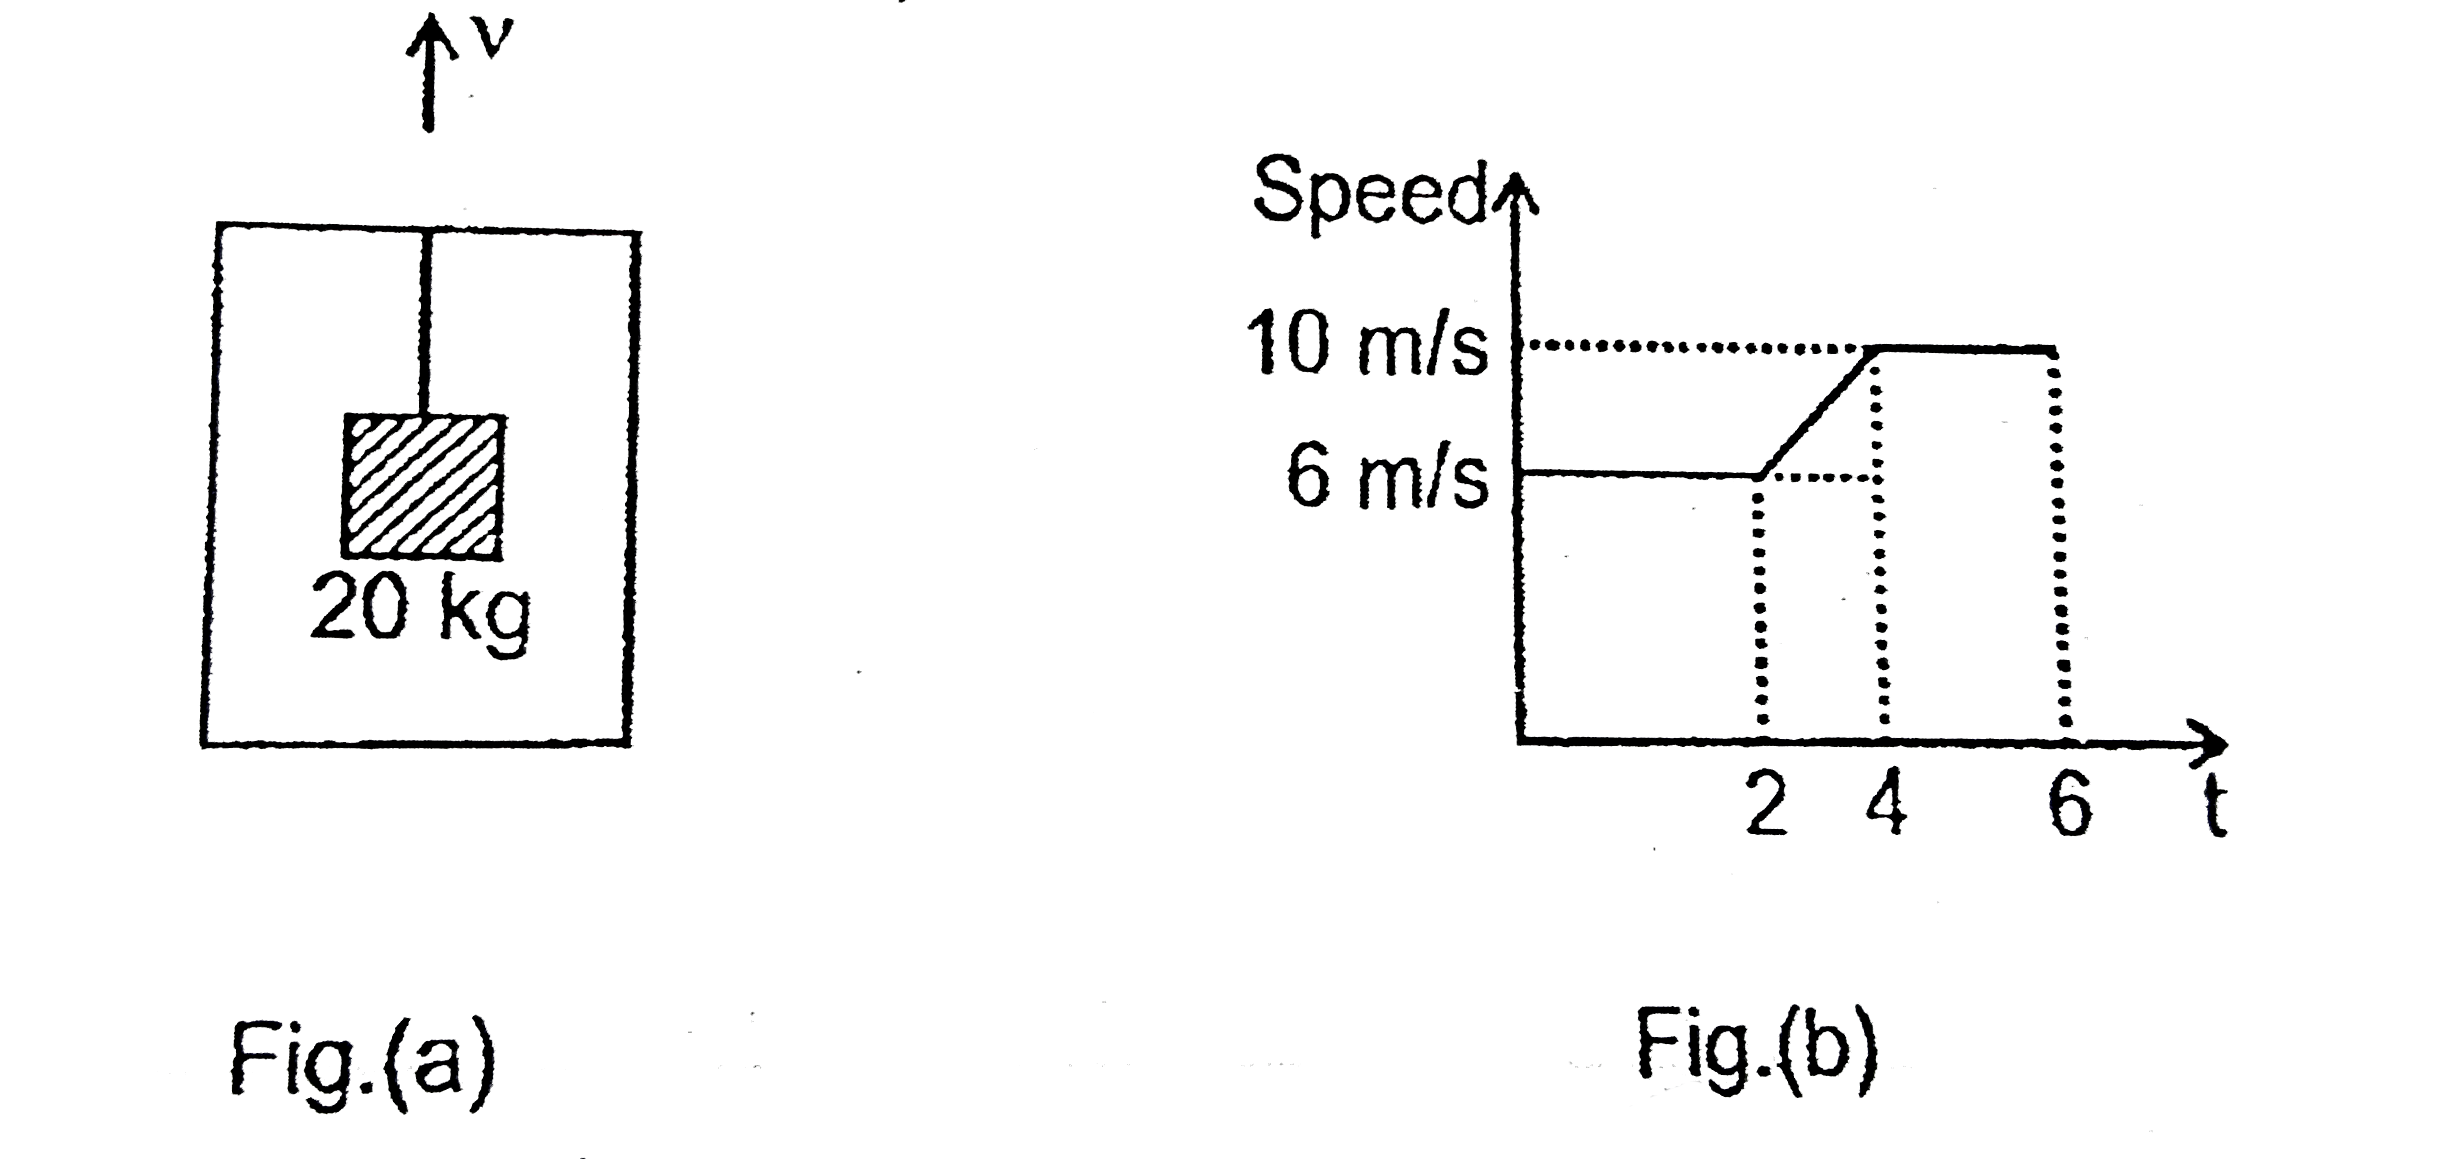 ATension in the rope at t=1 sec is 100NBTension in the rope at t=3 sec is 240NCTension in the rope at t=5 sec is 200NDTension in the rope at t=1 sec is 200N
A body of 2kg has an initial speed 5ms−1 . A force acts on it for some time in the direction of motion. The force time graph is shown in figure. The force time graph is shown in figure. The final speed of the body is
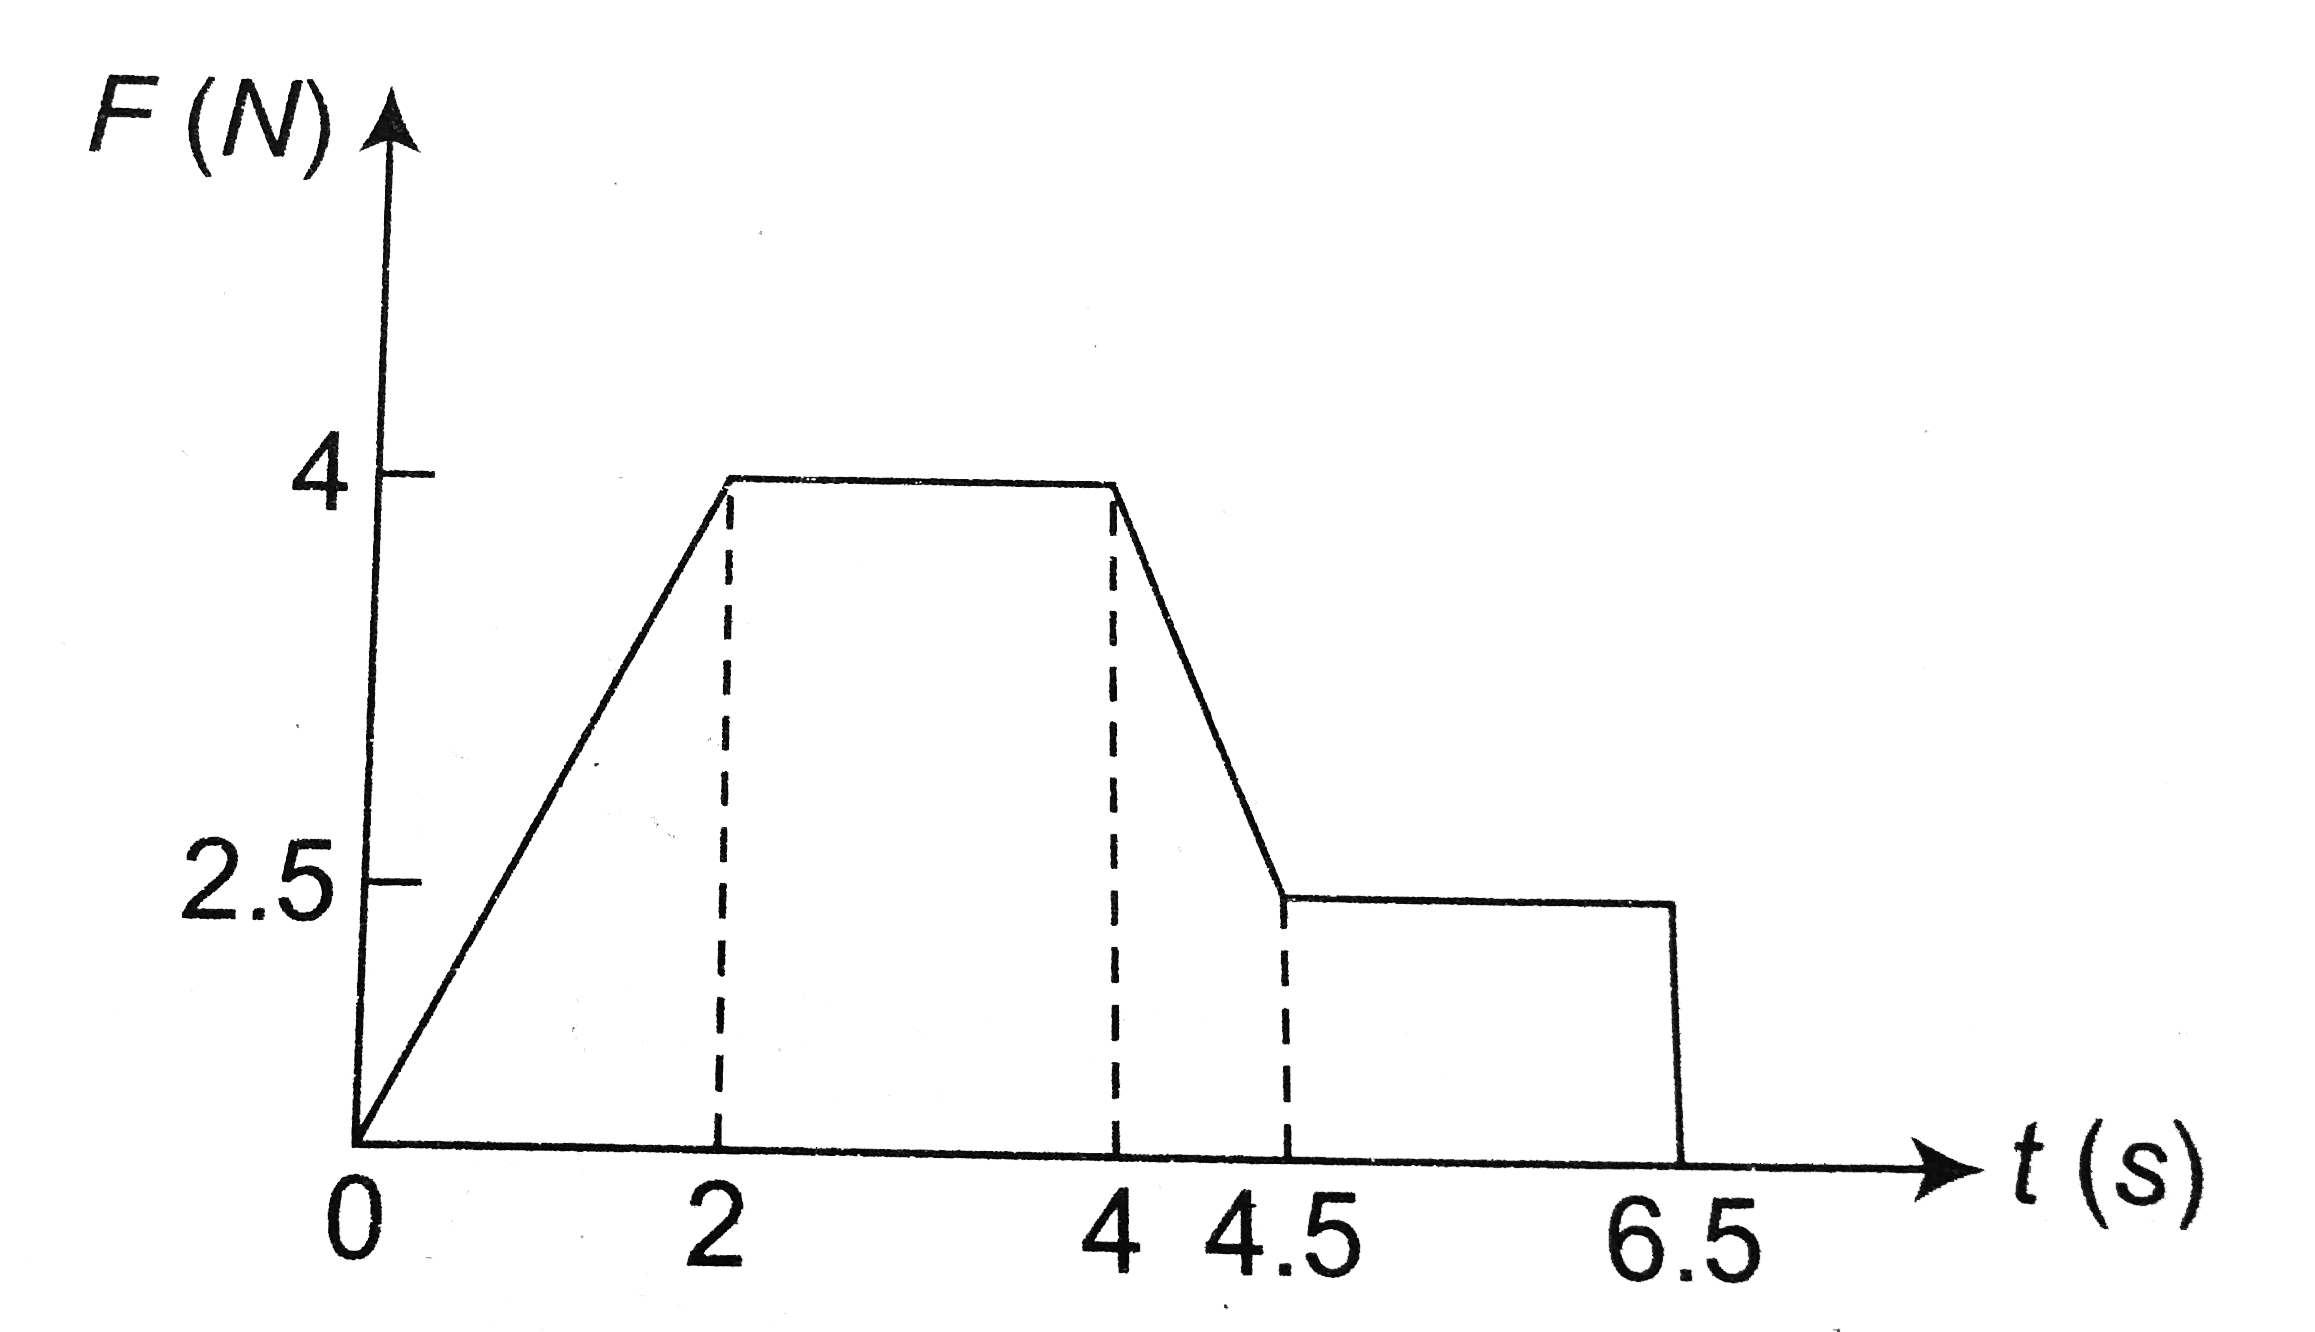 A9.25ms_(−1)B5ms_(−1)C14.25ms_(−1)D4.25ms_(−1)
What does the slope of a speed-time graph indicate ?
ASpeedBAccelerationCvelocityDnone of the above
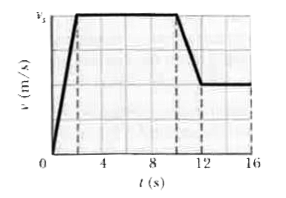
How for does the runner whose velocity-time graph is shown in Fig. 2-25 travel in 16 s ? The figure's vertical scaling is set by vs=8.0m/s.
View SolutionWhat does the slope of a speed-time graph indicate ?
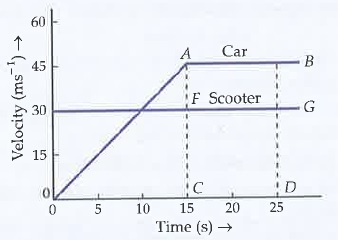
View SolutionAs soon as a car just starts from rest in a certain direction, a scooter moving with a uniform speed overtakes the car. Their velocity-time graphs are shown in Fig. 3.66. Calculate the time when the car will catch up the scooter.
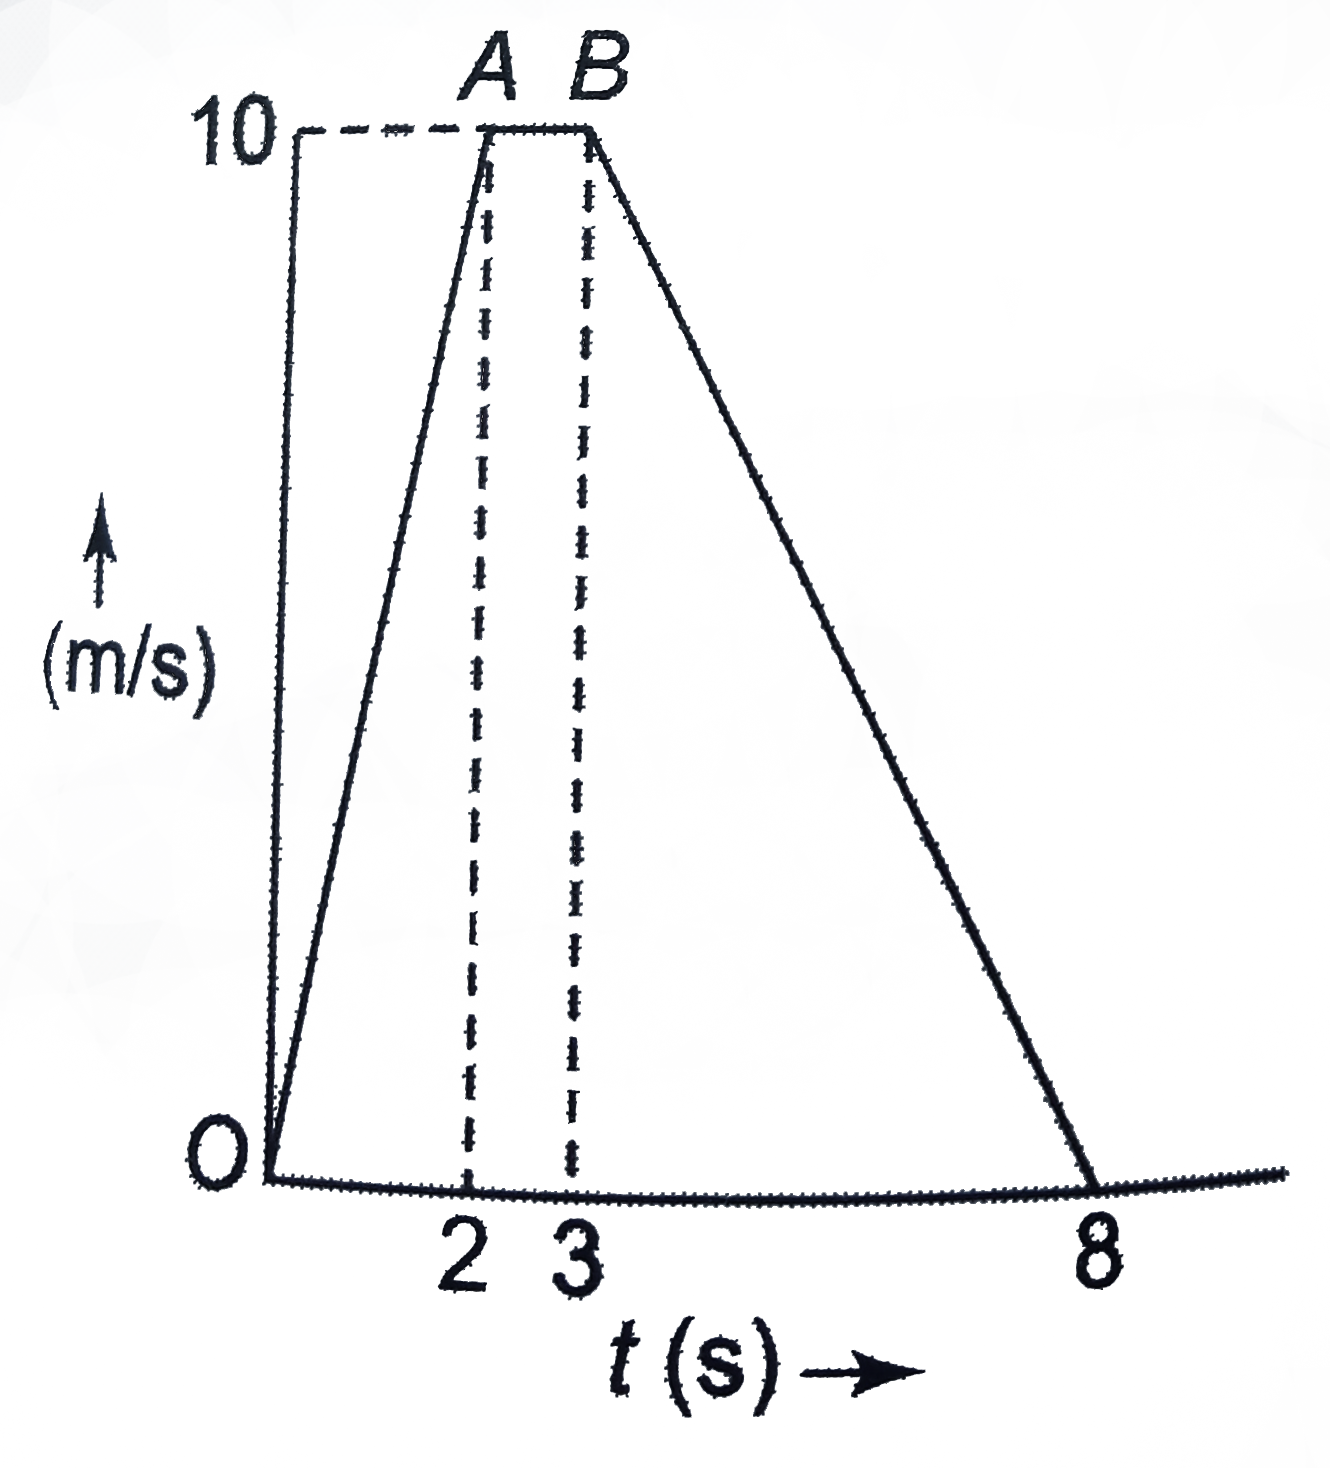
View SolutionFor a particle moving in a straight line, the velocity-time graph is as shown in the figure. Find the acceleration at time t=1s2.5s and 5s. Sketch the acceleration time graph.
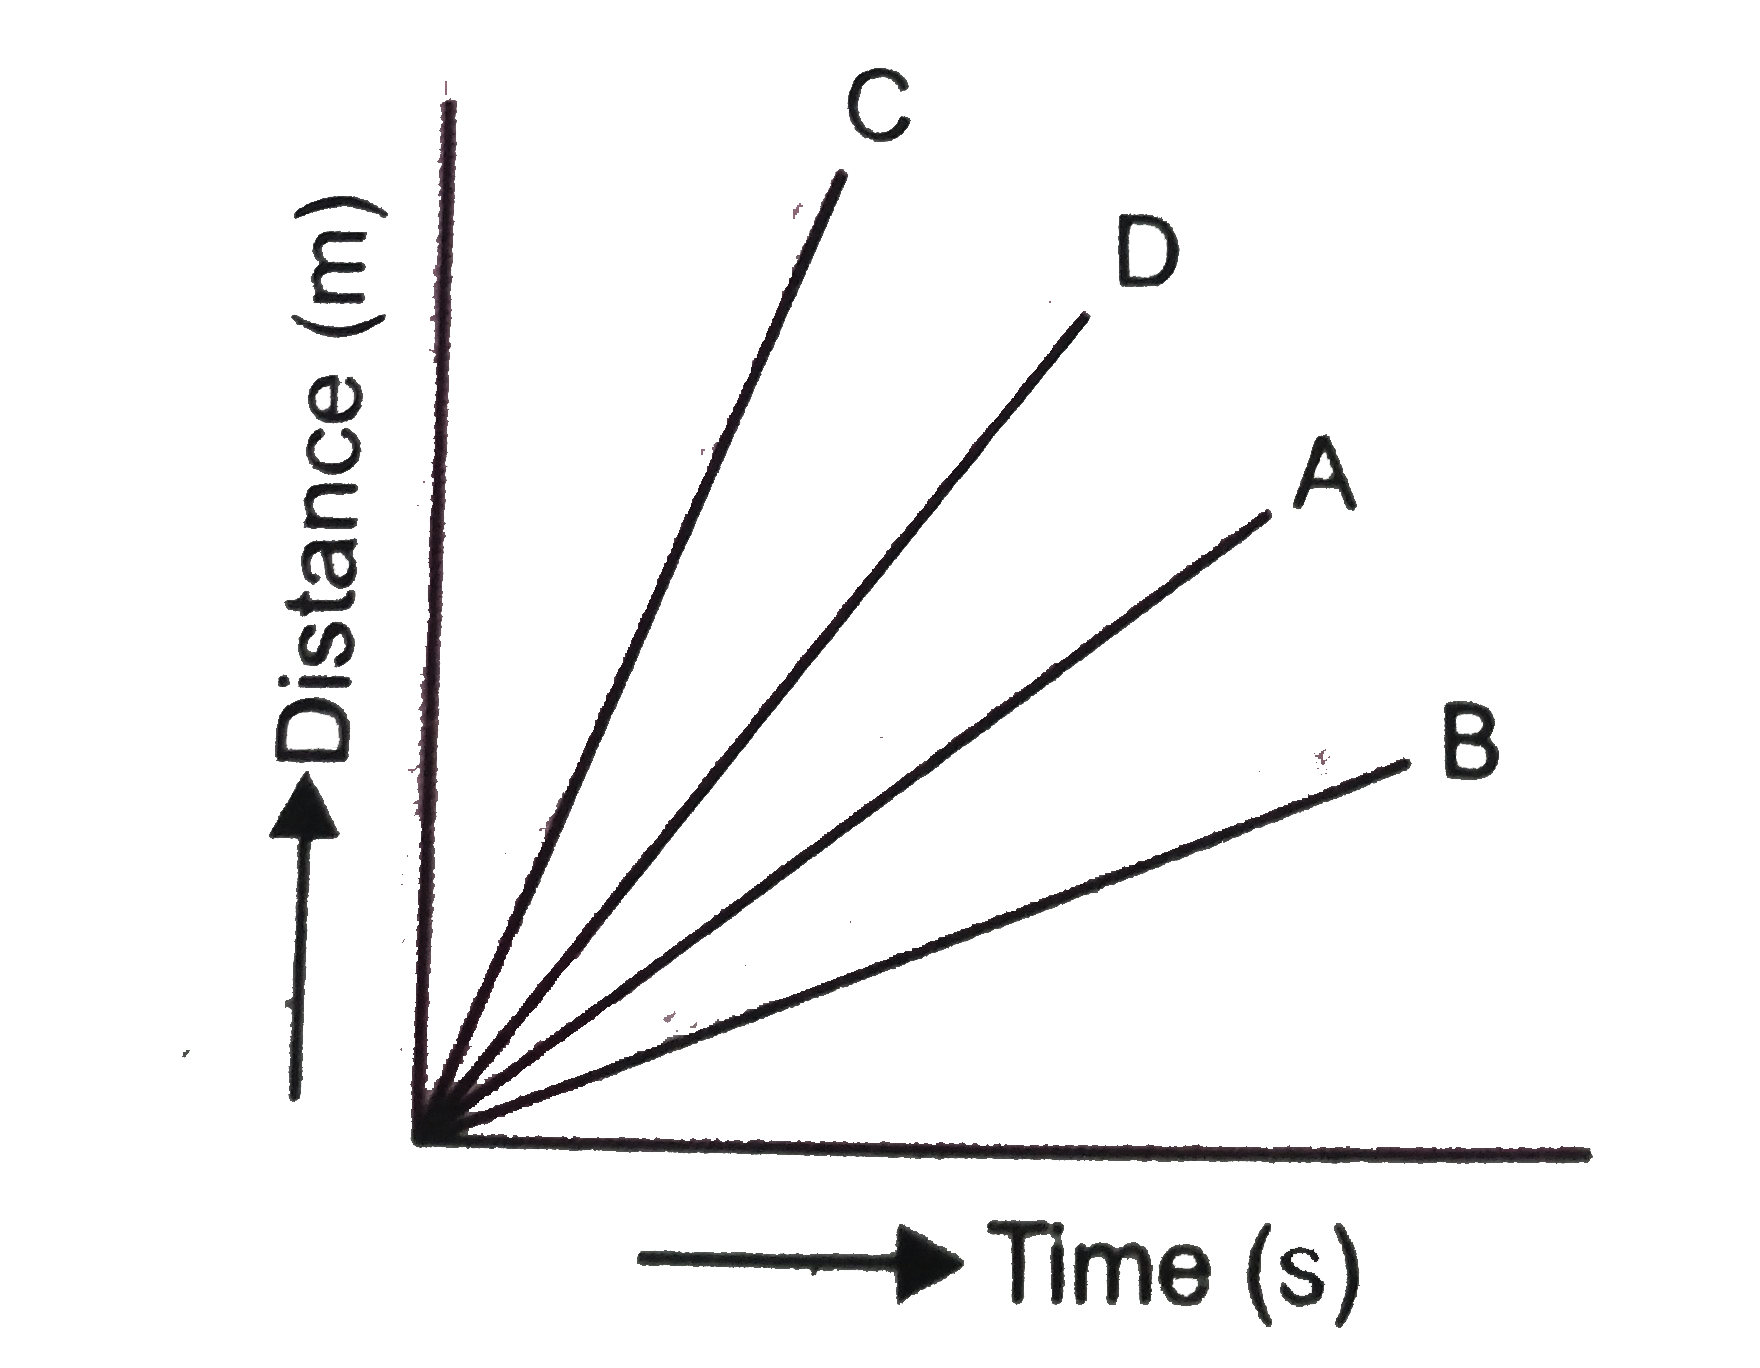
View SolutionFour cars A,B and C are moving on a levelled road. Their distance versus time graphs are shown in Fig. Choose the correct statement
View Solution