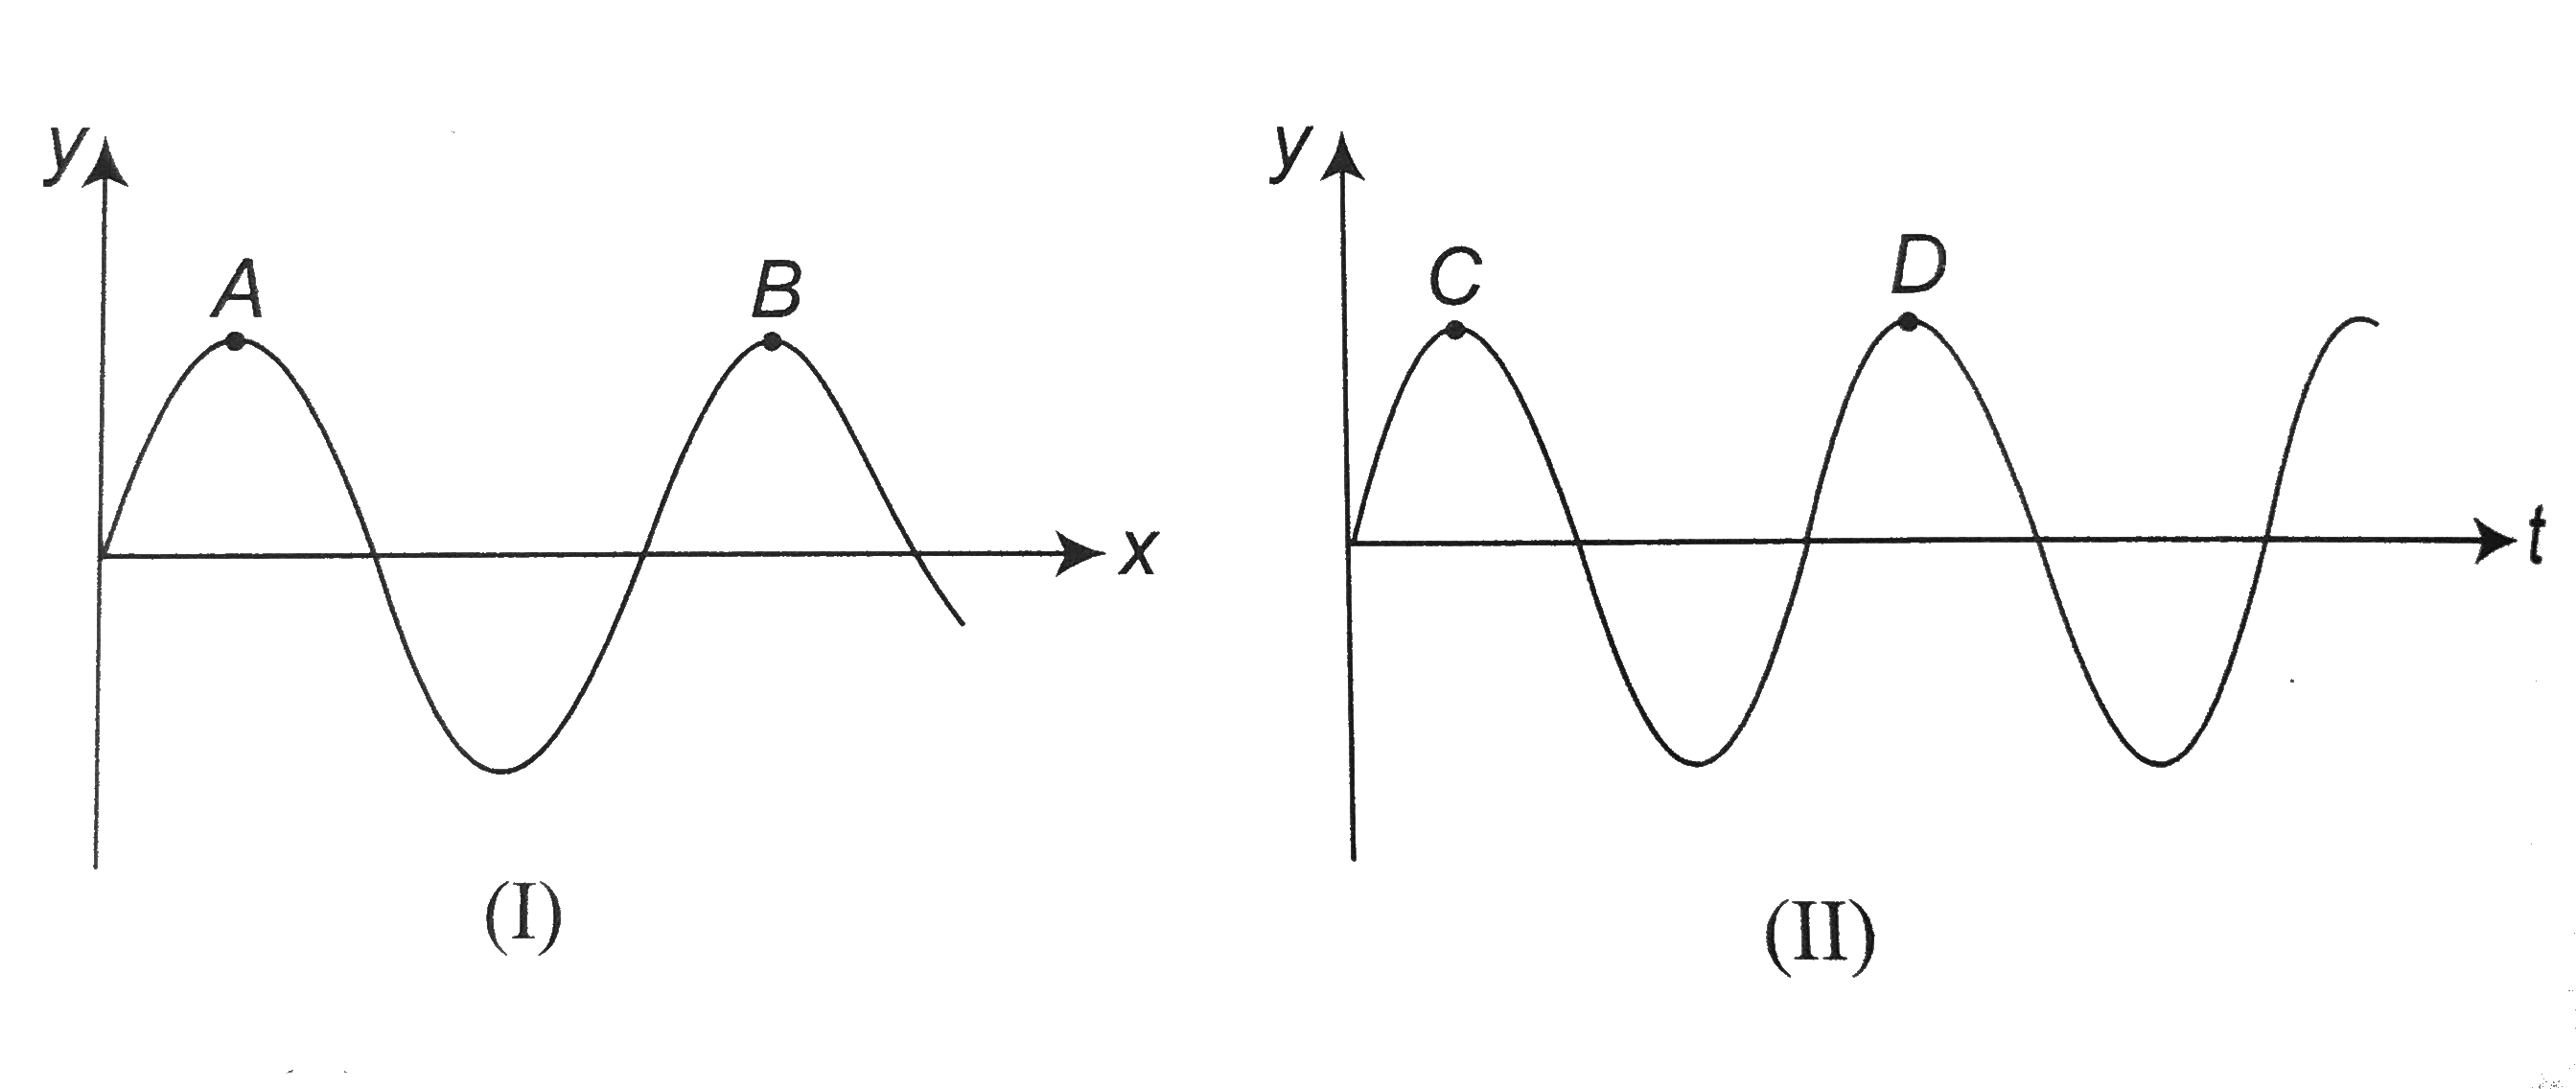
The same progressive wave is represented by two graphs I and II. Graph I shows how the displacement y varies with the distance x along the wave at a given time. Graph II shows how y varies with time t at a given point on the wave. The ratio of measurements AB to CD, marked on the curves represents:
wave number k
wave speed v
frequency v
angular frequency ω
The correct Answer is:B
AB=λ
CD=T
ABCD=λT=fλ=v i.e., wave speed
Topper's Solved these Questions
- WAVES AND ACOUSTICSBook:A2ZChapter:WAVES AND ACOUSTICSExercise:Equation And Energy Of Progressive Wave
Explore 16 Videos
- WAVES AND ACOUSTICSBook:A2ZChapter:WAVES AND ACOUSTICSExercise:Superposition And Interference
Explore 23 Videos
- VECTORSBook:A2ZChapter:VECTORSExercise:Chapter Test
Explore 29 Videos
- WORK, ENERGY, POWER AND COLLISIONBook:A2ZChapter:WORK, ENERGY, POWER AND COLLISIONExercise:Chapter Test
Explore 29 Videos
Similar Questions
The displacement of a progressive wave is represented by y=Asin(ωt−kx), where x is distance and t is time. Write the dimensional formula of (i) omega and (ii) k.
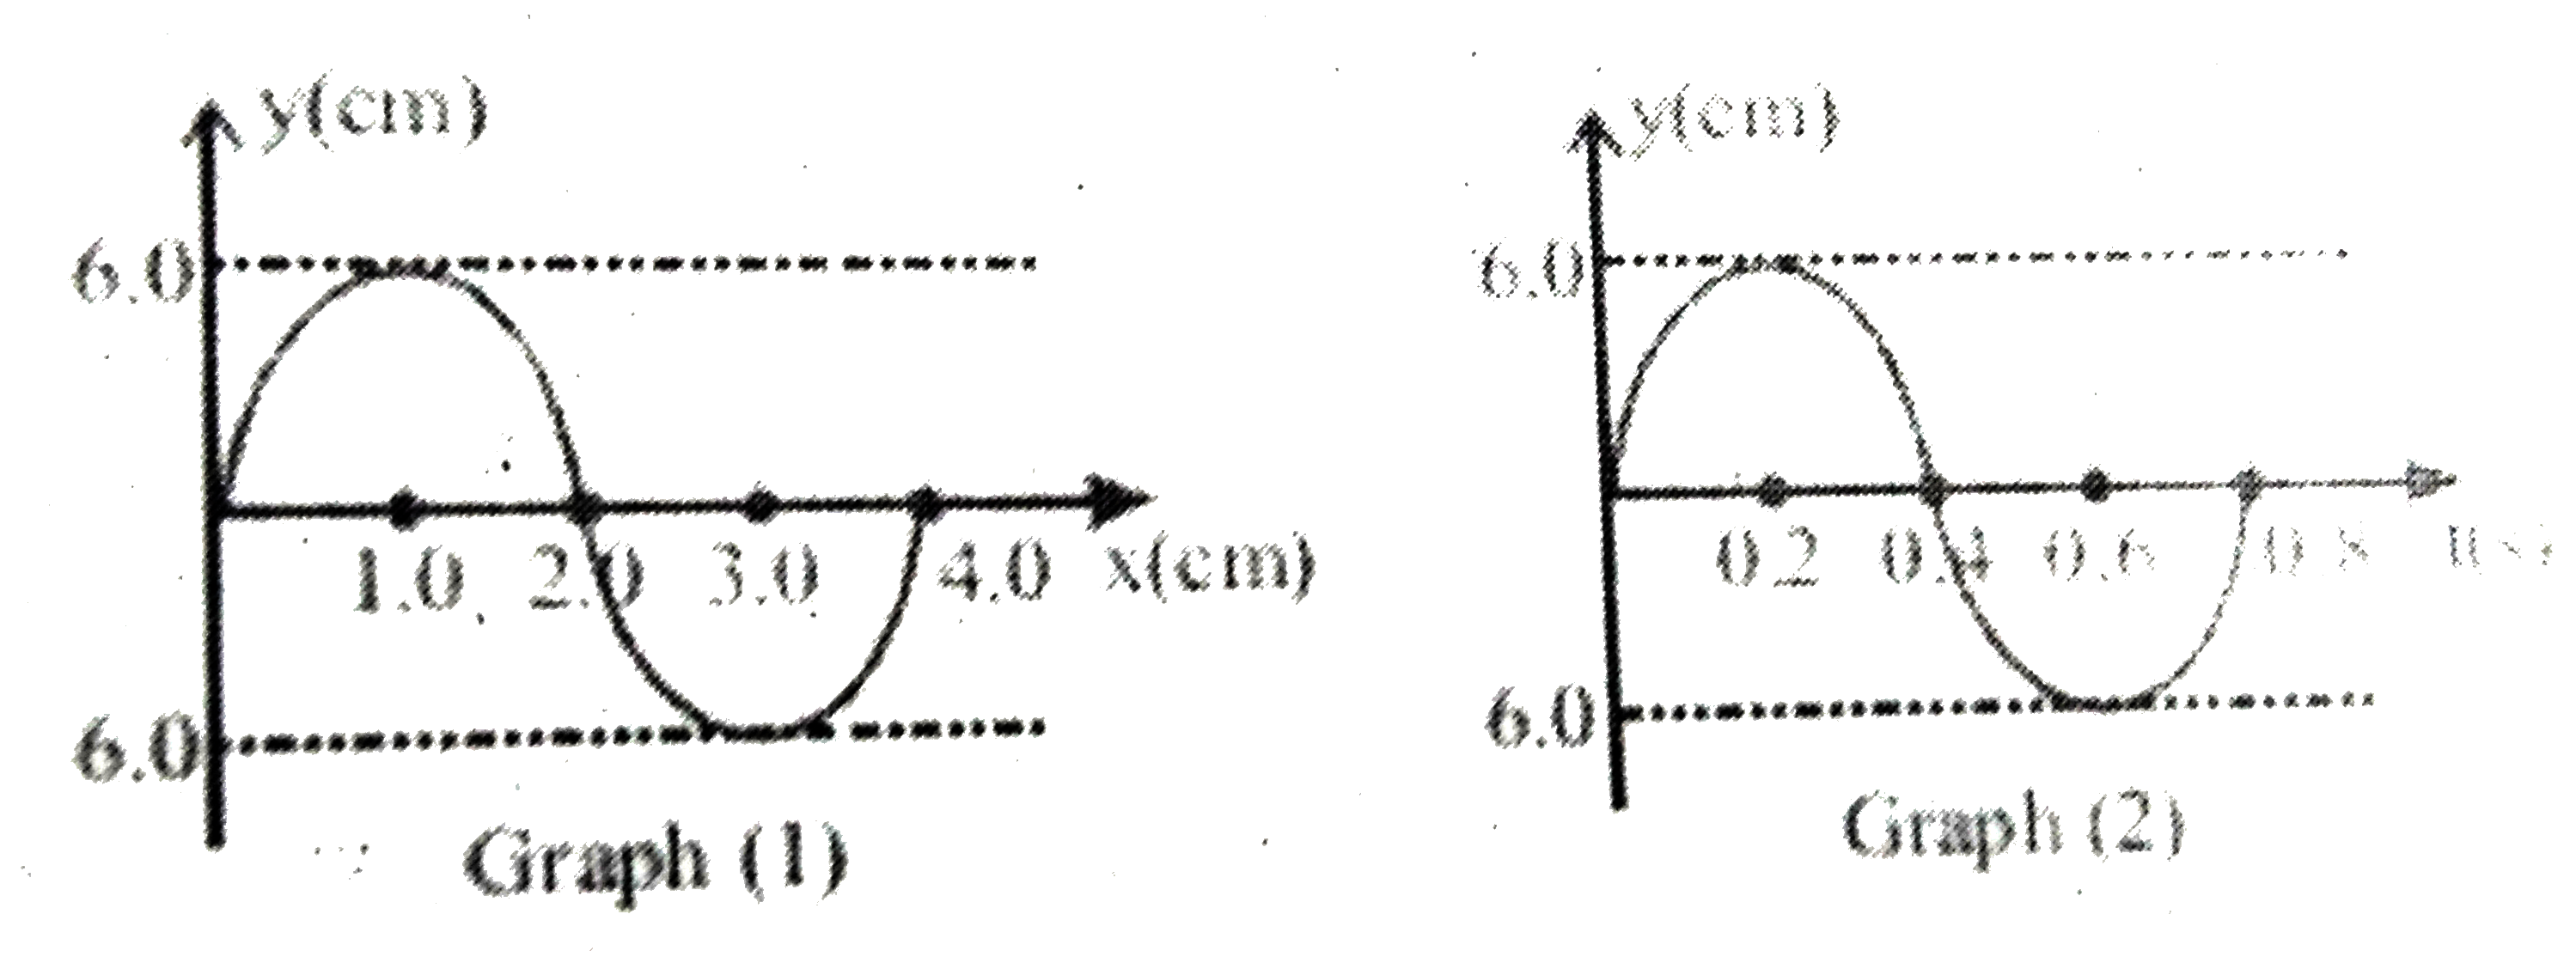
View Solutiongraphs of the same harmonic wave are shown below. The graph (1) on the left shows the displacement of wave y, as a function of position x for a given instant of time. The graph (2) on the right shows the displacement of wave as a function to time 't' for a given position. The speed of the wave is
View Solution
Knowledge Check
the same progressive wave is reprsented by two group I and II. Graoup I shows how the displacement 'y' varies with the distance x along the wave at a given time. Graph II shows how y varies with time t at a given point on the wave. The ratio of measurements AB to CD, marked on the curvse m repersents.
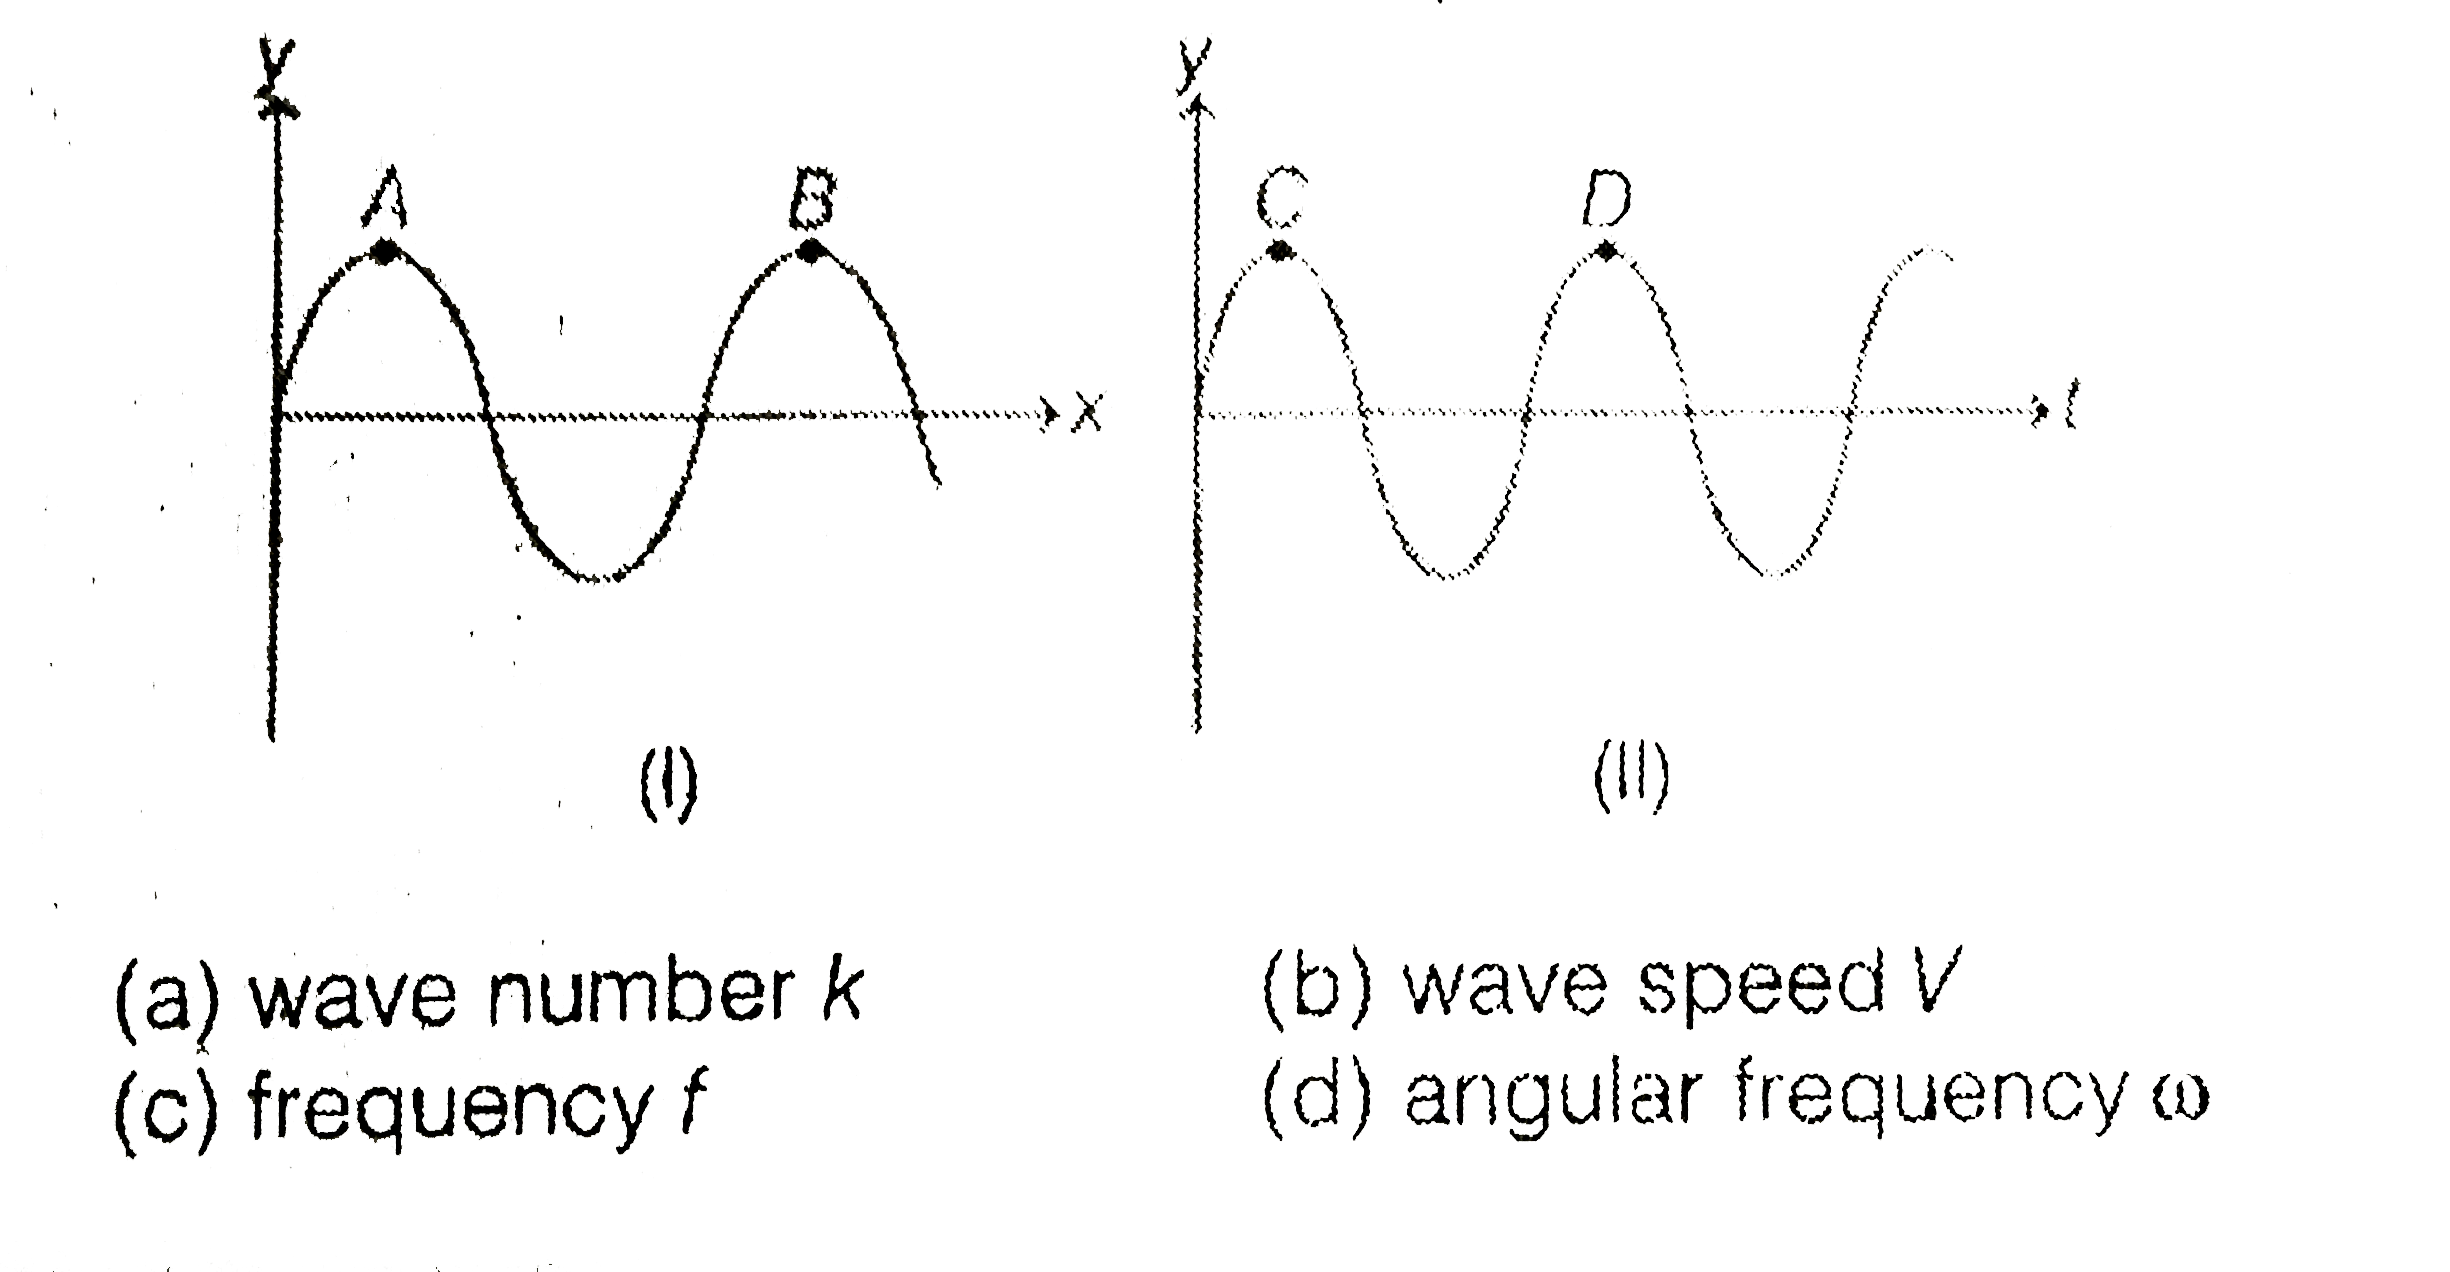 Awave number KBwave speed VCfrequecny fDangular fequecy ω
The displacement of a progressive wave is represented by y=Asin(ωt−kx) where x is distance and t is time. The dimensions of ωk are same as those of
AvelocityBwave numberCwavelengthDfrequencyA simple harmonic progressive wave is represented by y=Asin(100πt+3x).The distance between two points on the wave at a phase difference of π3 radian is
Aπ18mBπ9mCπ3mDπ6m
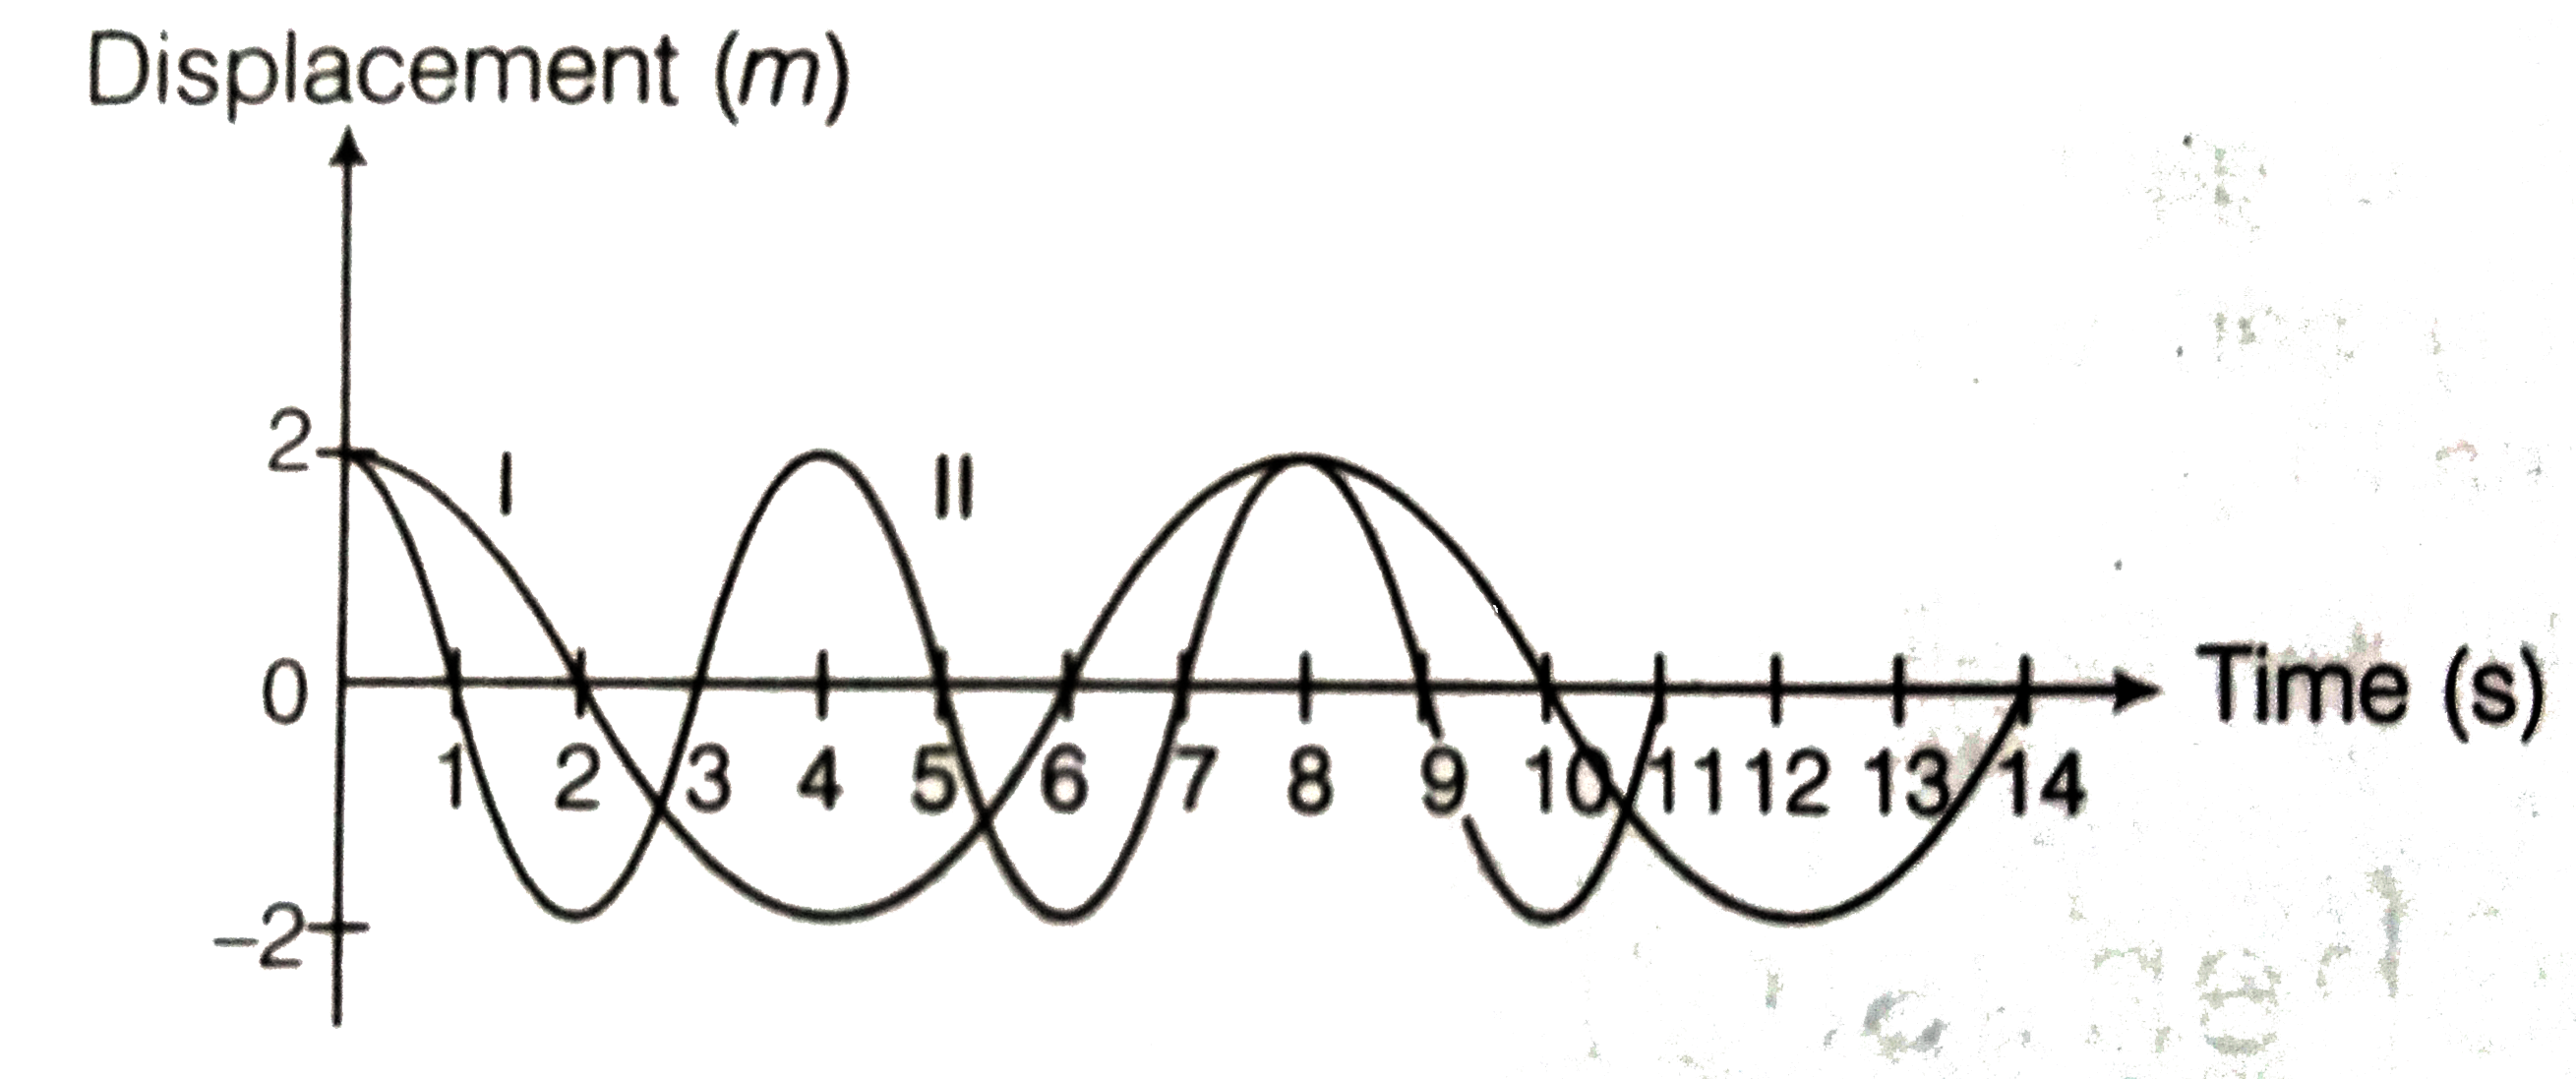
Figure shows the displacement time graphs of two simple harmonic motions I and II. From the graph it follows that
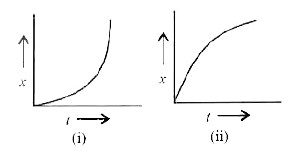
View SolutionFigure (i) and (i) show the displacement-time graphs of two particles moving along the x-axis. We can say that
View Solution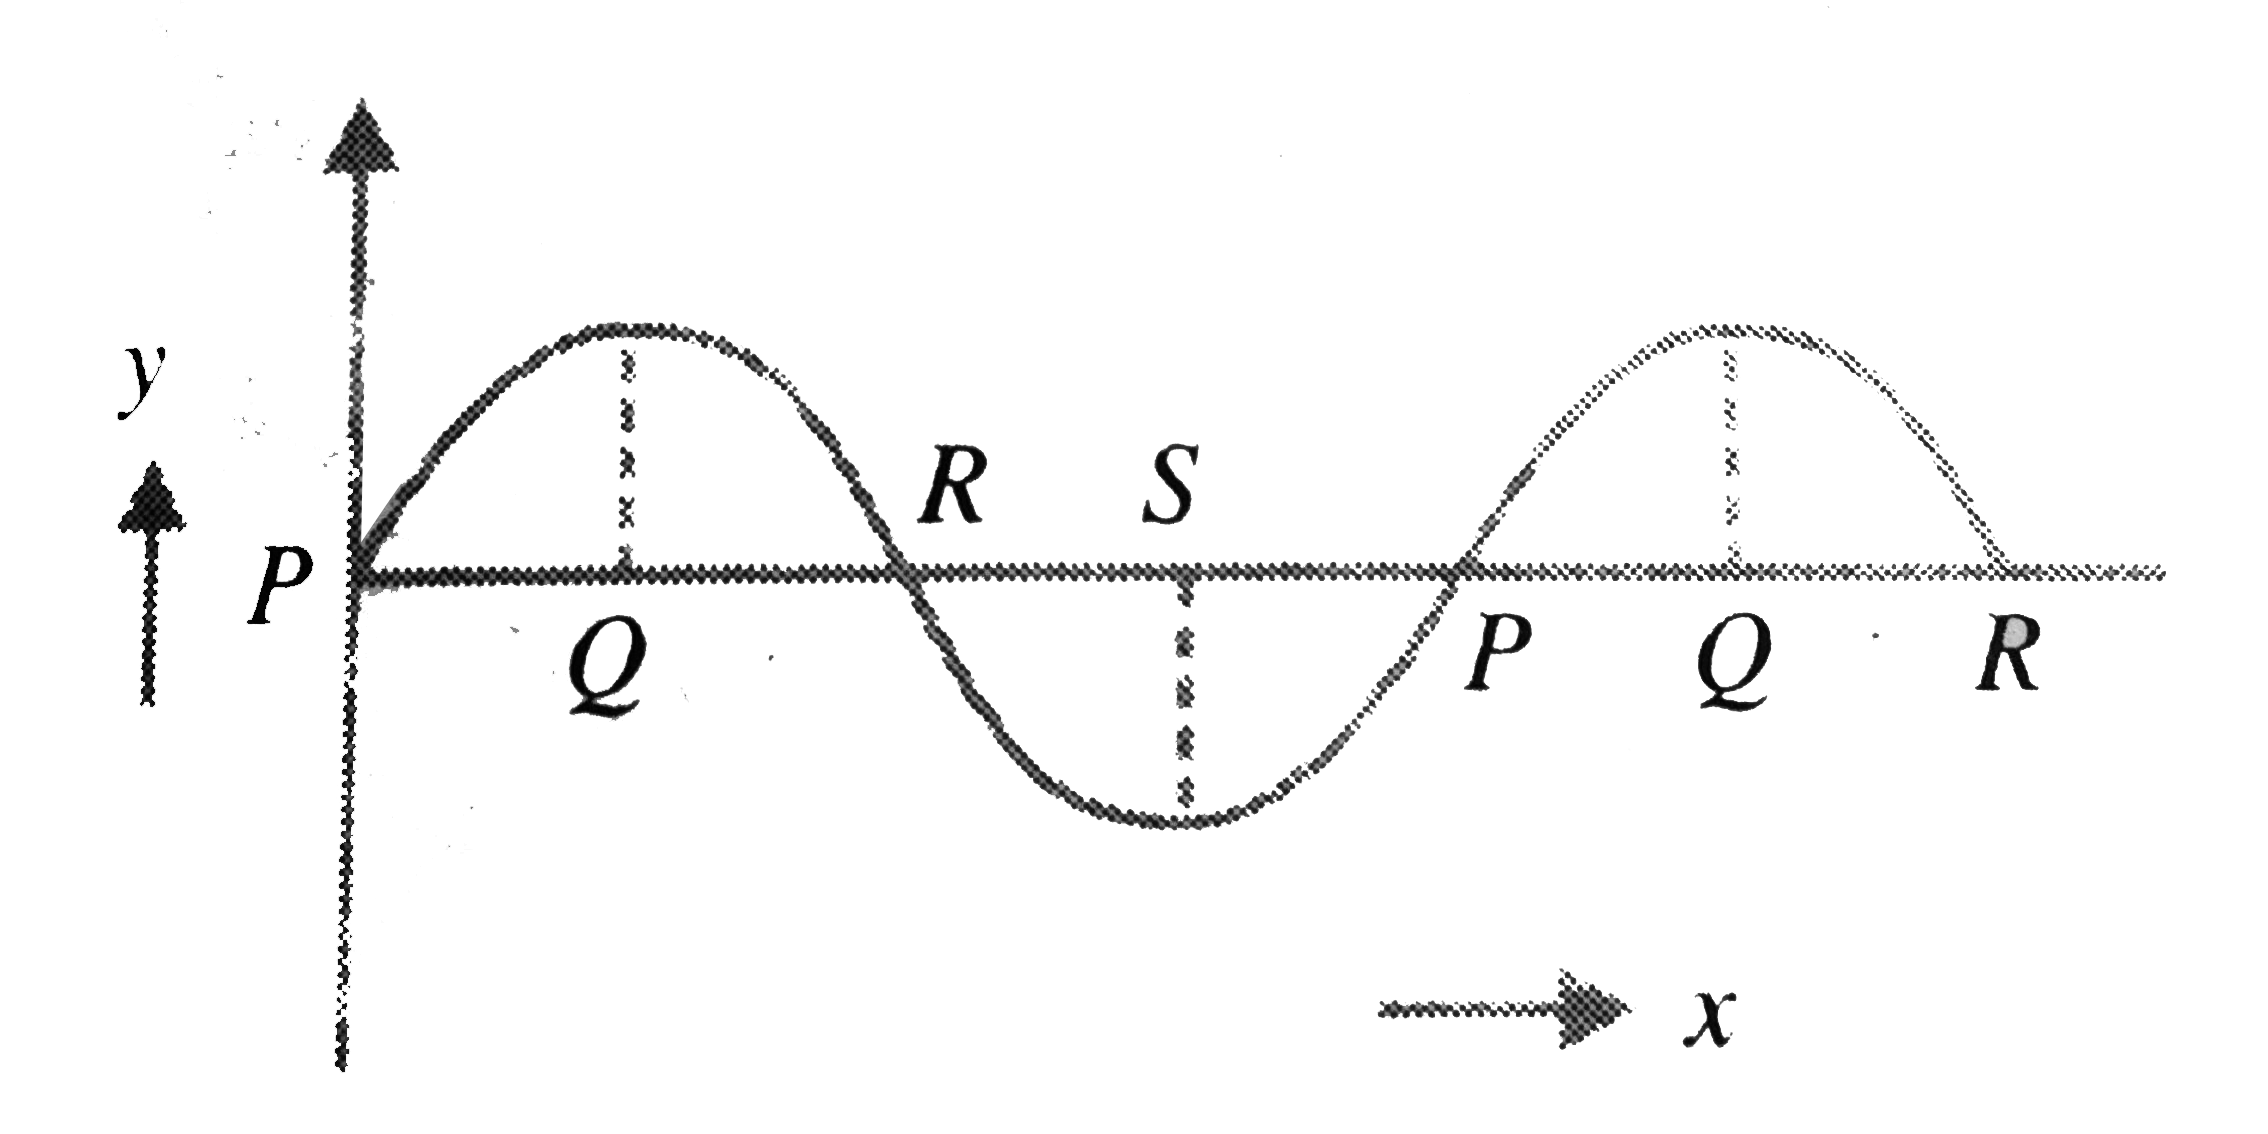
Figure. Represents the displacement y versus distance x along the direction of propagation of a longitudinal wave. The pressure is maximum at position marked
View SolutionA progressive wave is represented by y=12sin(5t−4x) cm. On this wave, how far away are the two points having phase difference of 90∘ ?
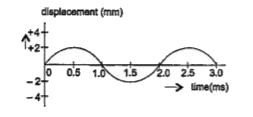
View SolutionThe figure shows displacement time graph of a wave. The frequency of this wave is displacement (mm)
View Solution

