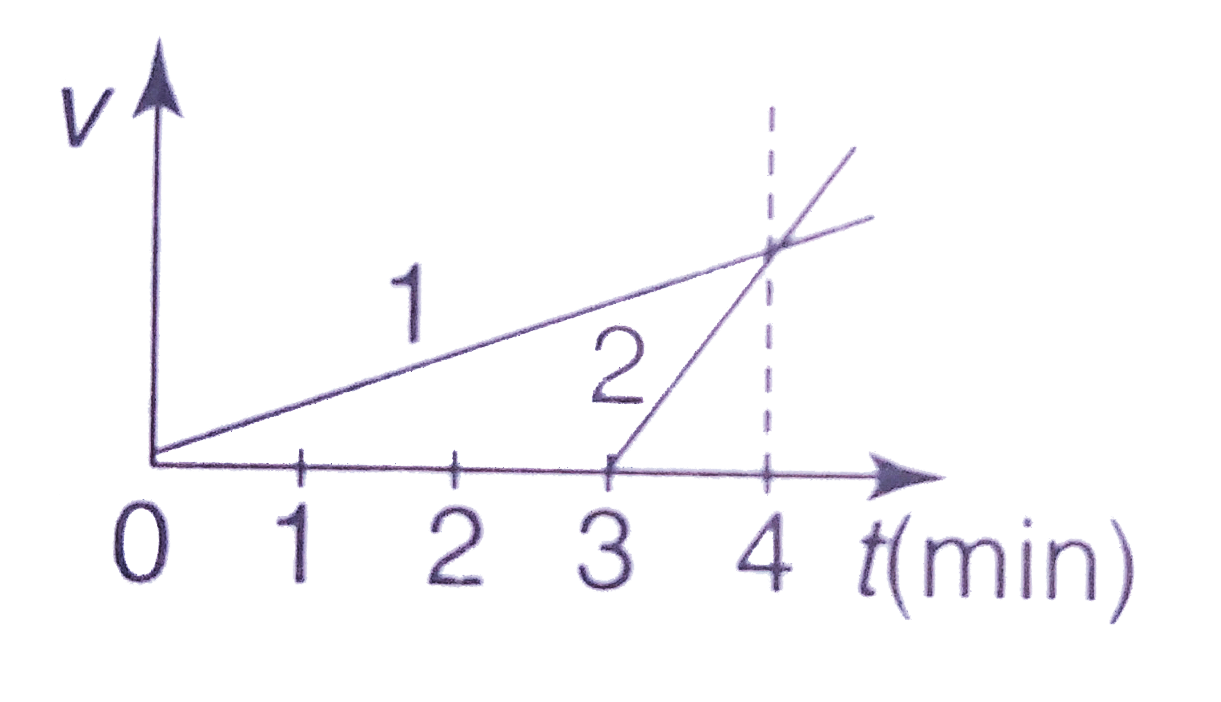
The drawing shows velocity (v) versus time (t) graphs for two cyclists moving along the same straight segment of a highway from the same point. The second cyclist starts moving at . At what time do the two cysclist meet ?
4 min
6 min
8 min
12 min
The correct Answer is:B
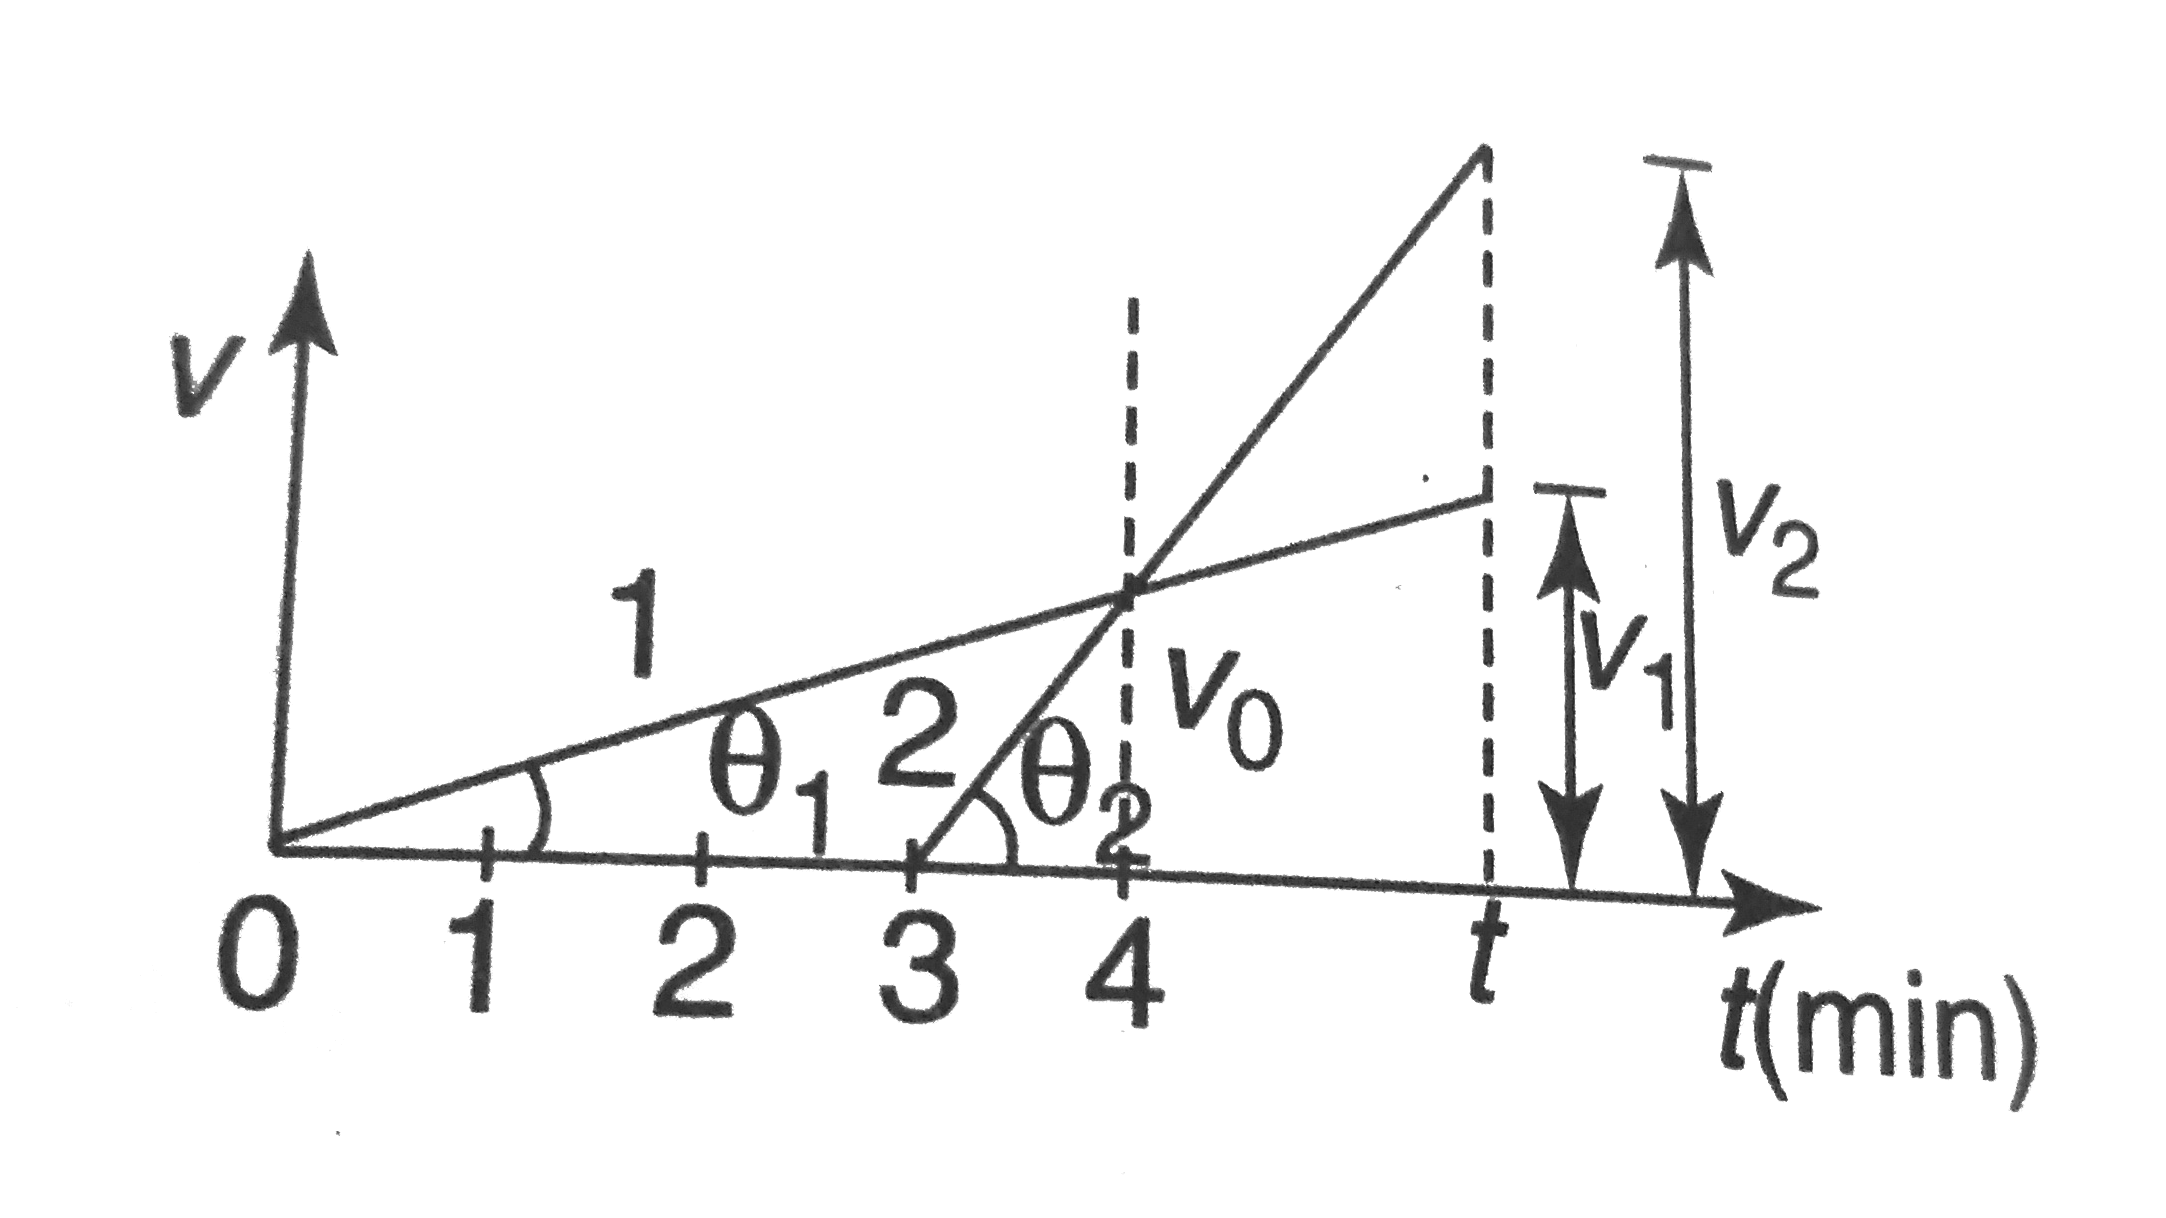
Let they meet at time , then their displacement should be same. It means area under graph should be same.
.
Topper's Solved these Questions
- GENERAL KINEMATICS AND MOTION IN ONE DIMENSIONBook:A2ZChapter:GENERAL KINEMATICS AND MOTION IN ONE DIMENSIONExercise:Assertion Reasoning
Explore 20 Videos
- GENERAL KINEMATICS AND MOTION IN ONE DIMENSIONBook:A2ZChapter:GENERAL KINEMATICS AND MOTION IN ONE DIMENSIONExercise:NEET Questions
Explore 37 Videos
- GENERAL KINEMATICS AND MOTION IN ONE DIMENSIONBook:A2ZChapter:GENERAL KINEMATICS AND MOTION IN ONE DIMENSIONExercise:Understanding Motion Through Graphs
Explore 40 Videos
- FLUID MECHANICSBook:A2ZChapter:FLUID MECHANICSExercise:Chapter Test
Explore 29 Videos
- GRAVITATIONBook:A2ZChapter:GRAVITATIONExercise:Chapter Test
Explore 29 Videos
Similar Questions
Knowledge Check
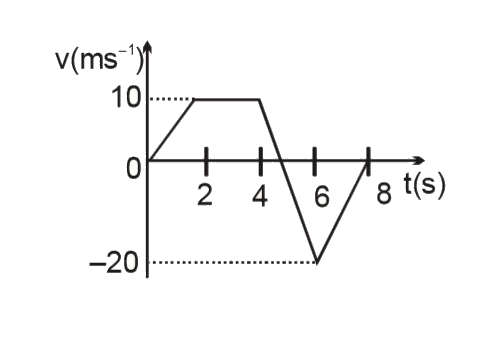
The velocity versus time graph of a body moving along a straight line is as shown in figure. The ratio of displacement and distance covered body in 5 second is :-
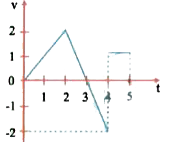 A2:3B3:5C1:1D1:5:5
The figure shows a velocity-time graph of a particle moving along a straight line
Q. If the particle starts from the position x0 = –15 m, then its position at t = 2s will beA−5mB5mC10mD15mThe figure shows a velocity-time graph of a particle moving along a straight line
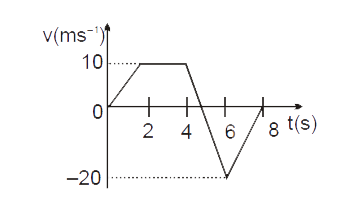
If the particle starts from the position x0=–15 m, then its position at t = 2s will beA−5mB5mC10 mD15 m
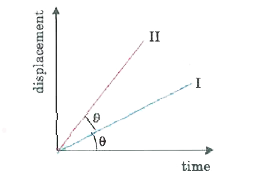
From the given displacement - time graph of two cars moving on a straight road , which of the following is moving with greater velocity ?
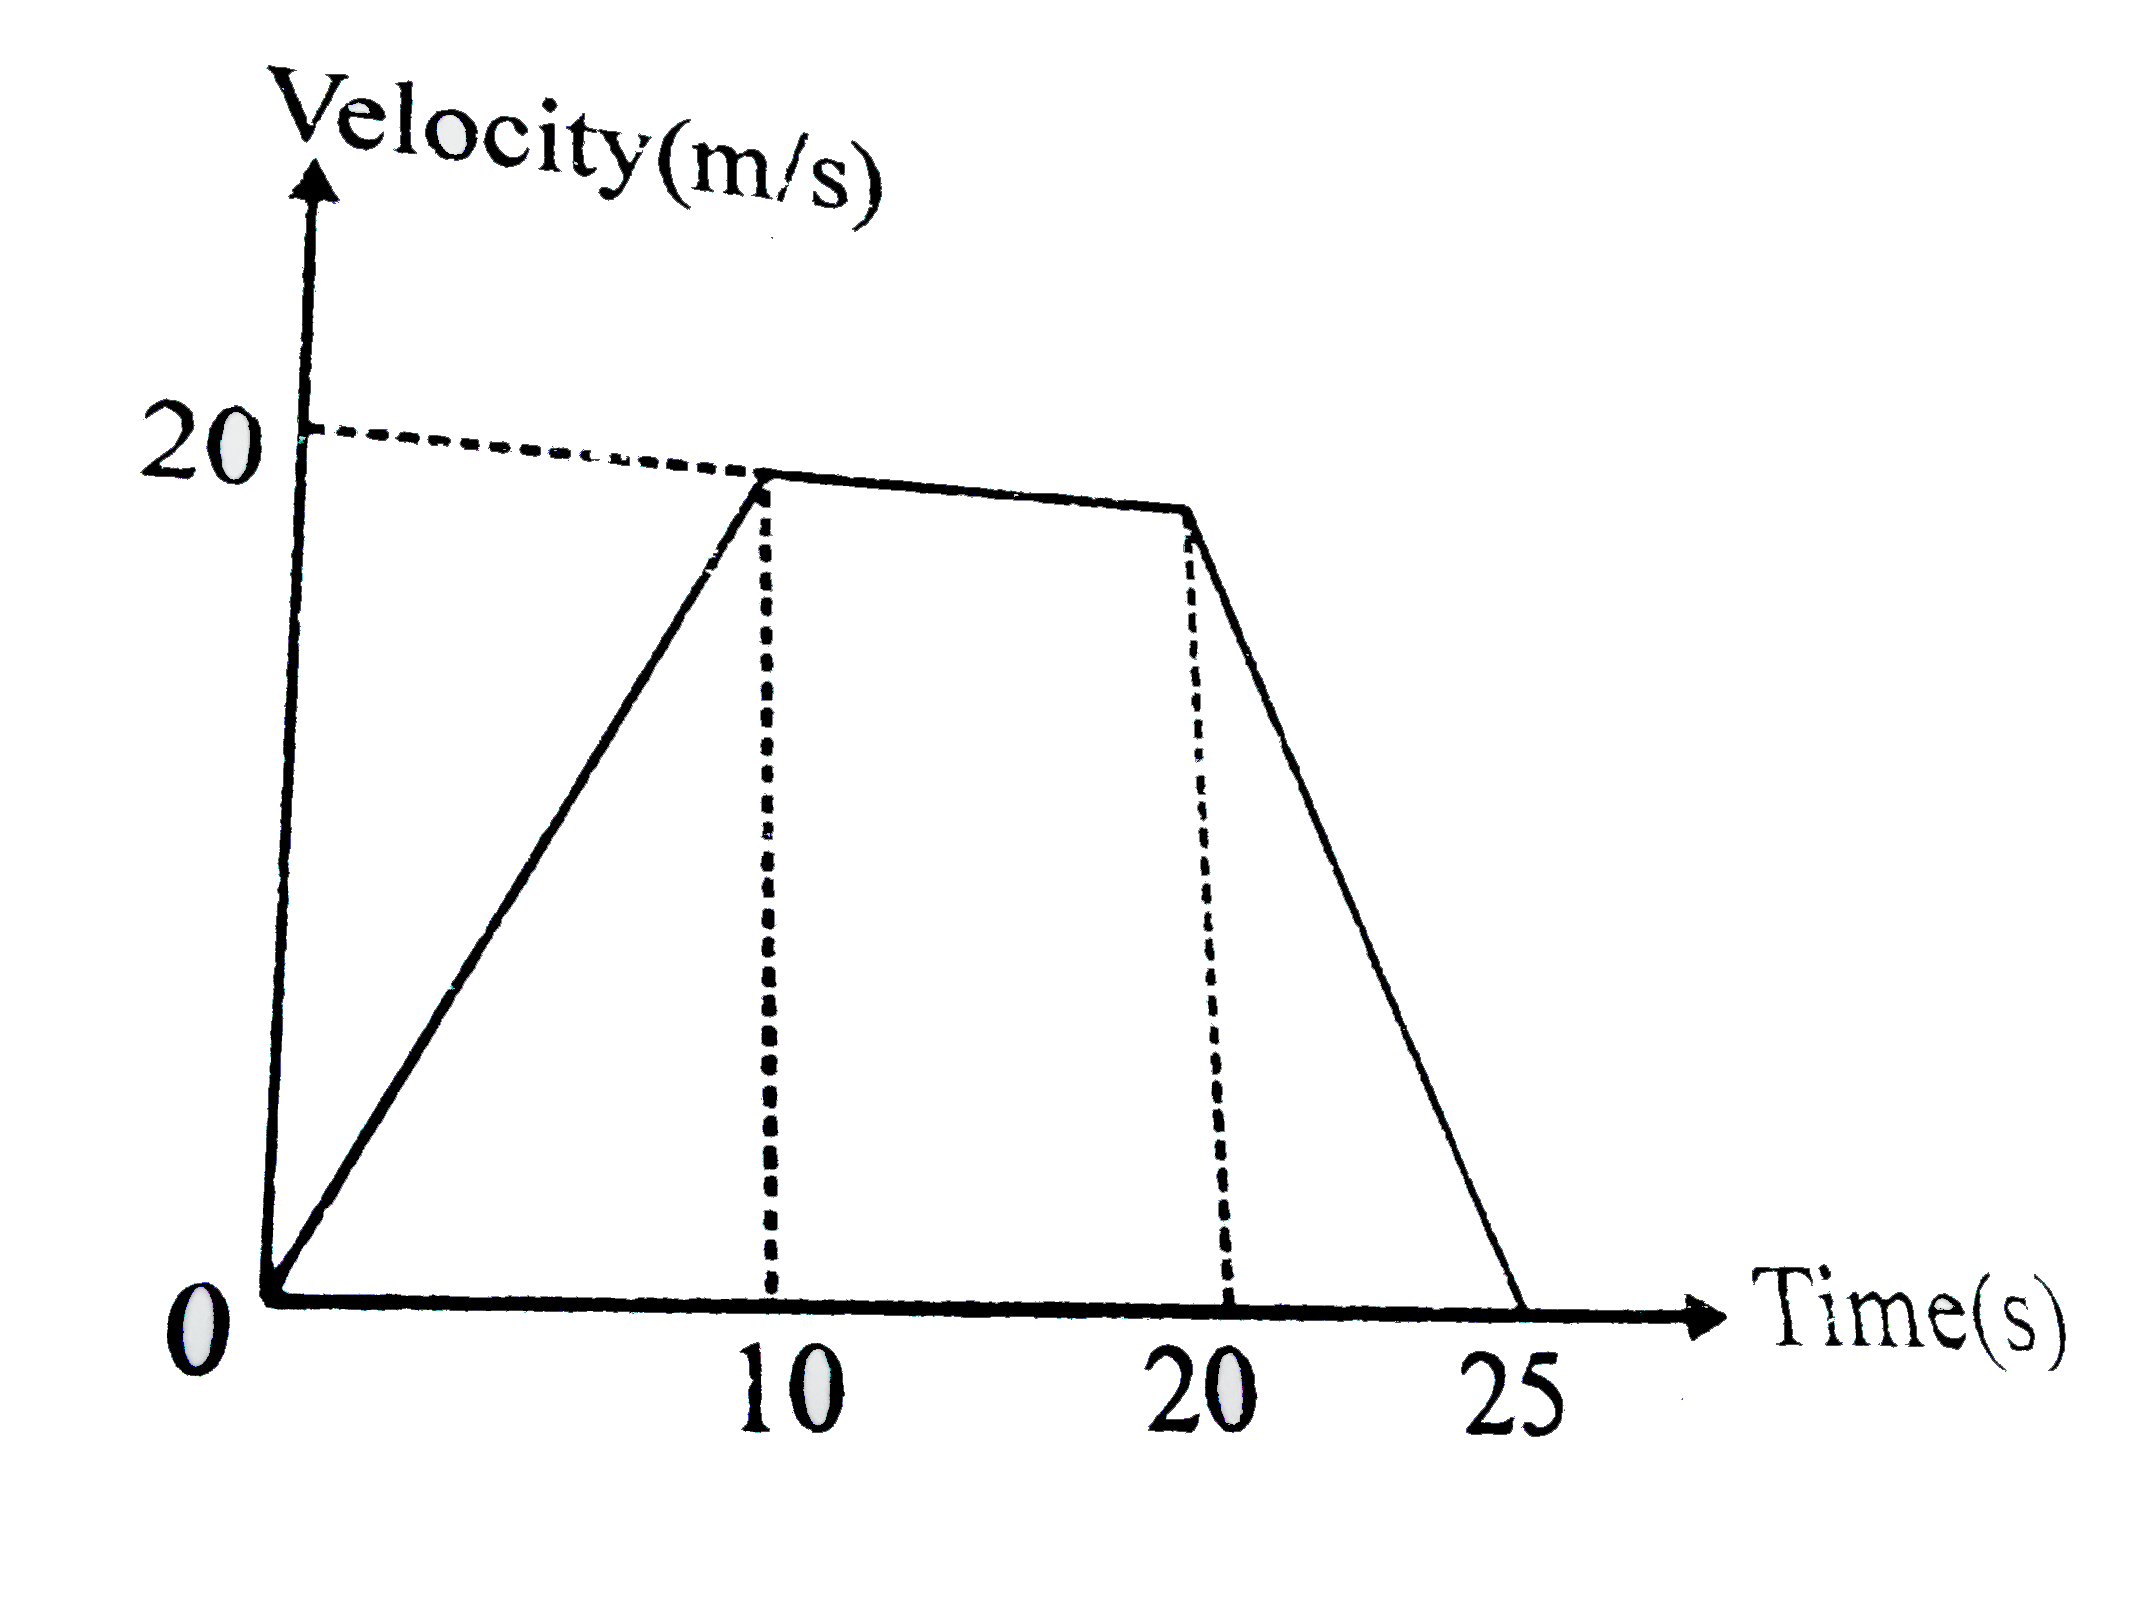
View SolutionThe velocity-time graph of a car moving along a straight road is shown in figure. The average velocity of the car in first 25 seconds is
View SolutionFigure shows the velocity time graph of a particle moving along straight line (v is m/s and t is in second). It average velocity in 20 seconds will be:
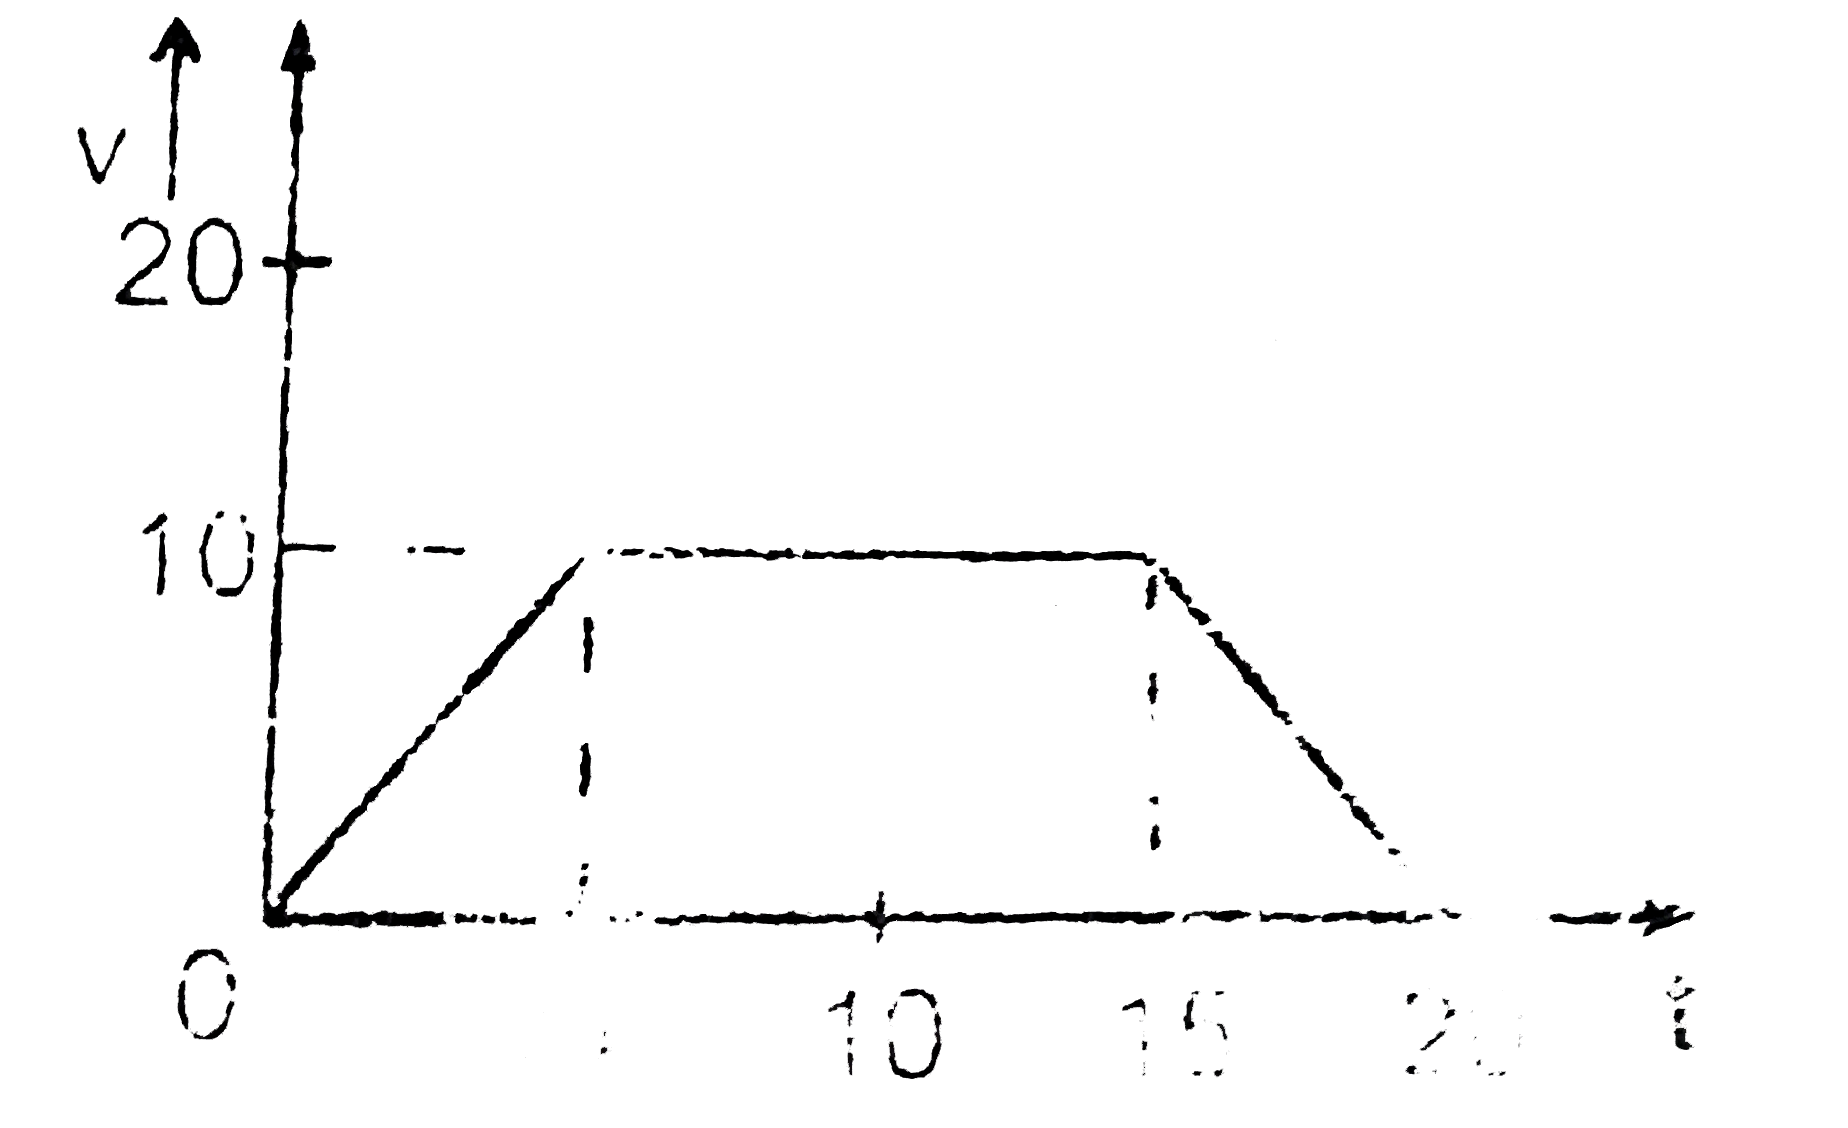 .
.
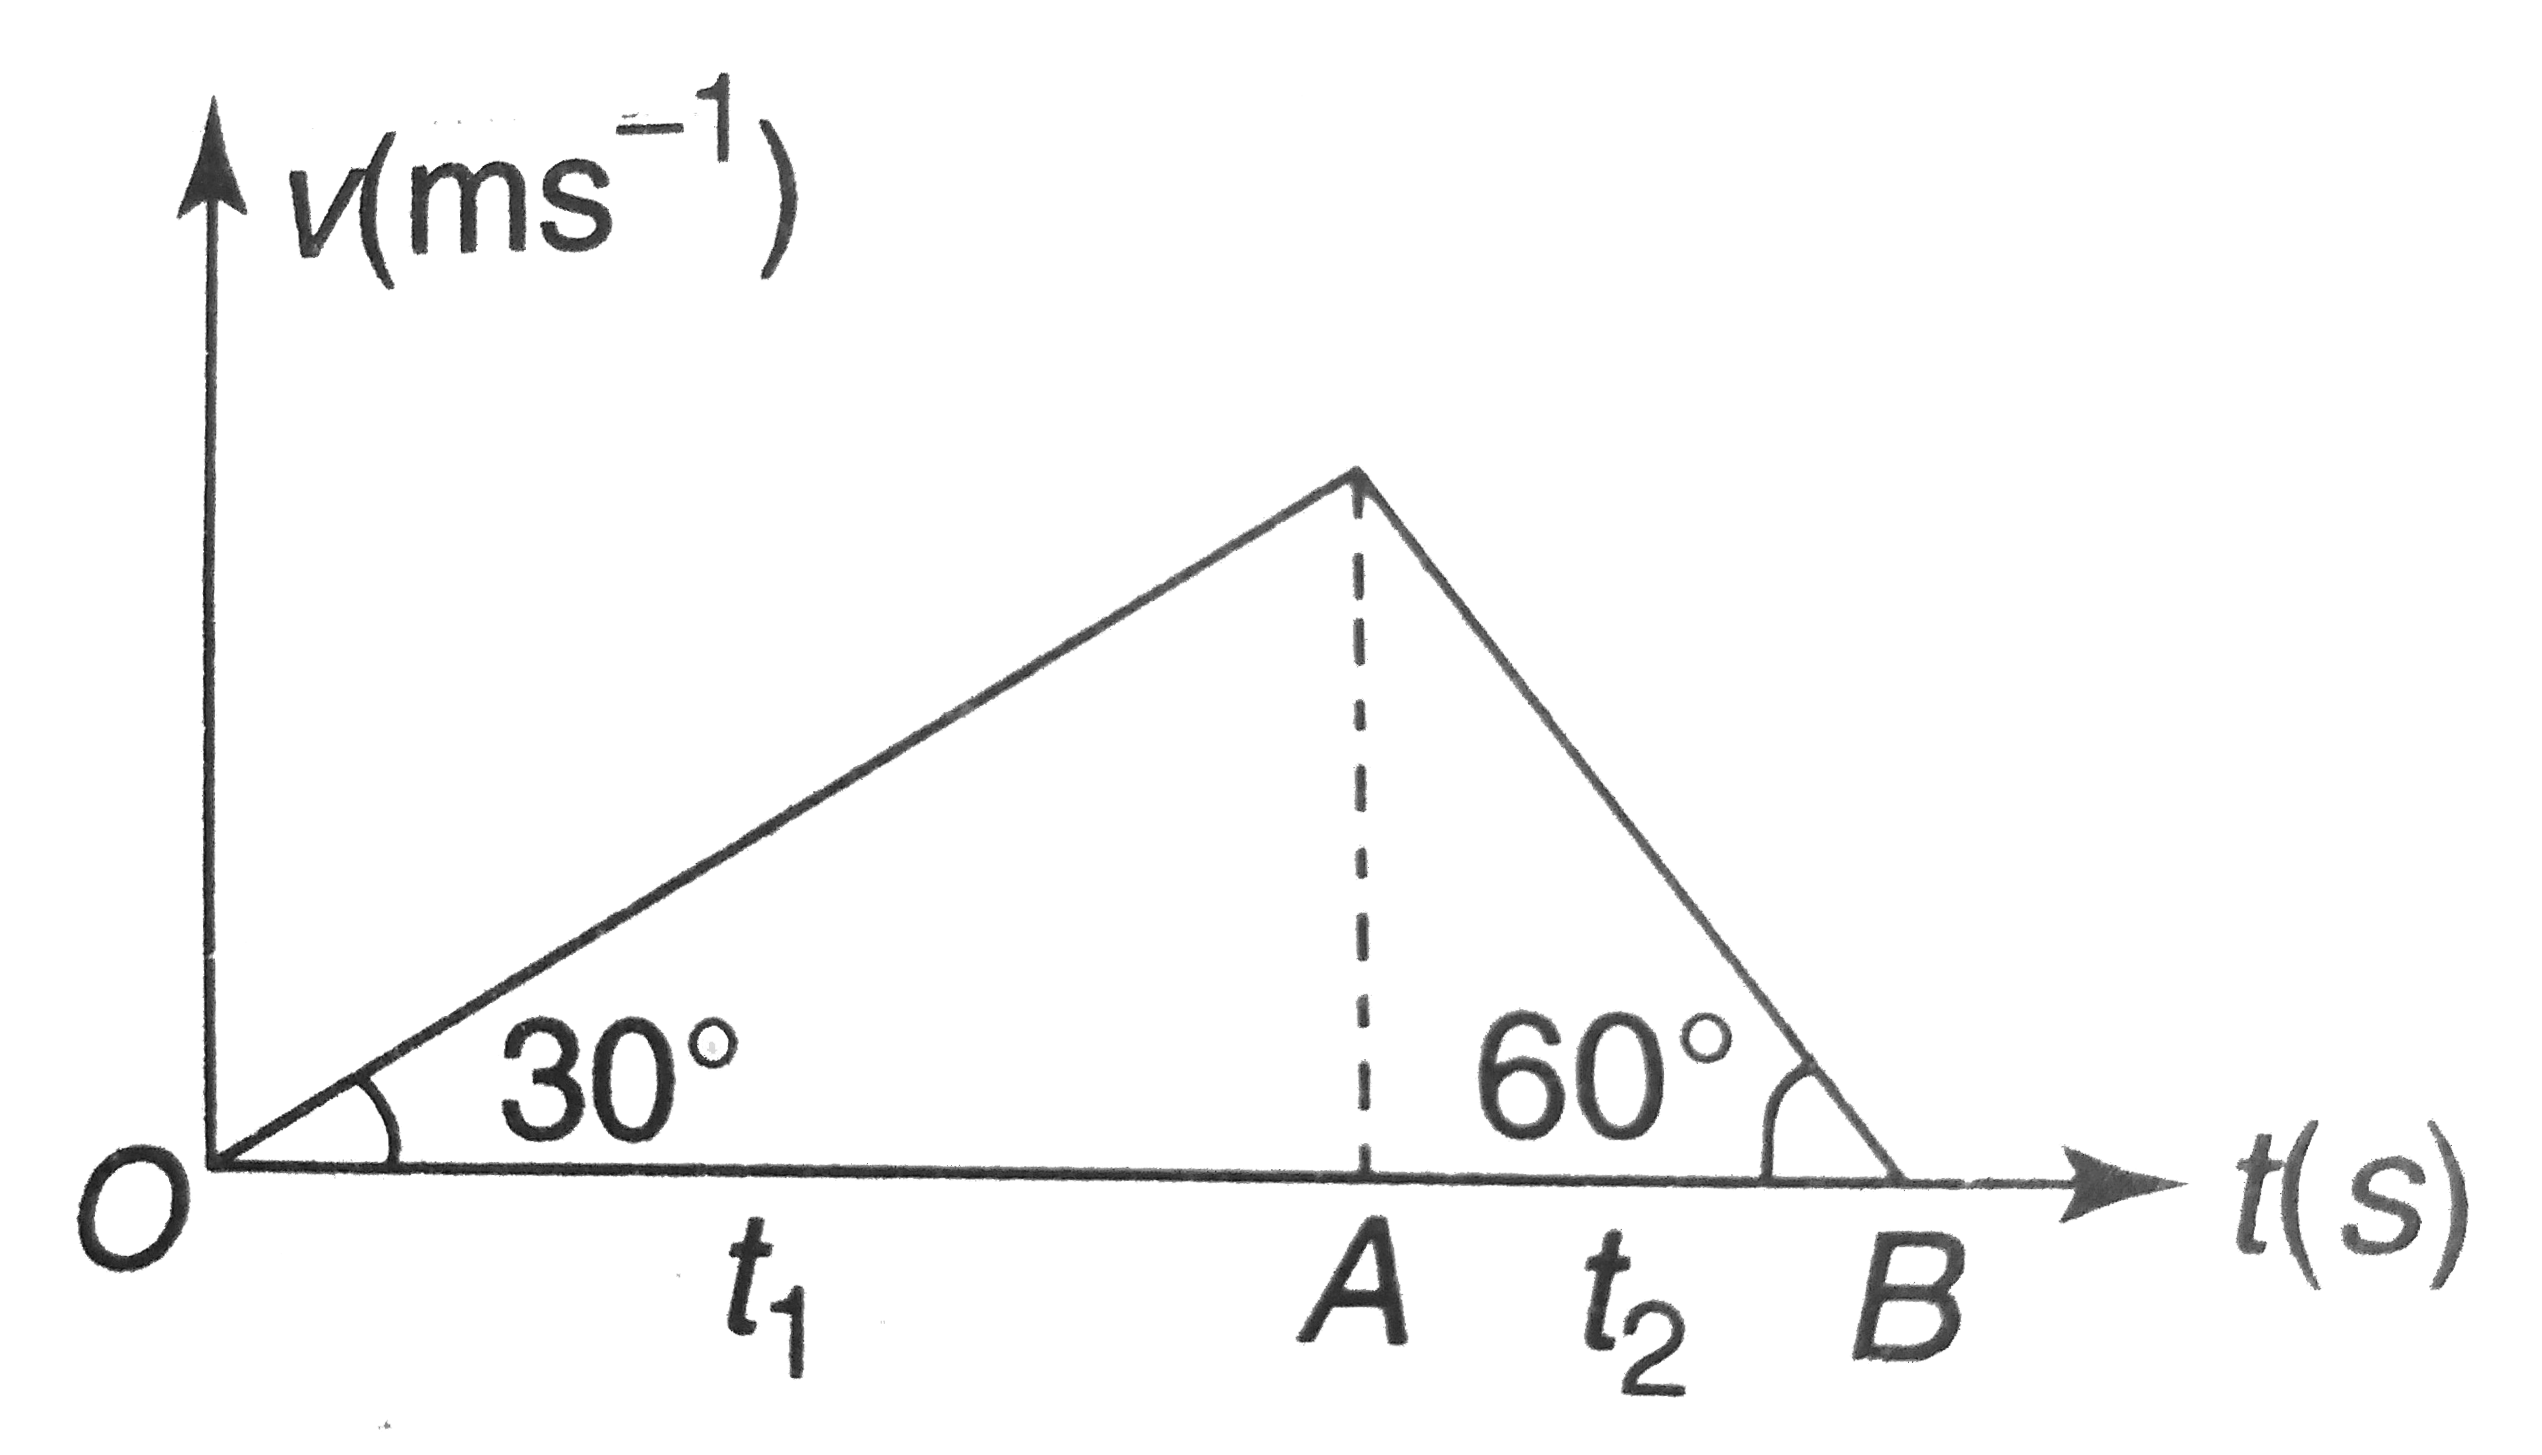
View SolutionThe velocity time graph of a body moving along a straight line is shown in figure. The ratio of the average velocities during the time t1 and t2 is.
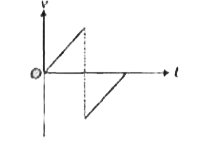
View SolutionThe velocity (v) - time (t) graph for a particle moving along x - axis is shown in the figure. The corresponding position (x) - time (t) is best represented by
View Solution


