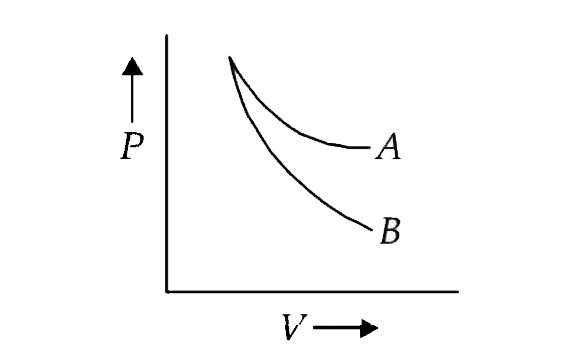
The curves A and B in the figure shown P-V graphs for an isothermal and an adiabatic process for an idea gas. The isothermal process is represented by the curve A.

Video Solution
Text Solution
The slope of p−V curve is more for adiabatic process than for isothermal process. From the graph it is clear that slope for B is greater than the slope for A .
|
Topper's Solved these Questions
- ARCHIVES 1 VOLUME 6Book:CENGAGE PHYSICSChapter:ARCHIVES 1 VOLUME 6Exercise:Single Correct
Explore 54 Videos
- ARCHIVES 1 VOLUME 6Book:CENGAGE PHYSICSChapter:ARCHIVES 1 VOLUME 6Exercise:Multi Correct
Explore 13 Videos
- ARCHIVES 1 VOLUME 6Book:CENGAGE PHYSICSChapter:ARCHIVES 1 VOLUME 6Exercise:Integer
Explore 4 Videos
- ARCHIVES 2 VOLUME 6Book:CENGAGE PHYSICSChapter:ARCHIVES 2 VOLUME 6Exercise:Integer
Explore 4 Videos
Similar Questions
Knowledge Check
For an ideal gas, in an isothermal process
AHeat content remains constantBHeat content and temperature remain constantCTemperature remains constantDNone of the aboveIn an isothermal process for an ideal gas
AΔQ=0BΔW=0CΔU=0DΔV=0In an isothermal process for an ideal gas
AΔQ=0BΔW=0CΔU=0DΔV=0

