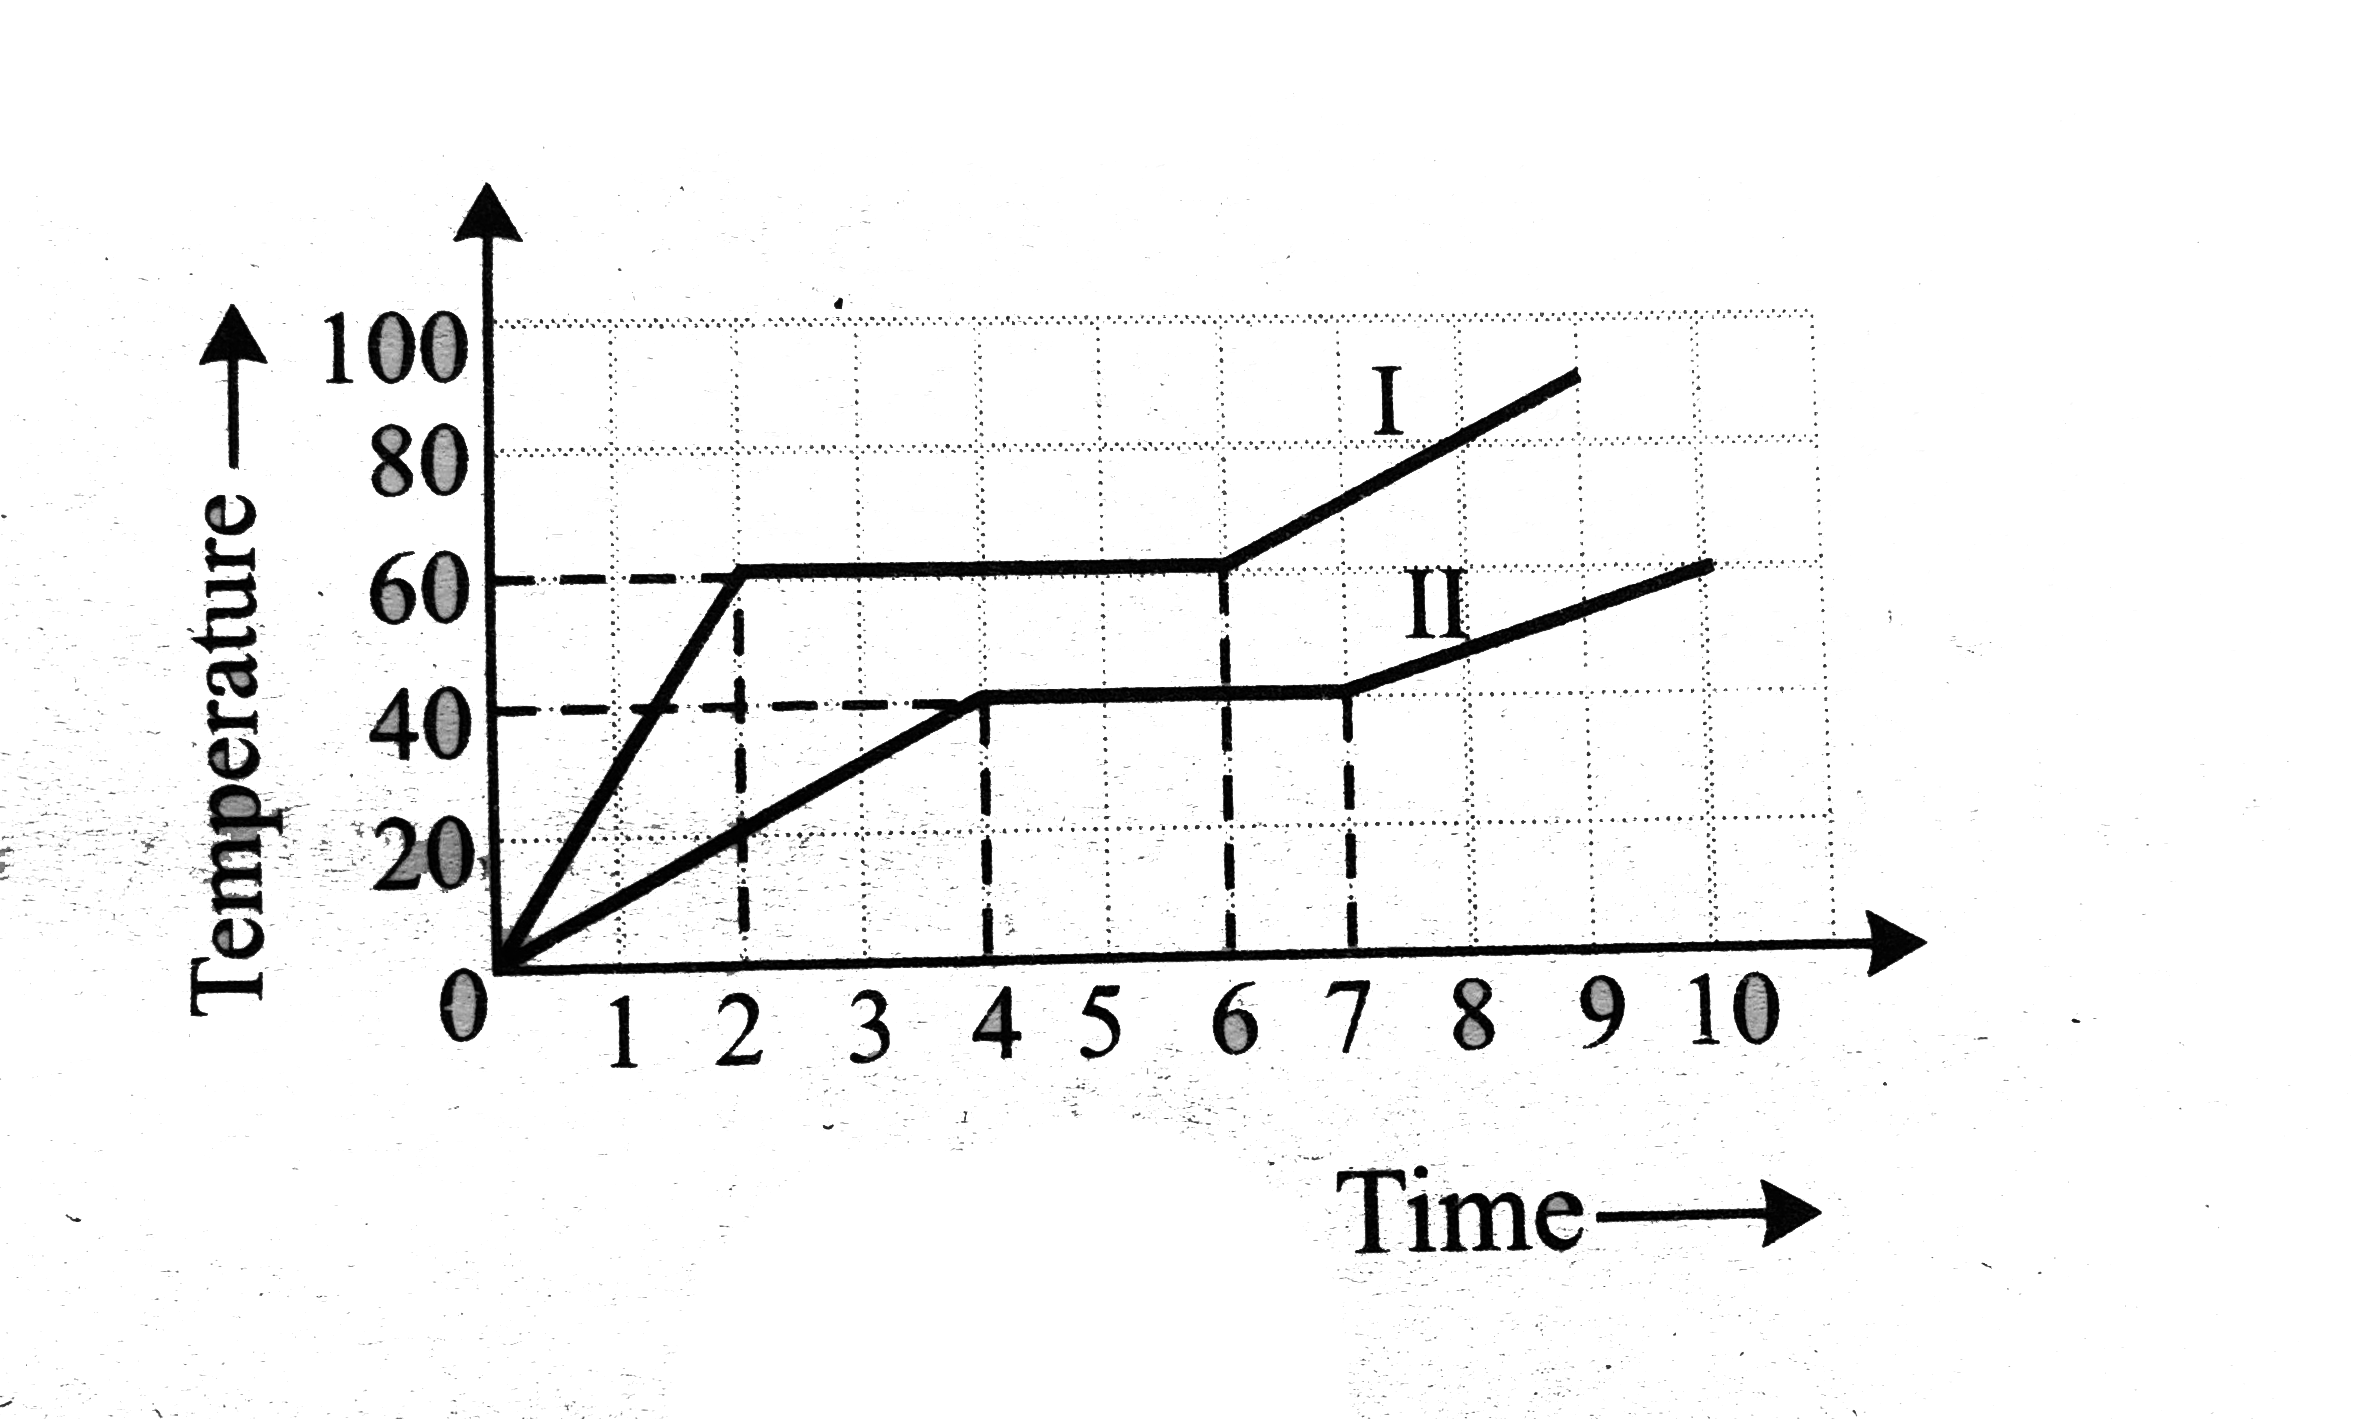
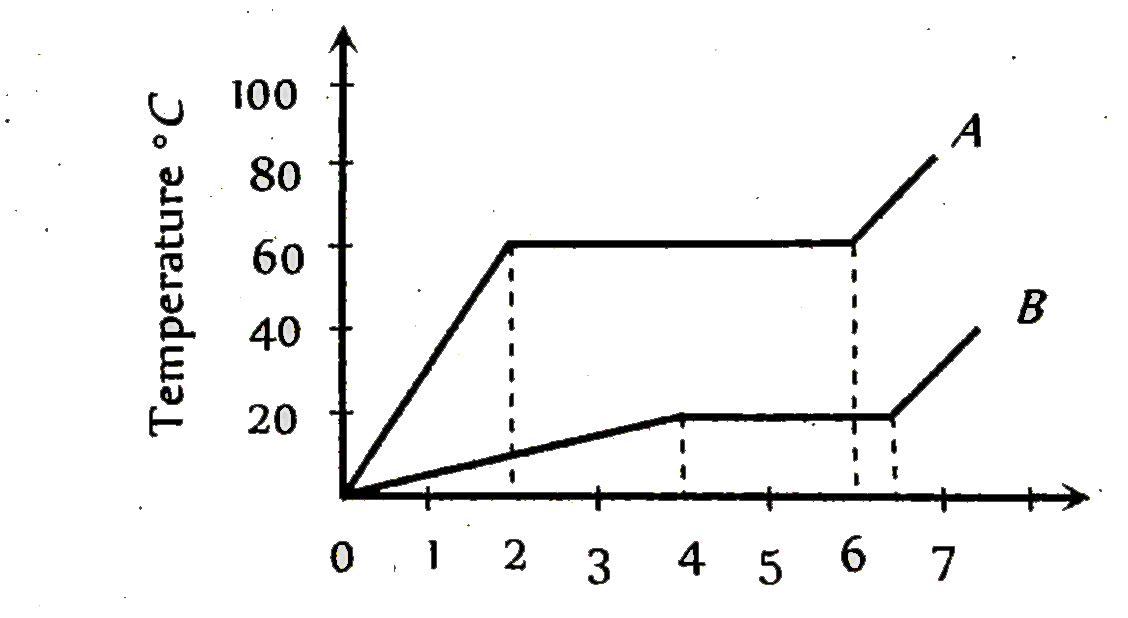
Two bodies of equal masses are heated at a uniform rate under identical conditions. The change in temperature in the two cases in shown graphically. What are their melting points?
Find the ratio of their specific heats and latent heats.
The melting points liquids I and II are C and C, respectively. Let R be the rate of supply of heat. We note from the graph that liquid I is heated through C in 2 units of time and that liquid II is heated through C in 4 units of time.
and
Hence,
We note further that the temperature of I remains constant for 4 units of time and that of II for 2 units of time.
and
Topper's Solved these Questions
- CALORIMETRYBook:CENGAGE PHYSICSChapter:CALORIMETRYExercise:Exercise 1.1
Explore 23 Videos
- CALORIMETRYBook:CENGAGE PHYSICSChapter:CALORIMETRYExercise:Exercise 1.2
Explore 22 Videos
- BASIC MATHEMATICSBook:CENGAGE PHYSICSChapter:BASIC MATHEMATICSExercise:Exercise 2.6
Explore 20 Videos
- CENTRE OF MASSBook:CENGAGE PHYSICSChapter:CENTRE OF MASSExercise:INTEGER_TYPE
Explore 1 Video
Similar Questions
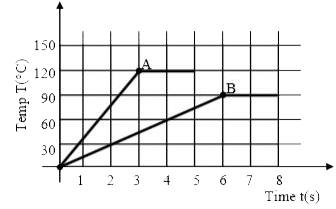
Two different metal bodies A and B of equal mass are heated at a uniform rate under similar conditions. The variation of temperature of the bodies is graphically represented as shown in the figure. The ratio of specific heat capacities is :
View SolutionTwo bodies of different materials but of equal mass are heated at uniform rate under identical conditions from 0∘C one body start melting at 60∘C after heating for 2 minutes while the other start melting at 40∘C after heating for 4 minutes. the ratio of their specific heats is
View Solution
Knowledge Check
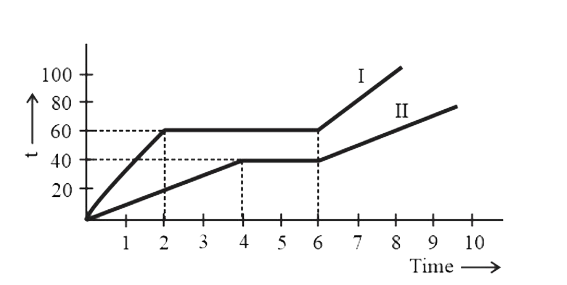
Two bodies of equal masses are heated at a uniform rate under identical conditions. The change in temperature in the two cases is shown graphically. The ratio of their specific heats in the solid state is
 A1:3B1:2C2:1D1:4
Two bodies of equal mass m are heated at a uniform rate under identical condition. Their change in temperature are shown. Then
(i) The ratio of melting point of the substances is 1.5
(ii) the ratio of their latent heats is 0.75
(iii) the ratio of specific heat of two substances is 0.33 in solid state
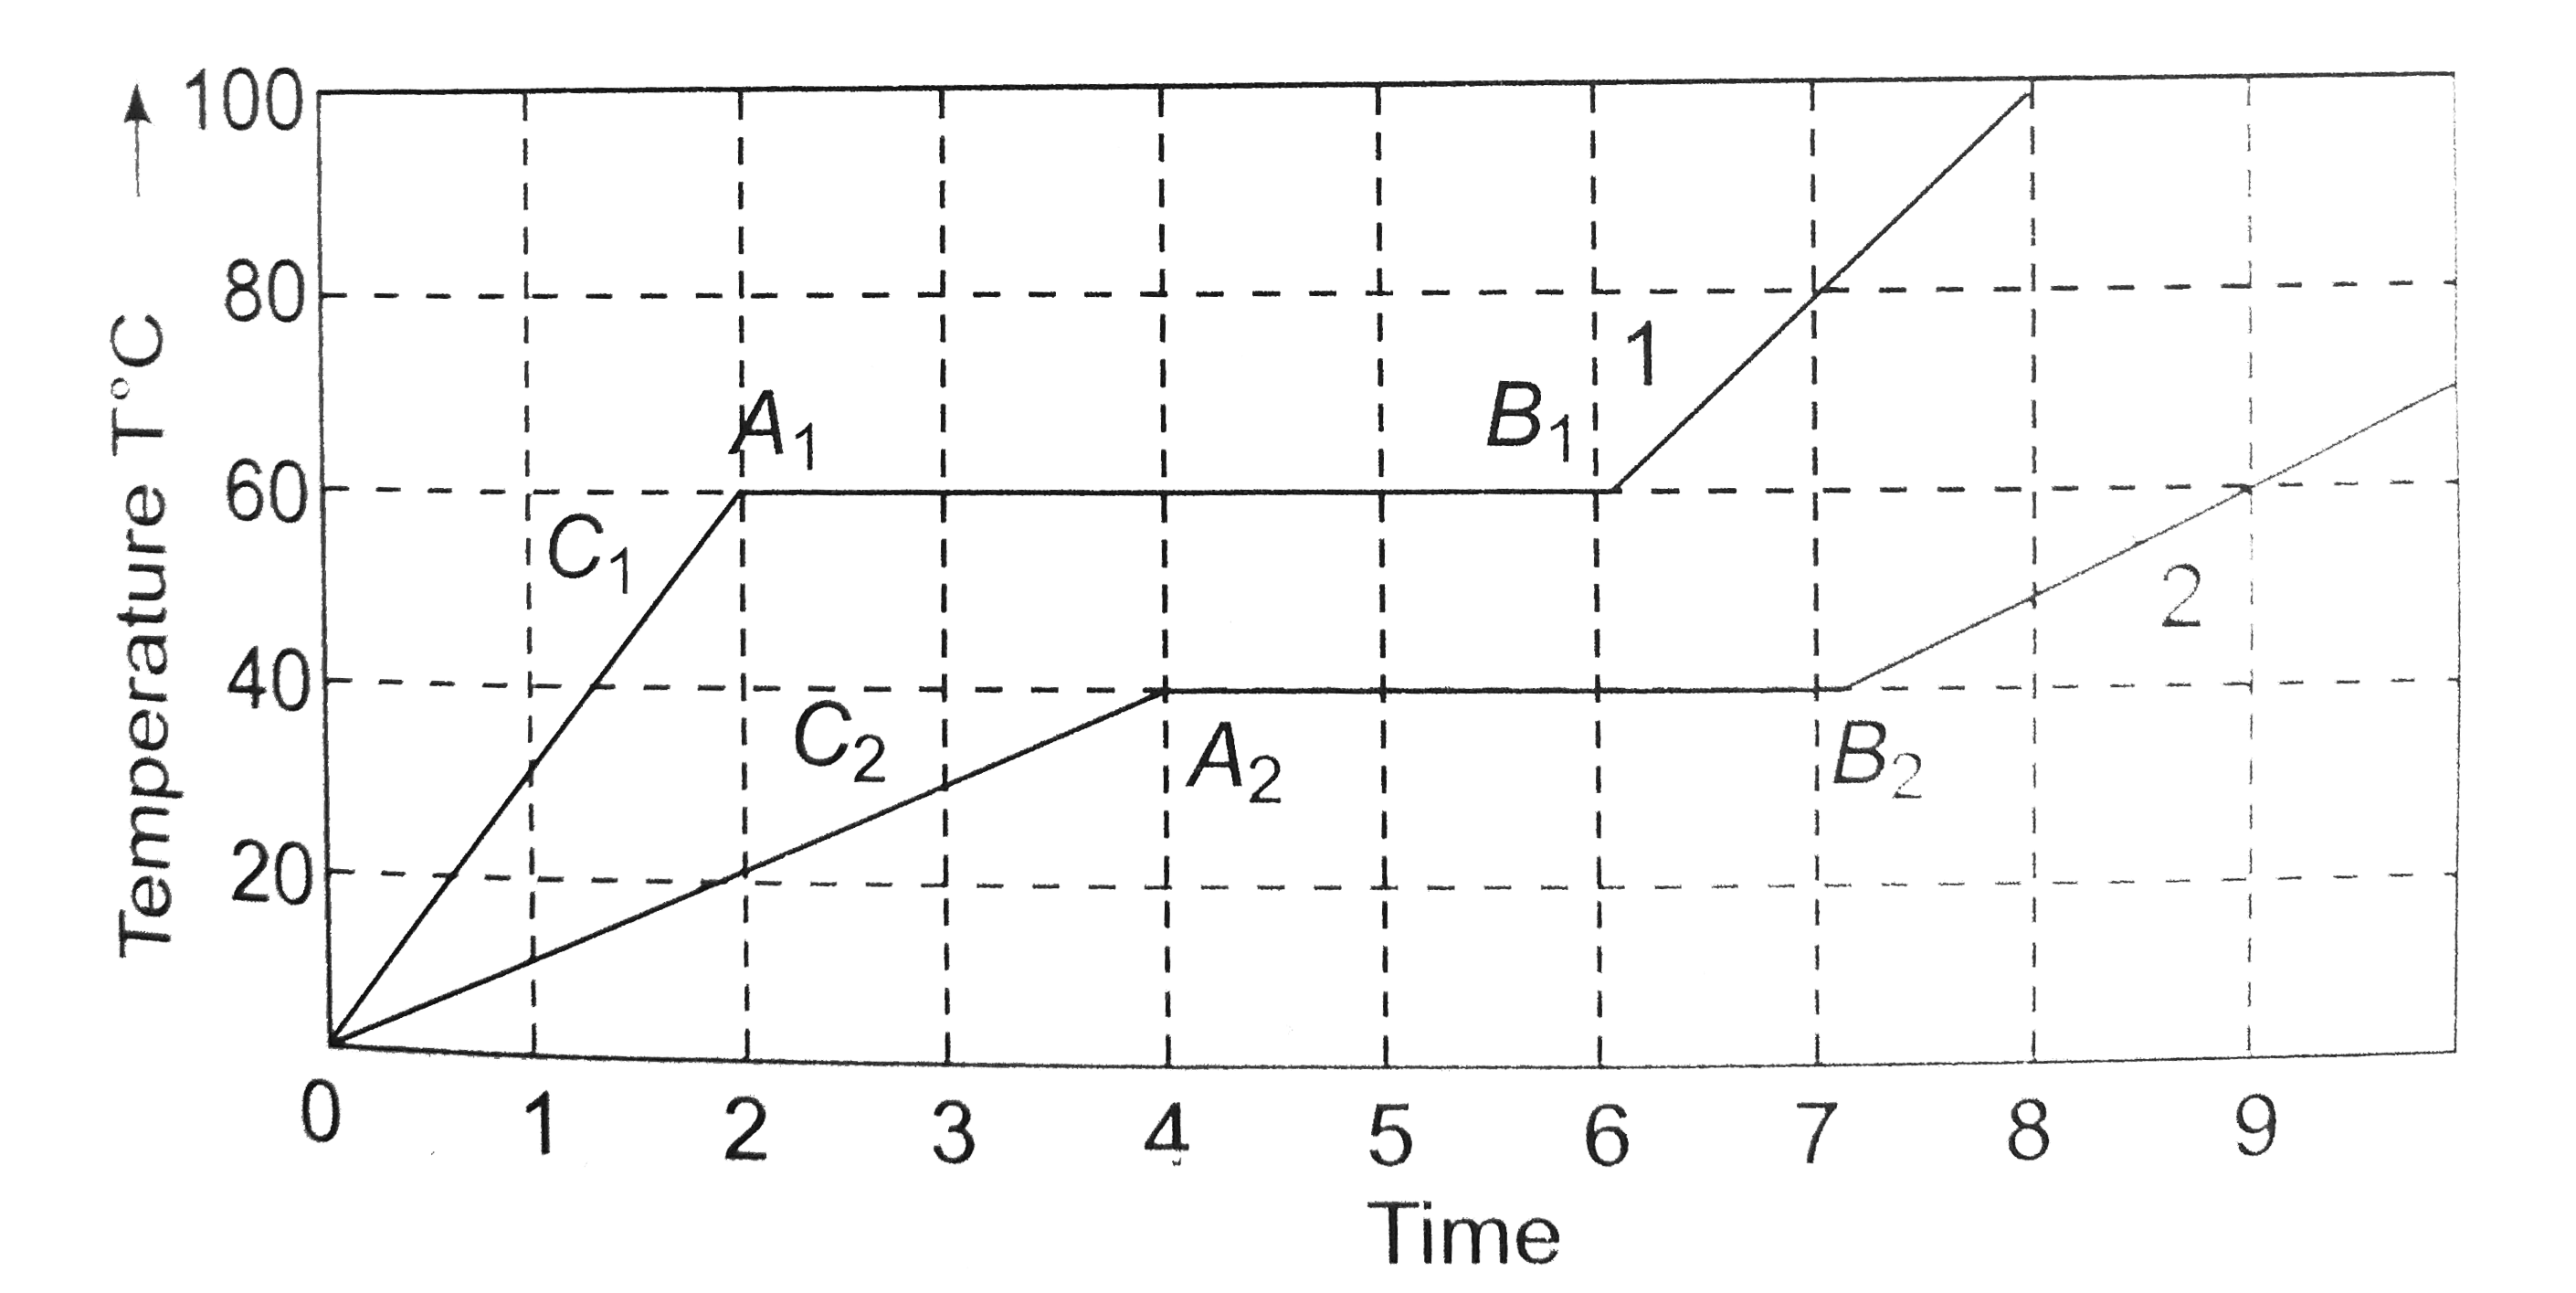
(iv) the ratio of specific heat of two substances is 2 in liquid state.A(i),(iii)B(ii),(iii)C(iii),(iv)DallTwo solid bodies of equal mass m initially at T=0∘C are heated at a uniform and same rate under identical conditions. The temperature of the first object with latent heat L1 and specific heat capacity in solid state C1 changes according to graph 1 on the diagram. the temperature of the second object withe latent heat L2 and specific heat capacity in solid state C2 changes according to graph 2 on the diagram. based on what is shown on the graph, the latent heat L1andL2 and the specific heat capacities C1andC2 in solid state obey which of the following relationships?
 AL1>L2,C1<C2BL1<L2,C1<C2CL1>L2,C1>C2DL1<L2,C1>C2
Two substances A and B of equal mass m are heated at uniform rate of 6cals−1 under similar conditions. A graph between temperature and time is shown in figure. Ratio of heat absorbed HA/HB by them for complete fusion is
View SolutionBoiling water is changing into steam. Under this condition the specific heat of water is
View SolutionBoiling water is changing into steam. Under this condition the specific heat of water is
View SolutionBoiling water is changing into steam. Under this condition the specific heat of water is
View SolutionBoiling water is changing into steam. Under this condition the specific heat of water is
View Solution