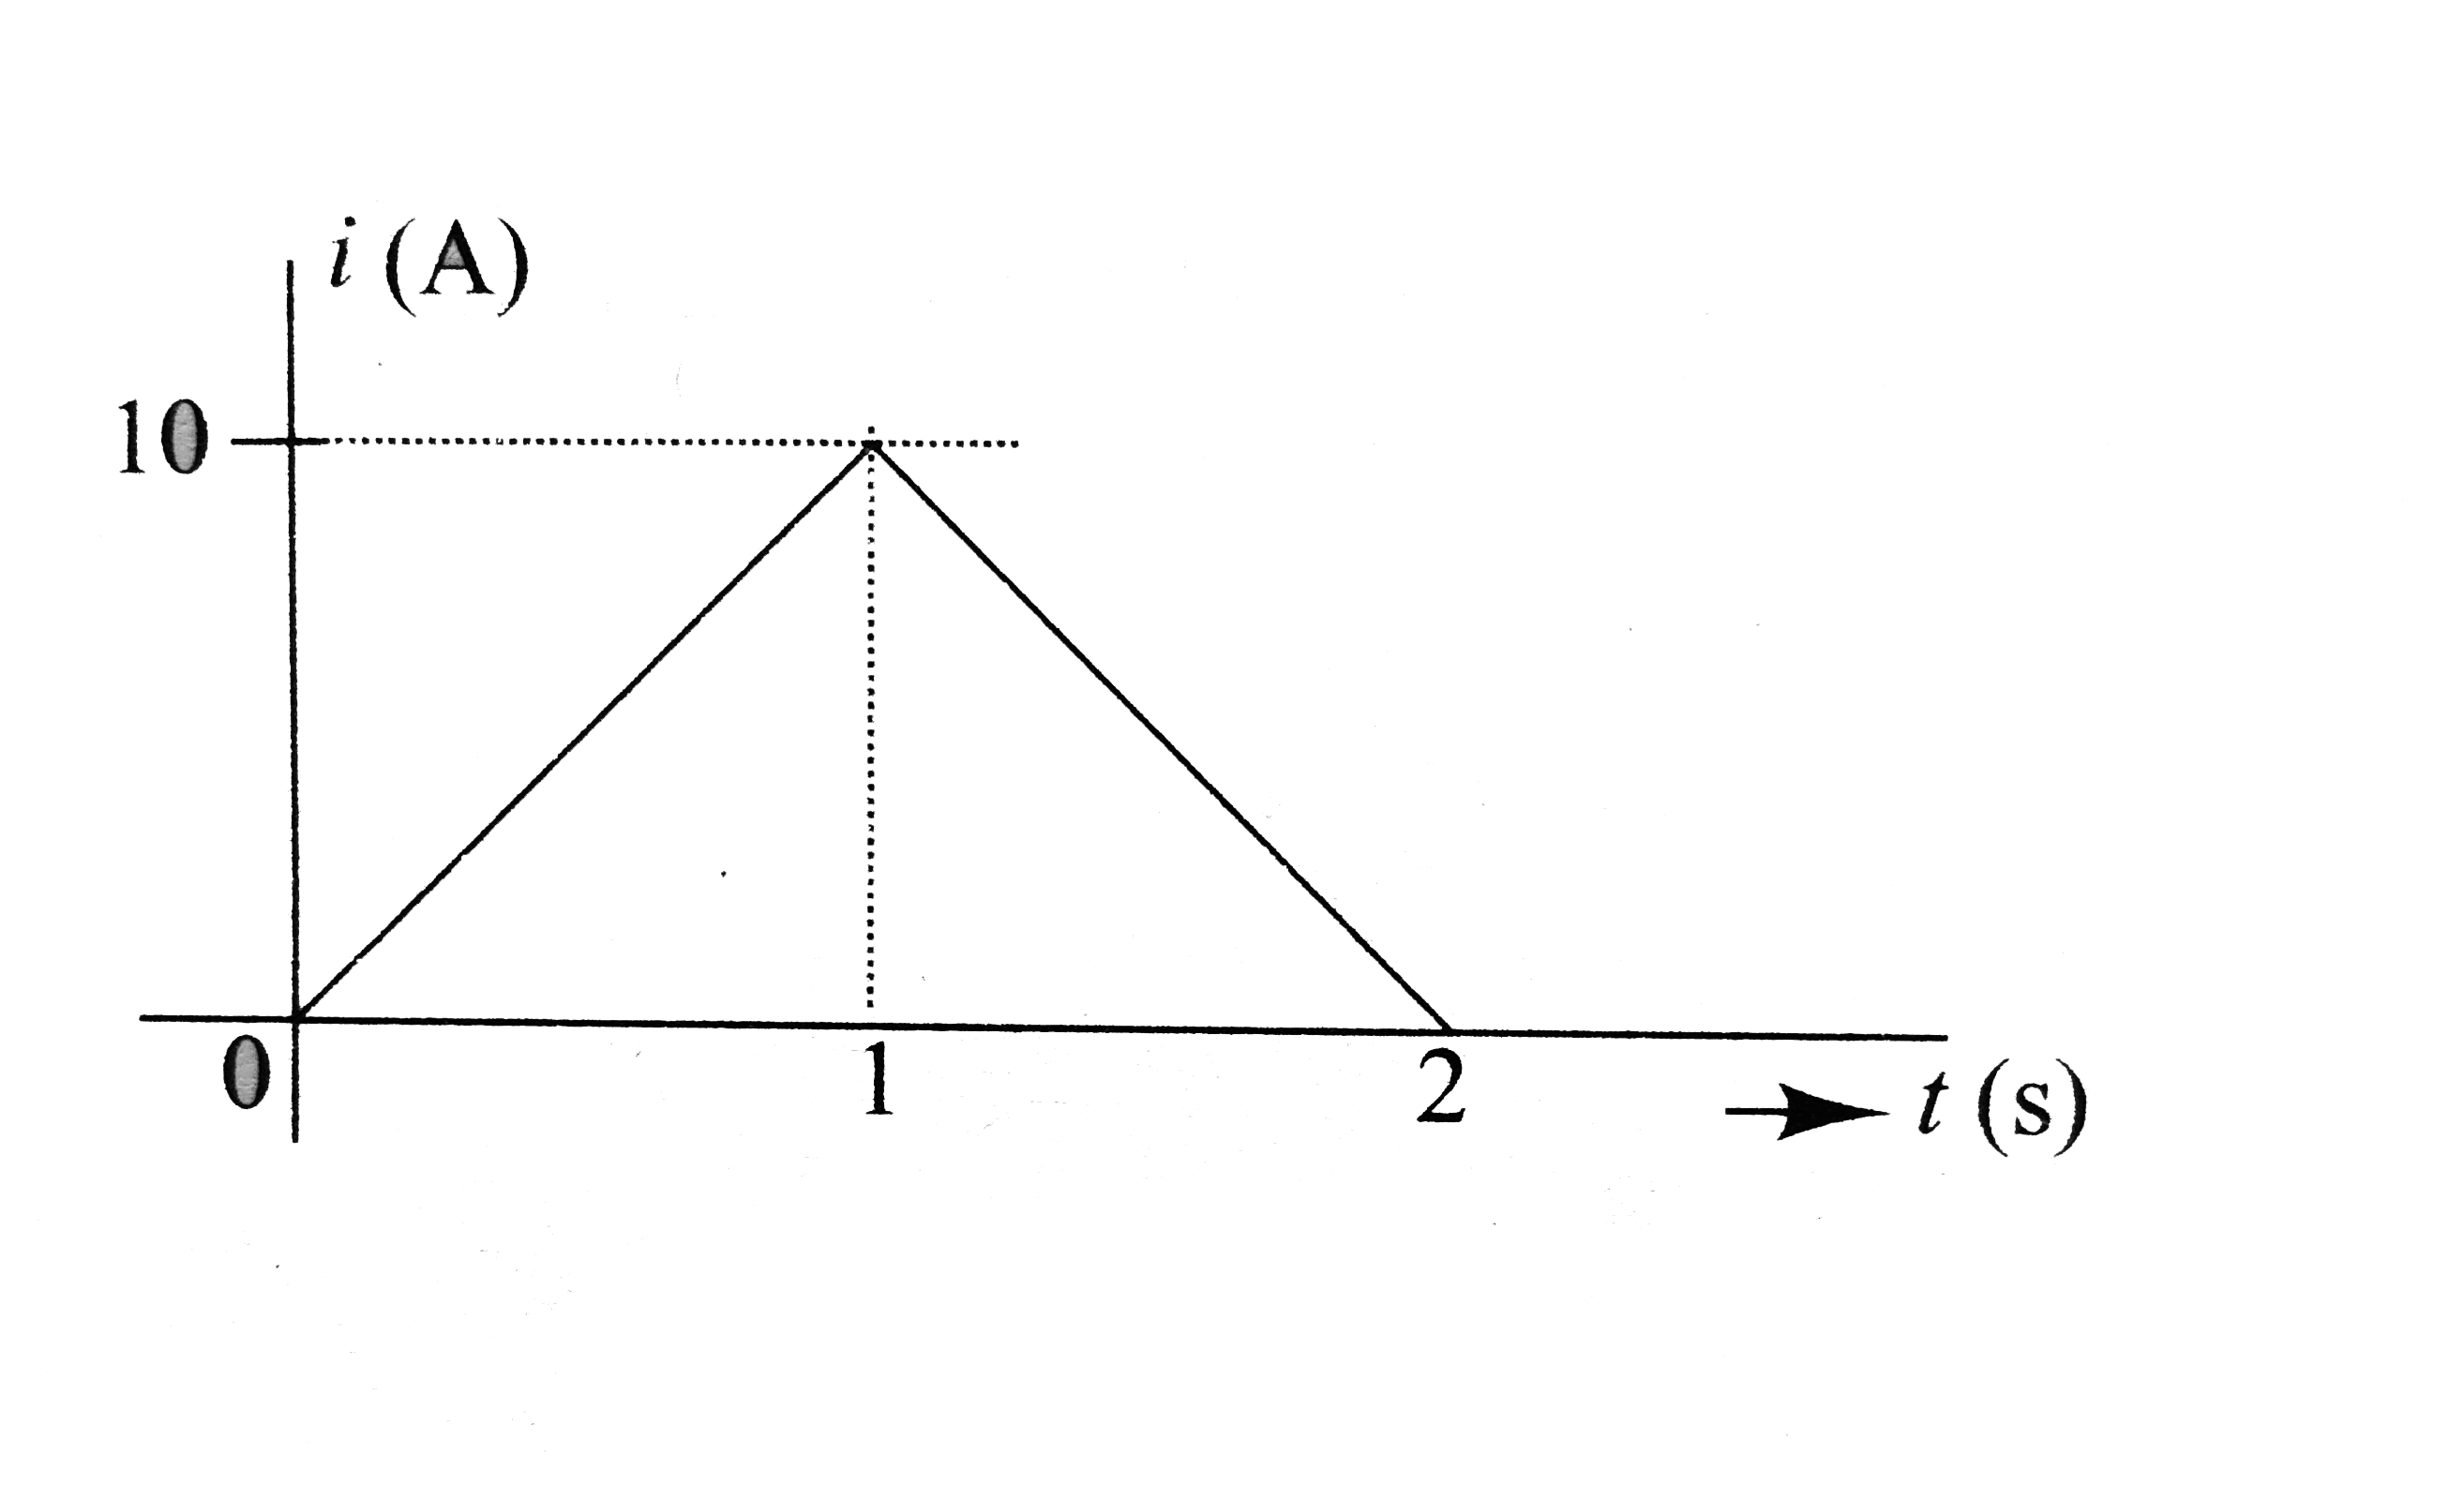
Find the avarage value of current (in A) shown graphically in fig. From t=0→t=2s.
 .
.
Video Solution
Text Solution
The correct Answer is:5
From the i-t graph, area from t=0 to t=2 s
12×2×10=10As
∴ Average current 102=5A.
|
Topper's Solved these Questions
- ALTERNATING CURRENTBOOK - CENGAGE PHYSICSCHAPTER - ALTERNATING CURRENTEXERCISE - Archives Subjective
1 Videos
- ALTERNATING CURRENTBOOK - CENGAGE PHYSICSCHAPTER - ALTERNATING CURRENTEXERCISE - Archives Single Correct
2 Videos
- ALTERNATING CURRENTBOOK - CENGAGE PHYSICSCHAPTER - ALTERNATING CURRENTEXERCISE - Exercises Linked Comprehension
25 Videos
- OSCILLATIONSBOOK - CENGAGE PHYSICSCHAPTER - OSCILLATIONSEXERCISE - QUESTION BANK
39 Videos
- ATOMIC PHYSICSBOOK - CENGAGE PHYSICSCHAPTER - ATOMIC PHYSICSEXERCISE - ddp.4.3
15 Videos
Similar Questions
Knowledge Check
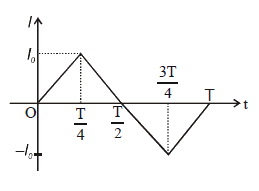
The average value of current for the current shown for time period 0 to T2 s
 Al0√2Bl02Cl0√3Dl02√3
Charge through a cross section of a conductor is give by Q=5t2−2t coulomb .Find the average current through the conduction the interval t1=2s to t2=4s .
A14AB28AC56AD7ACharge through a cross-section of a conductor is given by Q =5t2−2t coulomb. Find the average current through the conductor in the interval t1, = 2 s to t2= 4 s.
A14AB28AC56AD7A
If the current in an AC circuit is given by i=2√2sin(πt +π4), then the average value of current during time t=0 to t=1s is mπ ampere. Find m.
View SolutionThe electric current in a discharging R-C circuit is given by i=i0e−tRCwherei0 R and C are constant parameters and t is time. Let i0=2.00A,R=6.00×10⁵ohmandC=0.500μF.
a. Find the current at t=0.3 s.
b. Find the rate of change of current at t=0.3 s.
Find approximately the current at t=0.31 s.
View SolutionFind the effective value of current.
i=2sin100(π)t+2cos(100πt+30∘).
View SolutionFind the rms value of current from t=0 to t=2πω if the current varies as i=Imsinωt.
View SolutionFind the rms value of current from t=0 to t=2πω if the current avries as i=Imsinωt.
View Solution
