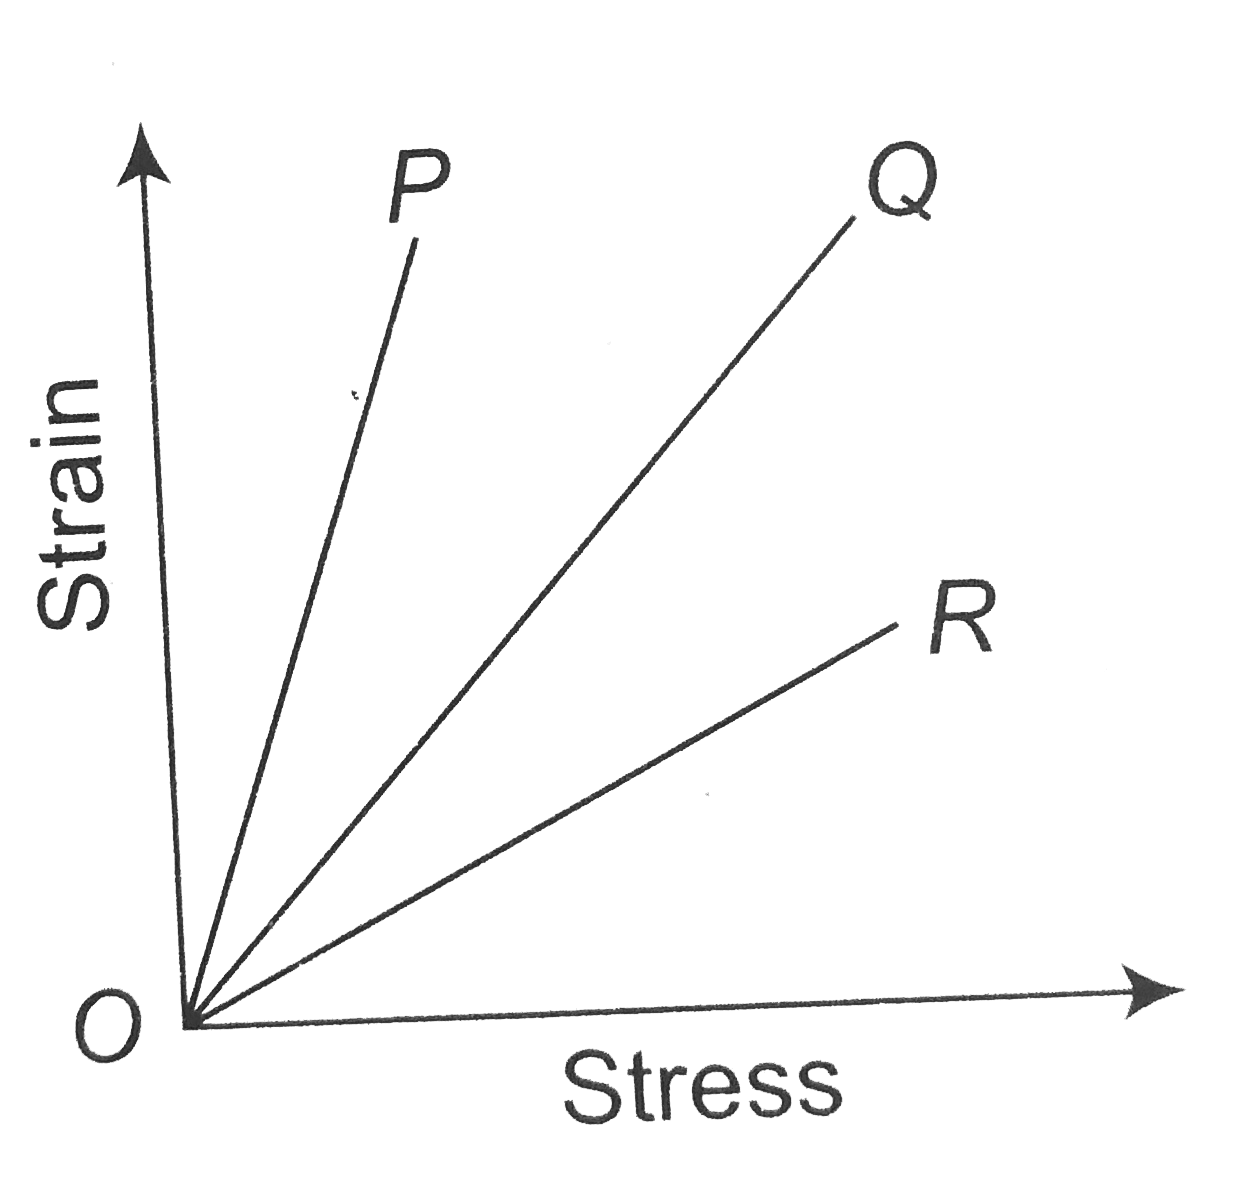
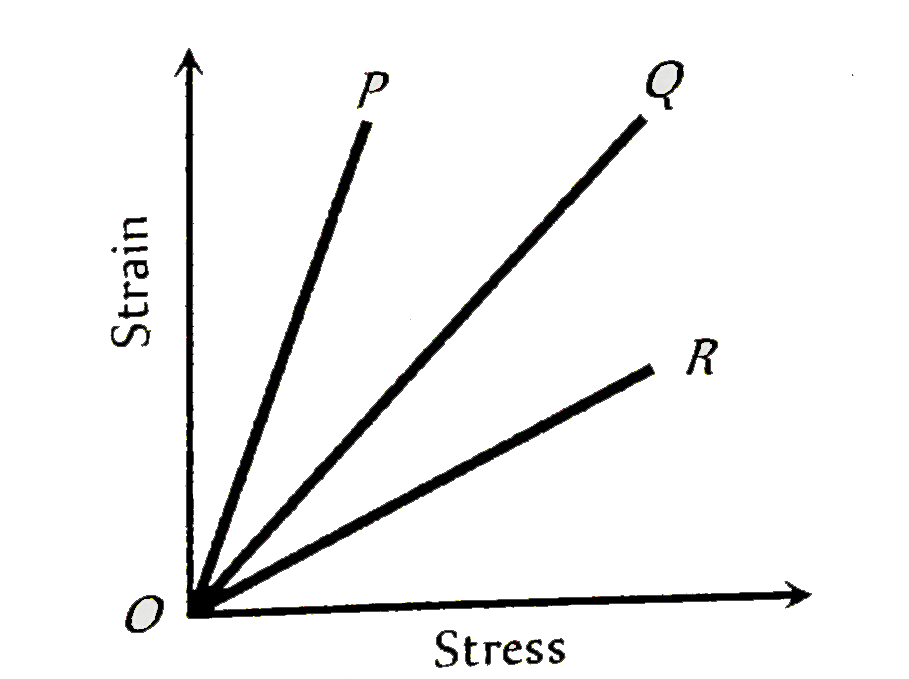
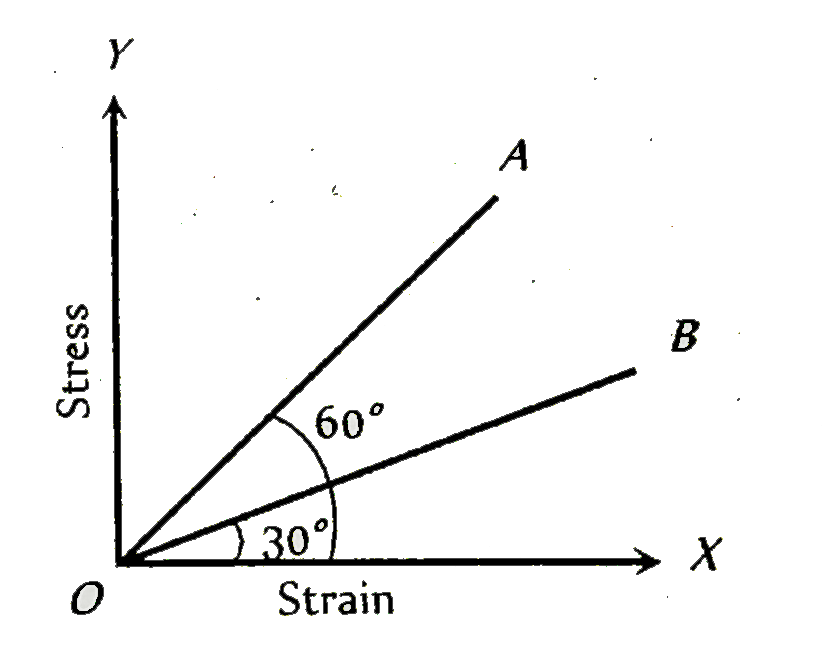
The strain stress curves of three wires of different materials are shown in the figure. P, Q and R are the elastic limits of the wires. The figure shown that
elasticity of wire P is maximum
elasticity of wire Q is maximum
tensile strength of wire R is maximum
None of the above
The correct Answer is:c
As stress is shown Y=cotθ=1tanθ=1slope
So, elasticity of wire P is minimum and or wire R is maximum.
Topper's Solved these Questions
- ELASTICITY Book:MHTCET PREVIOUS YEAR PAPERS AND PRACTICE PAPERSChapter:ELASTICITY Exercise:MHT CET CORNER
Explore 16 Videos
- ELASTICITY Book:MHTCET PREVIOUS YEAR PAPERS AND PRACTICE PAPERSChapter:ELASTICITY Exercise:EXERCISE 1
Explore 66 Videos
- CURRENT ELECTRICITYBook:MHTCET PREVIOUS YEAR PAPERS AND PRACTICE PAPERSChapter:CURRENT ELECTRICITYExercise:MHT CET CORNER
Explore 32 Videos
- ELECTROMAGNETIC INDUCTIONBook:MHTCET PREVIOUS YEAR PAPERS AND PRACTICE PAPERSChapter:ELECTROMAGNETIC INDUCTIONExercise:MHT CET CONER
Explore 34 Videos
Similar Questions
Knowledge Check
The strain-stress curves of three wires of different materials ar shown in the figure P,Q and R are the elastic limits of the wires. The figure shows that :
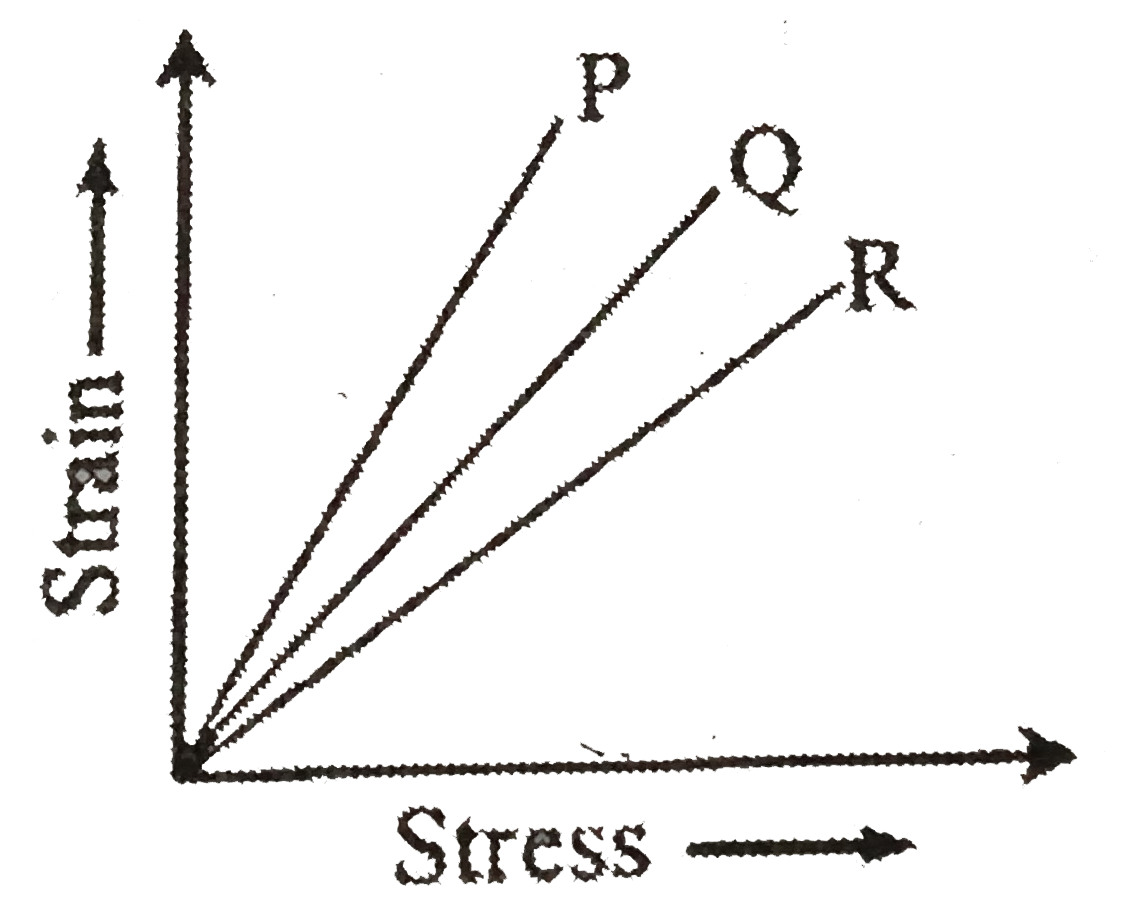 Aelasticity of wire P is maximumBelasticity of wire Q is maximumCtensile strength of R is maximumDnone of the above
The strain-stress curves of three wire of different materials are shown in the figure. P,Q and R are the elastic limits of the wires. The figures shows that
 AElasticity of wire P is maximumBElastiity of wire Q is maximumCTensile strength of R is maximumDNone of the above is true
The stain-stress curves of three wires of different material are showm in the figure P,Q,R are the elastic limits of the wires, the figure shows that
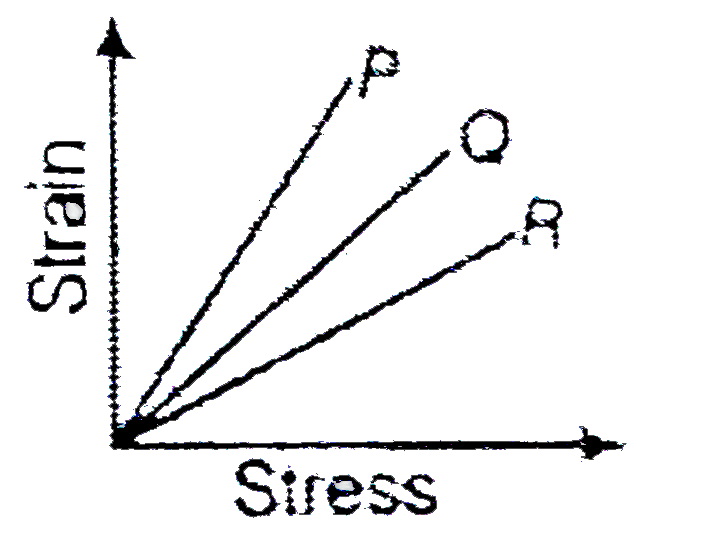 Aelasticity of wire P is maximumBelasitcity of wire R is maximumCtensile strenght of R is maximumDNone the above
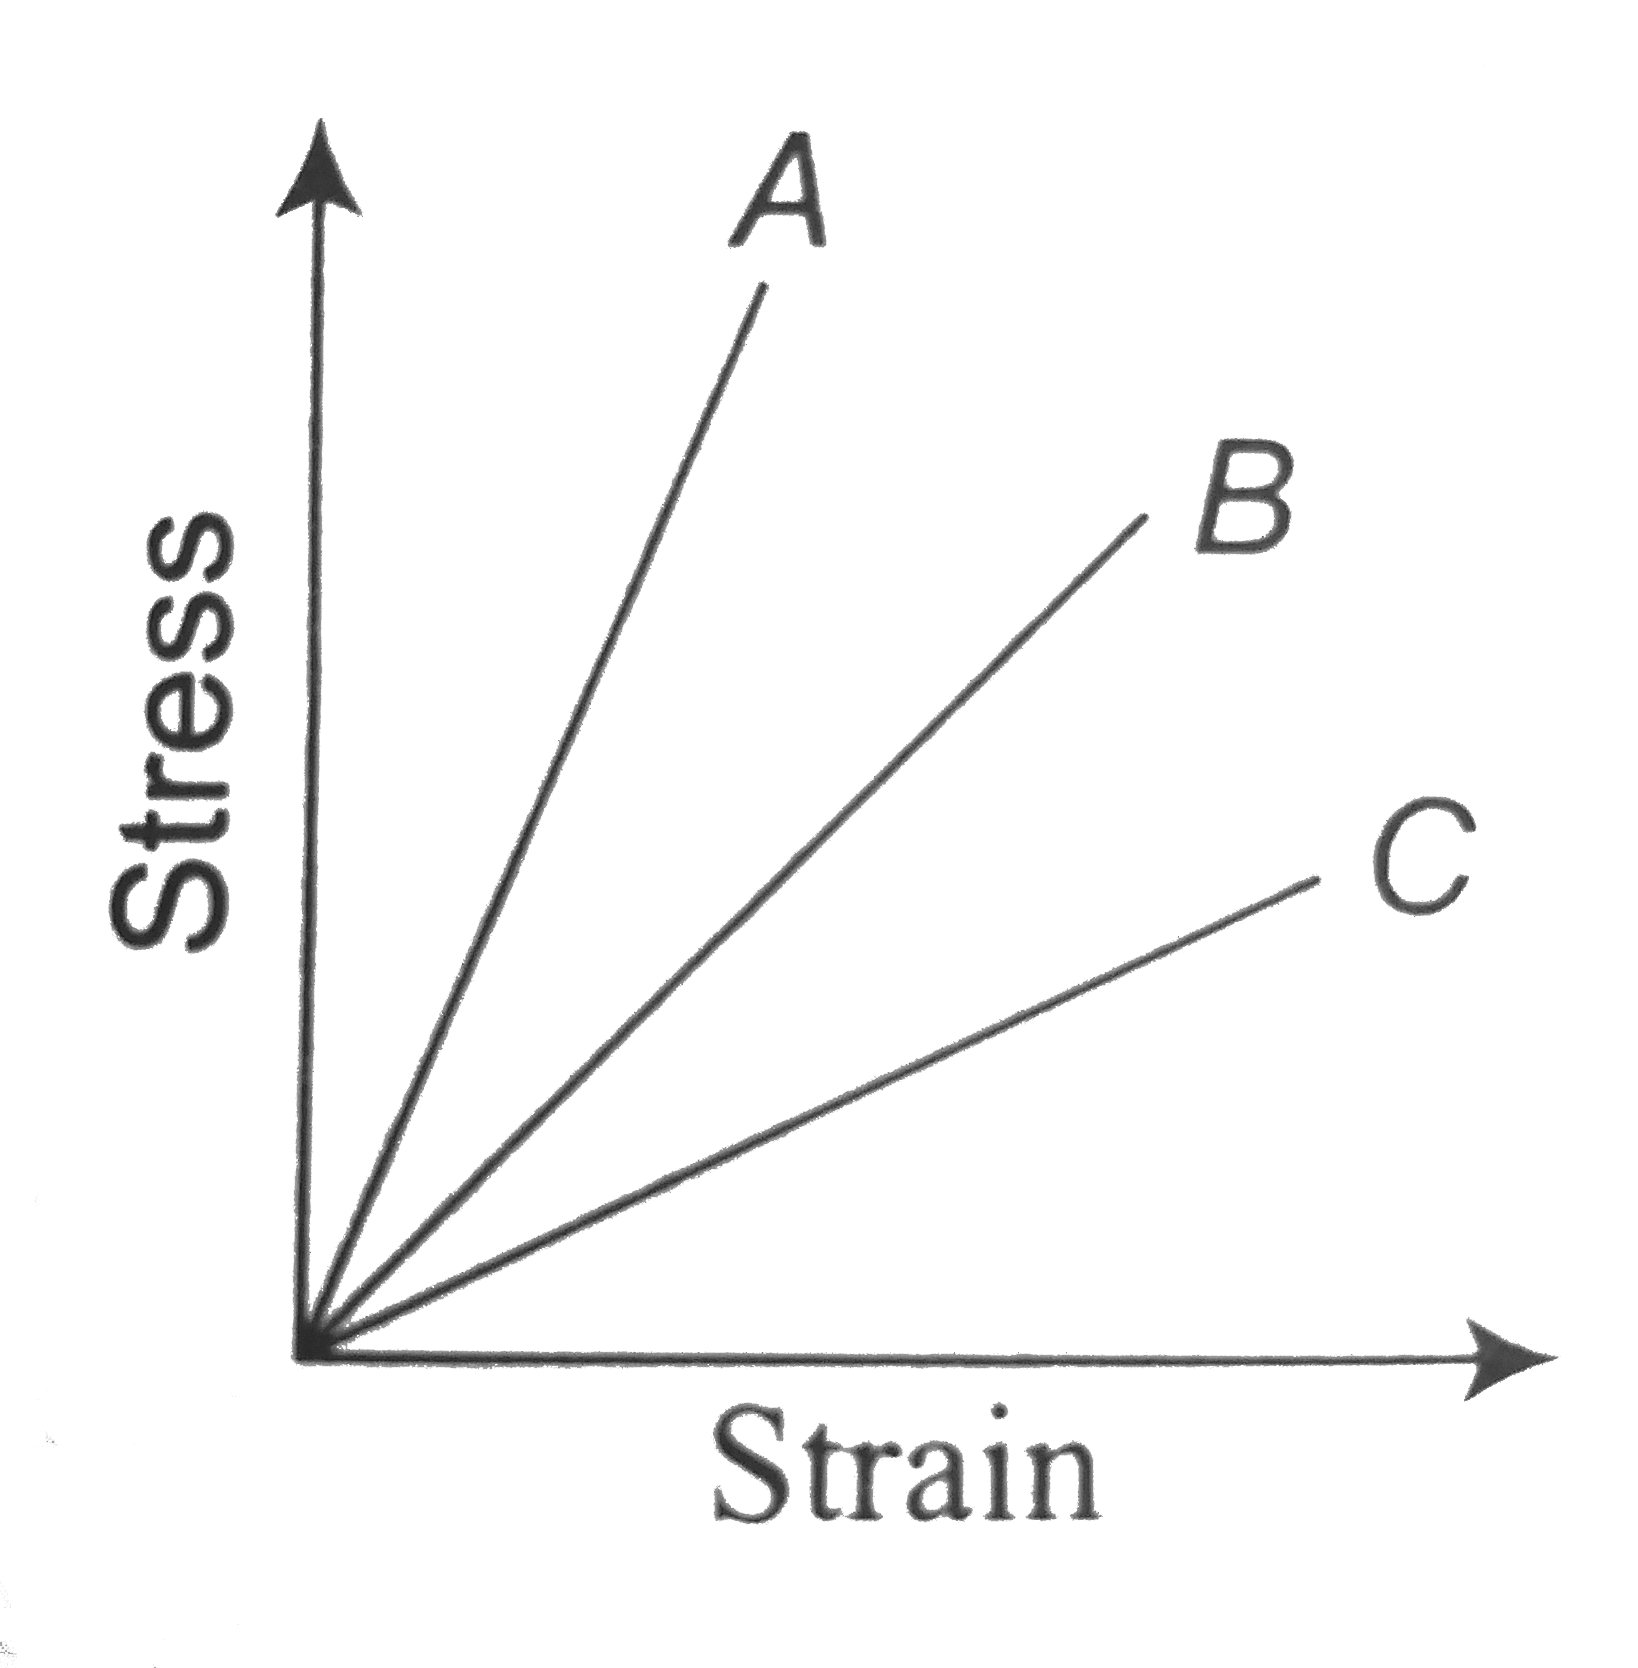
The stress strain curves for brass, steel and rubber are shown in the figure. The lines A, B and C are for
View Solution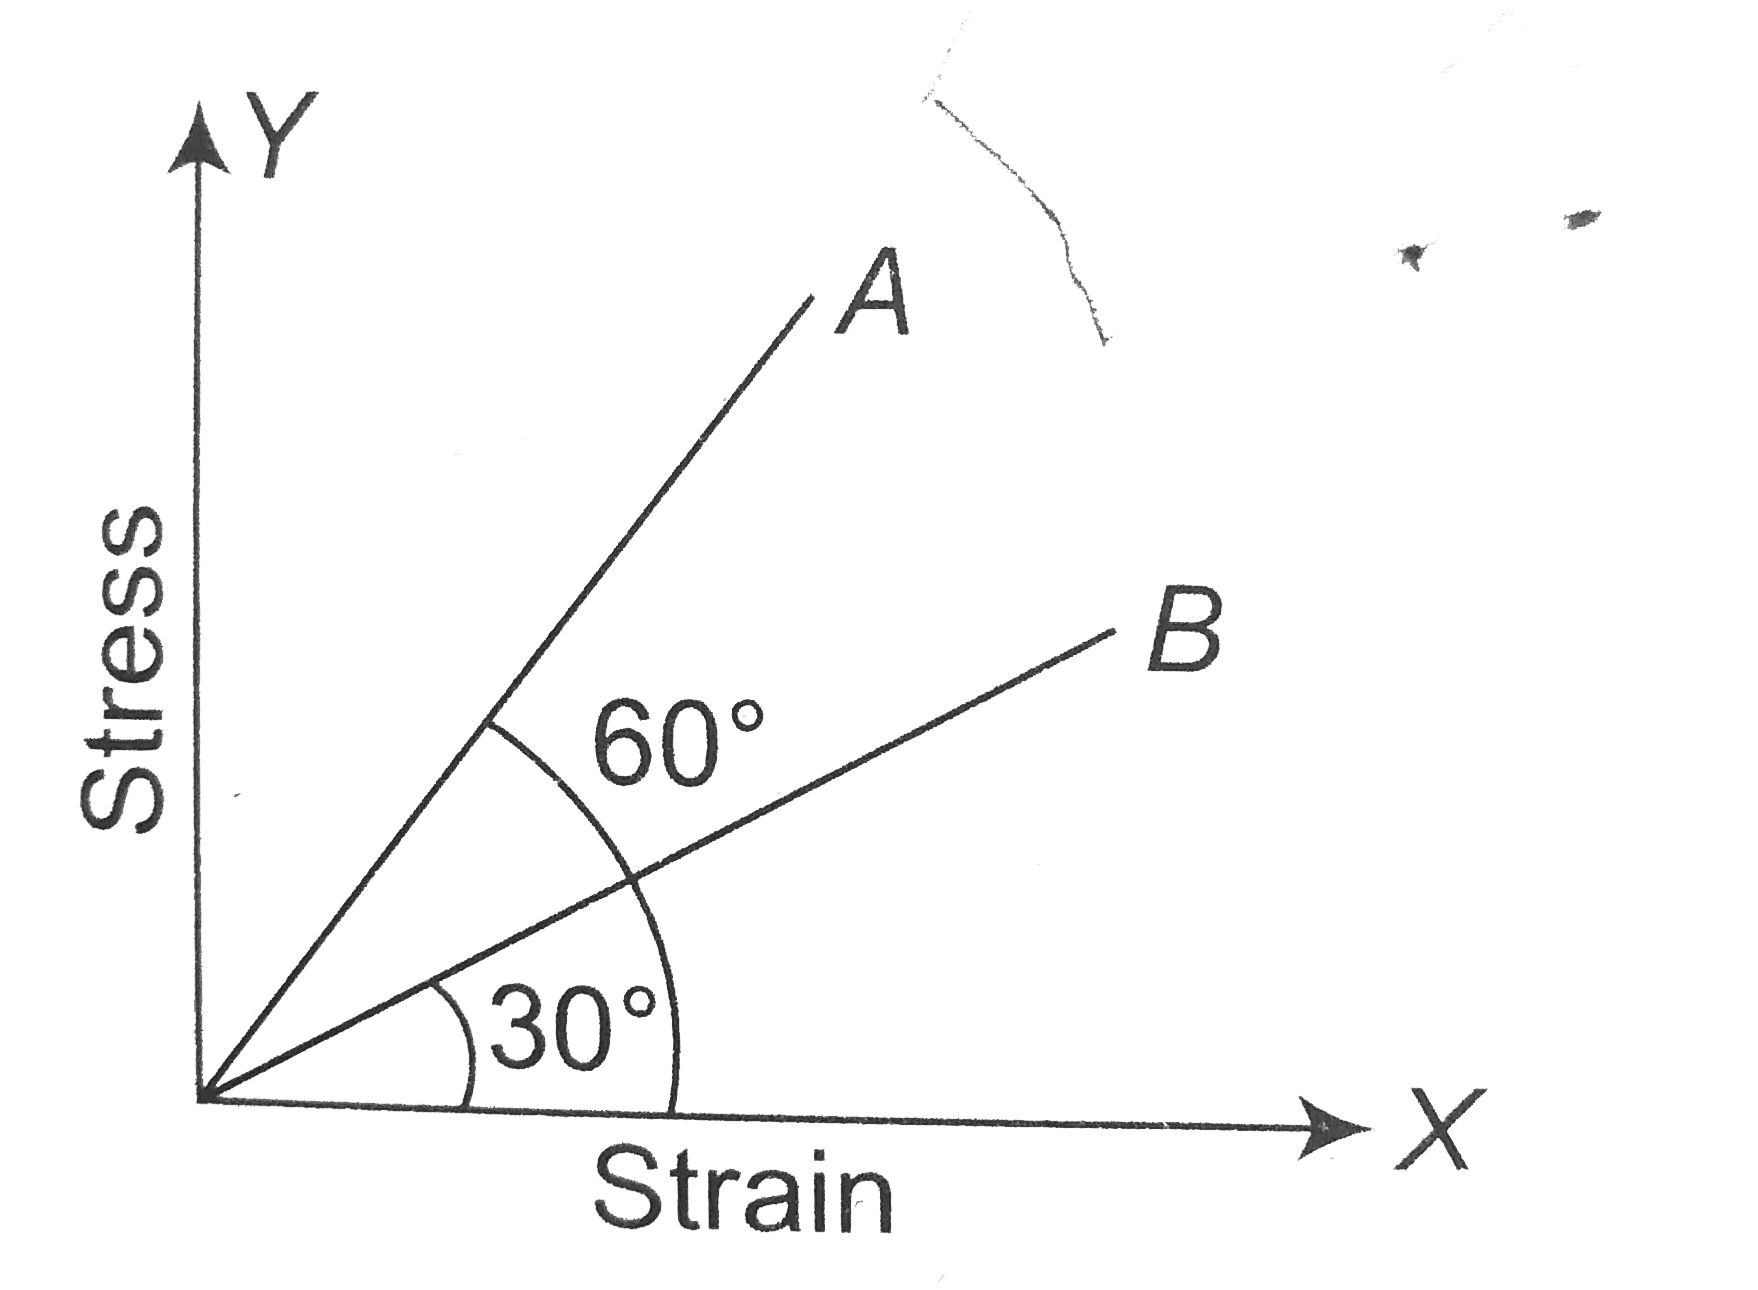
The stress versus strain graphs for wires of two materials A and B are as shown in the figure. If YA and YB are the Young's moduli of the materials then
View SolutionThe stress versus strain graphs for wires of two materials A and B are as shown in the figure. If YAandYB are the younng's moduli of the materials, then
View SolutionA wire is sliding as shown in Figure. The angle between the acceleration and the velocity of the wire is
View SolutionIf linear charge density of a wire as shown in the figure is λ
View Solution


